Green (Indicator): Difference between revisions
mNo edit summary |
No edit summary |
||
| Line 1: | Line 1: | ||
{{learned|what the green indicator is|how the green indicator | {{learned|what the green indicator is|how the green indicator is calculated|how to adjust your project in order to make the indicator functional}} | ||
==General== | |||
===What is the Green indicator?=== | |||
The green indicator calculates the amount of nature and green constructions in a neighborhood. The indicator then relates this to the amount of houses in the area. A target can be set for the amount of green per house. | |||
This indicator is useful for projects where for example: | |||
* livability is an important aspect in the project | |||
* the project area should become climate adaptive | |||
This Excel indicator can be downloaded from the [https://store.tygron.com/ Tygron Index]. Read on to find out more about the indicator's calculation method and how to set it up in your project. | |||
===Indicator panel=== | |||
[[File:Indicator_panel_sun.JPG|300px|right]] | |||
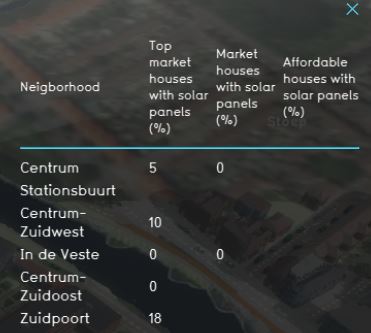
The indicator panel shows per neighborhood: | |||
* the neighborhood name | |||
* the current amount of green (m2) in the neighborhooud | |||
* the calculated amount of green (m2) in the neighborhood | |||
* how much green in (m2) per neighborhood should be build | |||
===Calculation=== | |||
===Score=== | |||
==Additional configurations== | |||
For this indicator to function, three globals to set the targets have to be defined. Read below for the steps. | |||
===Add the Globals=== | |||
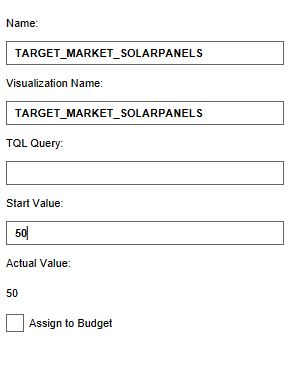
The targets for the amount of houses that should have solar panels for the three different housing categories are set in three different [[Global|globals]]. To learn more about what a global is, please go to the [[Globals]] page. | |||
{{Editor steps|title=|Select ''Current Situation'' and then hover over ''TQL Queries'' in the ribbon header| Click on ''Add Global'' in the hover panel. A new global named VARIABLE will be added to the left panel.| Select the global VARIABLE.| In the right panel, change the name to TARGET_TOPMARKET_SOLARPANELS| Change the start value to a number representing the percentage of houses that should have solar panels.|Repeat steps 2 to 5 for the targets TARGET_MARKET_SOLARPANELS and TARGET_AFFORDABLE_SOLARPANELS and fill in their values| Hover over the Auto update icon and choose for Reset to Start values (faster) to update your project.}} | |||
<gallery mode=nolines> | |||
File:Add_global_new_interface.JPG | |||
File:Set_globals_solar_panels.JPG | |||
File:Recalculate_excel.JPG | |||
</gallery> | |||
[[Category:Index]] | |||
==How is the green indicator implemented in the {{software}}?== | ==How is the green indicator implemented in the {{software}}?== | ||
[[File:indicator_editor_screen_-_green.jpg|framed|right|The right panel with the green indicator selected.]] | [[File:indicator_editor_screen_-_green.jpg|framed|right|The right panel with the green indicator selected.]] | ||
The green | The green indicator indicates how much green should exist per house in the 3D world. A 3D world with fewer houses will require less green than a 3D world with lots of houses. The indicator scores based on how much green in m² exists per house. The higher this value, the better. | ||
For example, if you have 300m² of green, and 4 houses, you would have 300/4 = 75m² of green per house. If your target is 100m² green per house, you would score 75%. | For example, if you have 300m² of green, and 4 houses, you would have 300/4 = 75m² of green per house. If your target is 100m² green per house, you would score 75%. | ||
| Line 15: | Line 48: | ||
; Amount of green area in m² per house. Higher is better. | ; Amount of green area in m² per house. Higher is better. | ||
: The amount of green area which should exist per house. | : The amount of green area which should exist per house. | ||
Revision as of 13:49, 23 August 2019
General
What is the Green indicator?
The green indicator calculates the amount of nature and green constructions in a neighborhood. The indicator then relates this to the amount of houses in the area. A target can be set for the amount of green per house. This indicator is useful for projects where for example:
- livability is an important aspect in the project
- the project area should become climate adaptive
This Excel indicator can be downloaded from the Tygron Index. Read on to find out more about the indicator's calculation method and how to set it up in your project.
Indicator panel
The indicator panel shows per neighborhood:
- the neighborhood name
- the current amount of green (m2) in the neighborhooud
- the calculated amount of green (m2) in the neighborhood
- how much green in (m2) per neighborhood should be build
Calculation
Score
Additional configurations
For this indicator to function, three globals to set the targets have to be defined. Read below for the steps.
Add the Globals
The targets for the amount of houses that should have solar panels for the three different housing categories are set in three different globals. To learn more about what a global is, please go to the Globals page.
- Select Current Situation and then hover over TQL Queries in the ribbon header
- Click on Add Global in the hover panel. A new global named VARIABLE will be added to the left panel.
- Select the global VARIABLE.
- In the right panel, change the name to TARGET_TOPMARKET_SOLARPANELS
- Change the start value to a number representing the percentage of houses that should have solar panels.
- Repeat steps 2 to 5 for the targets TARGET_MARKET_SOLARPANELS and TARGET_AFFORDABLE_SOLARPANELS and fill in their values
- Hover over the Auto update icon and choose for Reset to Start values (faster) to update your project.
How is the green indicator implemented in the Tygron Platform?
The green indicator indicates how much green should exist per house in the 3D world. A 3D world with fewer houses will require less green than a 3D world with lots of houses. The indicator scores based on how much green in m² exists per house. The higher this value, the better.
For example, if you have 300m² of green, and 4 houses, you would have 300/4 = 75m² of green per house. If your target is 100m² green per house, you would score 75%.
Indicator targets
The green indicator has 1 value for a target.
- Amount of green area in m² per house. Higher is better.
- The amount of green area which should exist per house.

