Traffic Model: Difference between revisions
mNo edit summary |
|||
| Line 79: | Line 79: | ||
File:Geo_data_11.jpg| 11. Select 'Finish' | File:Geo_data_11.jpg| 11. Select 'Finish' | ||
</gallery> | </gallery> | ||
===Create GeoJSON File=== | ===Create GeoJSON File=== | ||
Revision as of 14:46, 30 March 2020
What is a Traffic Model
From Wikipedia, the free encyclopedia
A traffic model is a mathematical model of real-world traffic, usually, but not restricted to, road traffic. Traffic modeling draws heavily on theoretical foundations like network theory and certain theories from physics like the kinematic wave model. The interesting quantity being modeled and measured is the traffic flow, i.e. the throughput of mobile units (e.g. vehicles) per time and transportation medium capacity (e.g. road or lane width).
How does a Traffic Model relate to the Tygron Platform?
The main purpose of the default traffic model in the Tygron Platform is to calculate the effects of traffic on the 3D World through traffic densities. In order to calculate this impact, data such as the number of traffic lanes, the traffic speed and the traffic flow on a particular lane can be added to the project. The traffic model is a static model that does not change by carrying out Actions, Upgrades or Measures for example. Read below how to create your own dynamic traffic model and use it in the Tygron Platform. The following overlays show data from/effects of the traffic model:
Traffic Data
When creating a new project a traffic model is generated for the selected project area, based on available open data sources. The following datasets are used:
Edit Traffic data

Height offset
This field specifies the height offset of a bridge.
Units per hour
This field specifies the number of units that can drive on a road in an hour.
Lanes
This field specifies the number of lanes that a road can have.
Noise Sigma
This field specifies the correction factor at reference traffic speed [1].
This value is used in the calculation of the Traffic Noise (Overlay).
Noise Tau
This field specifies the correction factor per 10 km/hour deviation from reference traffic speed [2].
This value is used in the calculation of the Traffic Noise (Overlay).
Speedlimit
This field specifies the max allowed speedlimit on road or part of a road.
Add a custom Traffic Model
It is also possible to creata and add a custom traffic model, better suited for your use case. The traffic model can be either a static model (the model and data do not change in the project) or a dynamic model (the model and data change when something in the 3D world changes).
Static Traffic Model
A static model does not change (over time), when changes occur in the 3D world.
This type of model can be used when you for example have a scenario for 2030 ready that contains the traffic intensities then and want to use this data in your project.
To upload the dataset, create a Geojson file of the data and make sure the features contain an attribute with the number of units/hour. This attribute will overwrite the current TRAFFIC_FLOW attribute of the roads.
When importing this data, Constructions that are intersected by sections of the imported data are given the new traffic flow attribute of imported data.
- Select the Geo Data header
- Select the Geo Import bar
- Notice that a Geo Data Wizard window appears
- In the data wizard select the type 'Buildings'
- Select the 'Import a GeoJson file' option in step 1
- Select the GeoJson file you wish to add in step 1
- View the features of the selected GeoJson file in step 2
- Select the 'No Filtering' option in step 3
- Select the option 'Only update existing building with attributes' and the option 'Any Building' in step 4
- Ensure that the attribute TRAFFIC_FLOW is activated in the list of attributes in step 5
- Select 'Finish' in step 6
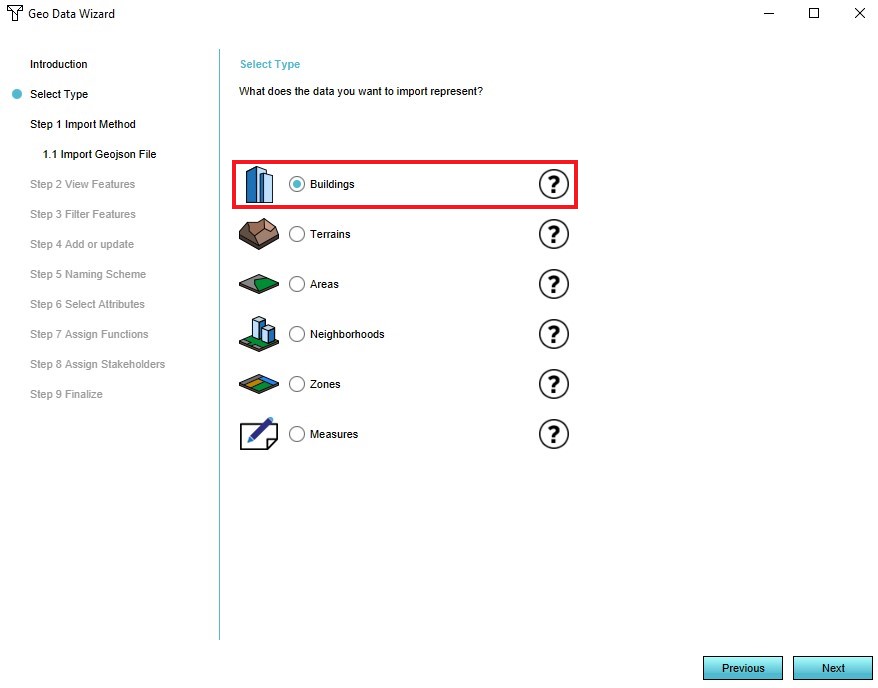
4. Select 'Buildings' type
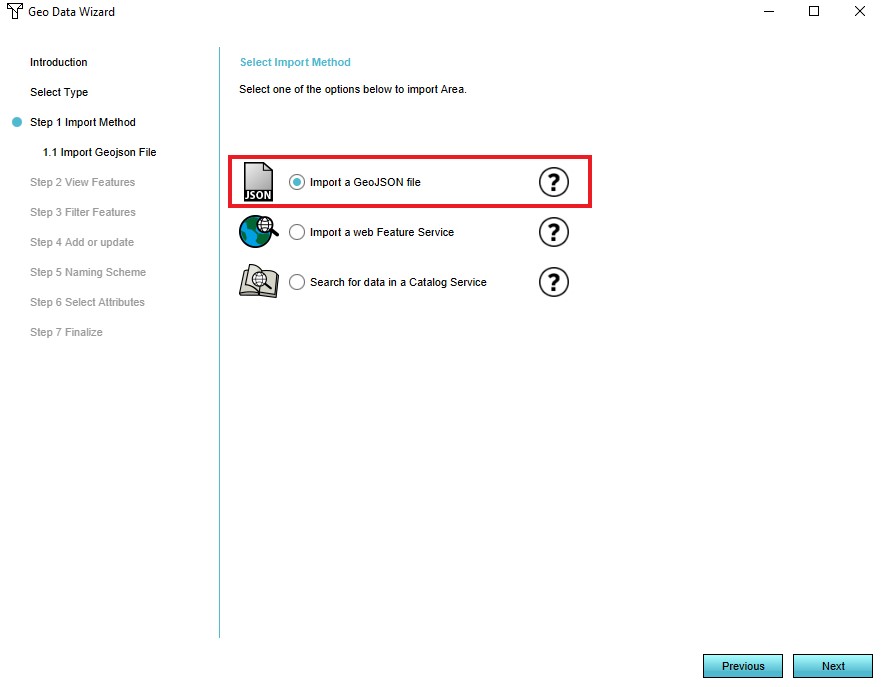
5. Select the 'Import a GeoJson file option'
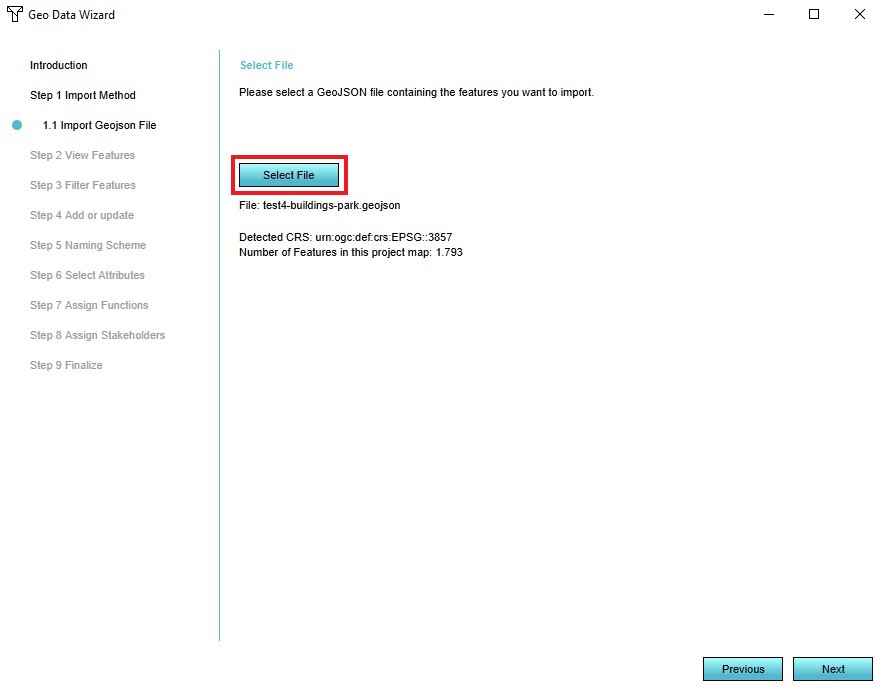
6. Select the GeoJson file you wish to add
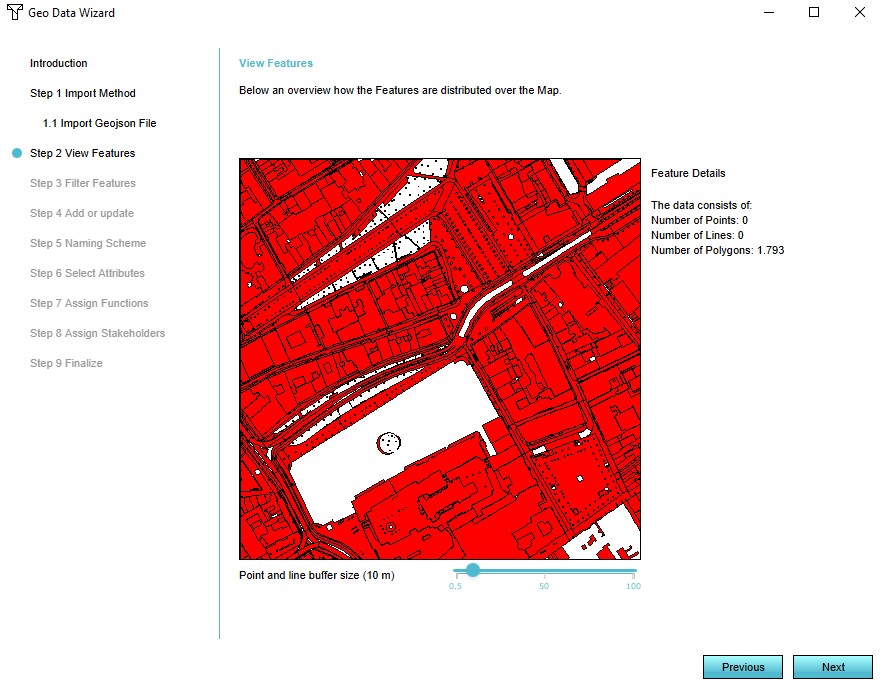
7. View the features of the selected GeoJson file
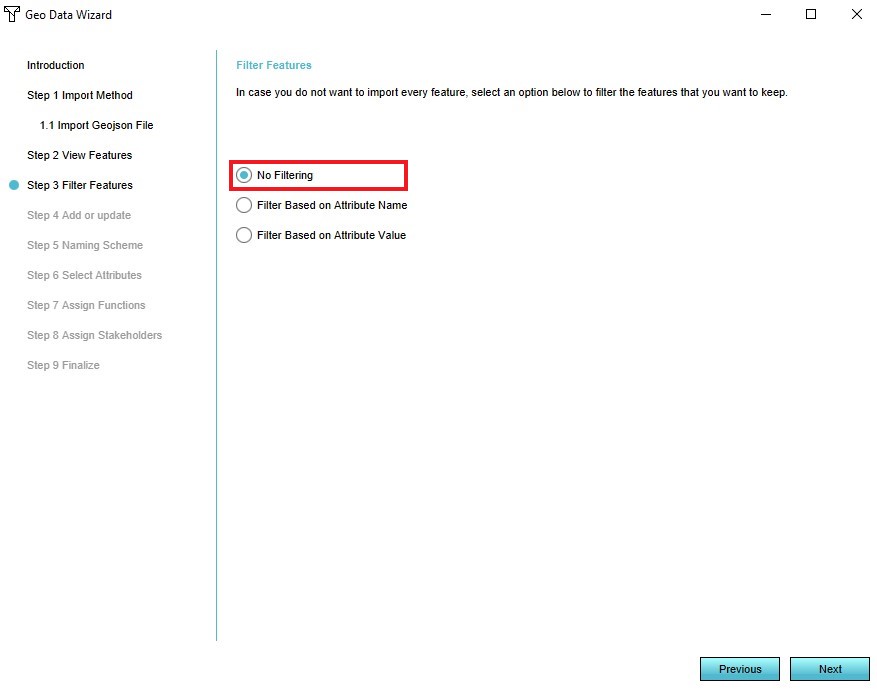
8. Select the 'No Filtering option'
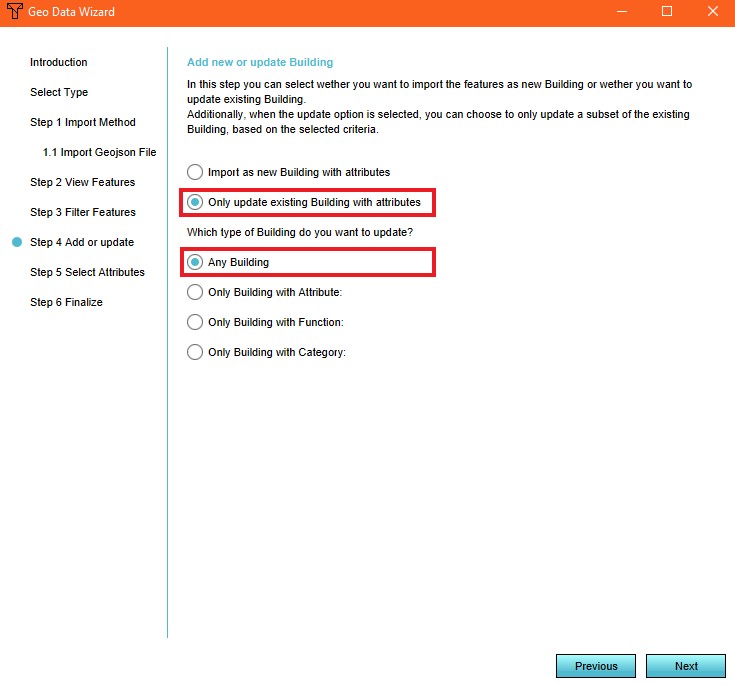
9. Select the 'Only update existing building with attributes' and 'Any Building' options
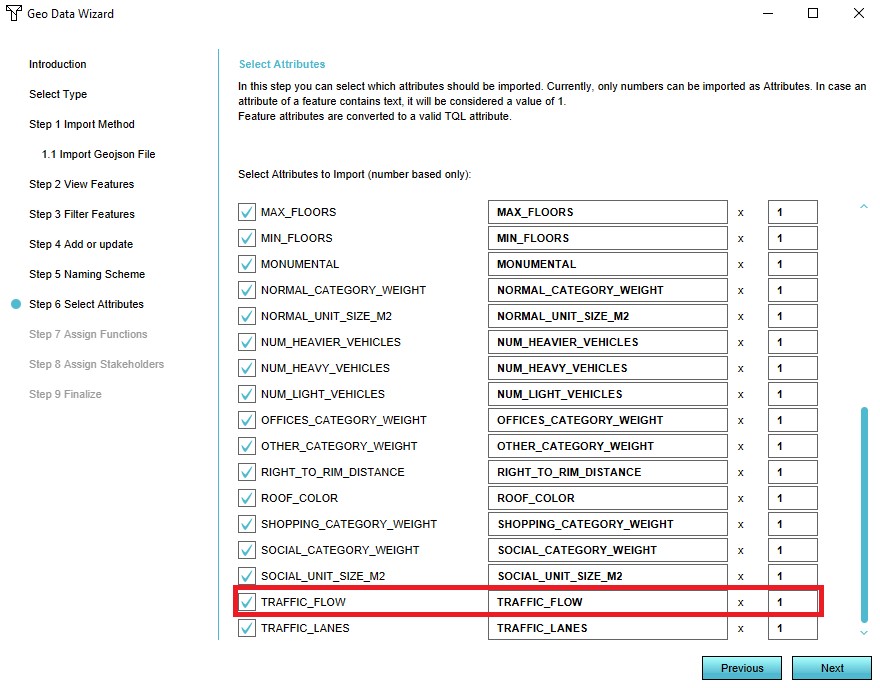
10. Select the TRAFFIC_FLOW attribute
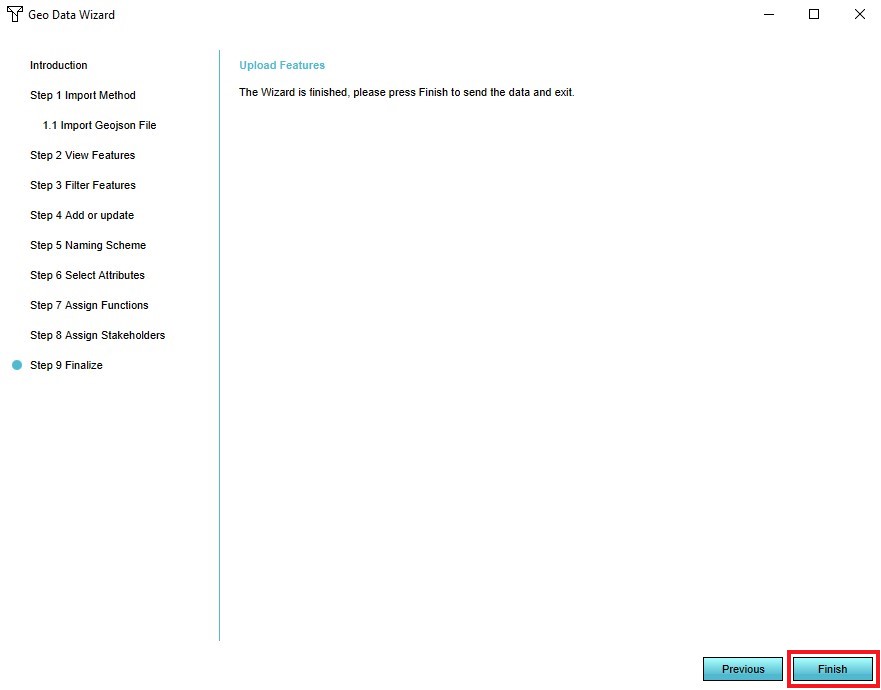
11. Select 'Finish'


Create GeoJSON File
- Open QGis
- Select the Layer tab
- Select 'Add Layer' in the Layer tab
- Select 'Add Vector Layer' in the dropdown menu
- Choose the file you wish to add and select 'Open'
- Notice that the file appeared in the Layers Panel
- Select the newly added file and choose 'Save As'
- Notice that a new window with options has appeared
- In the 'Format' field choose 'GeoJSON'
- In the 'Name' field enter a name for the file
- In the 'CRS' field choose the right CRS for the file
- Select 'Ok' to create and save the GeoJSON file
- Notice that the newly created GeoJSON file is added in the Layers Panel
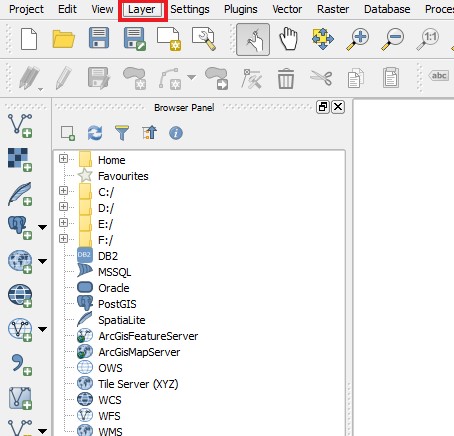
2. Select the Layer tab
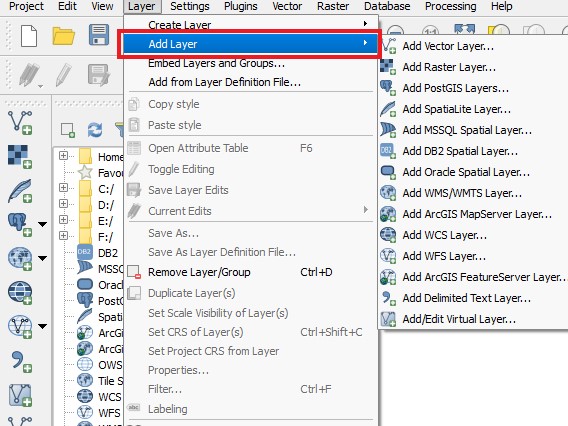
3. Select 'Add Layer' in the Layer tab
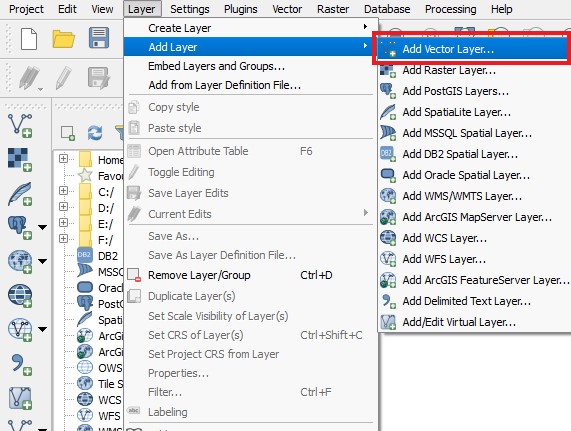
4. Select 'Add Vector Layer' in the dropdown menu
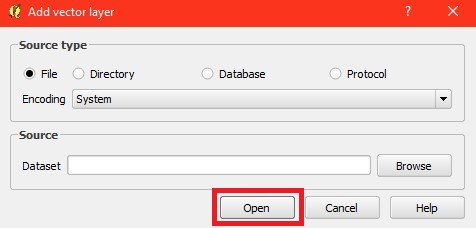
5. Choose the file you wish to add and select 'Open'
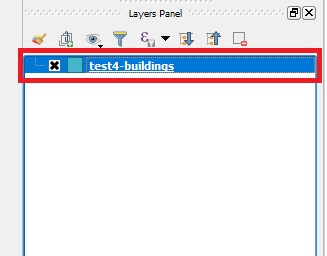
6. Notice that the file has appeared in the Layers Panel
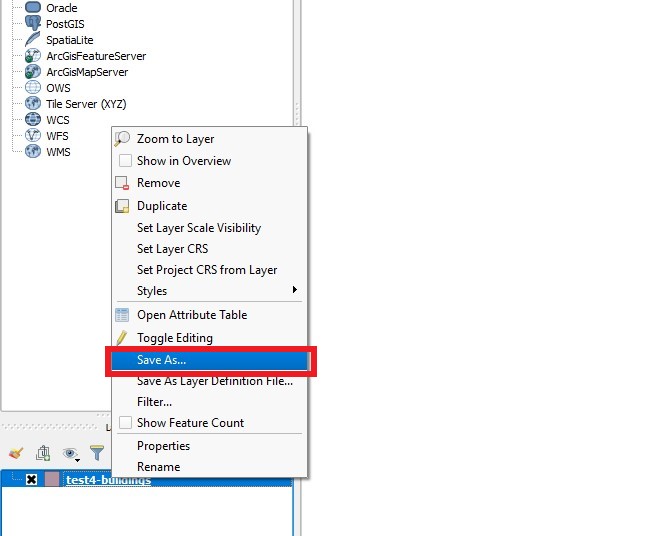
7. Select the newly added file and choose 'Save As'
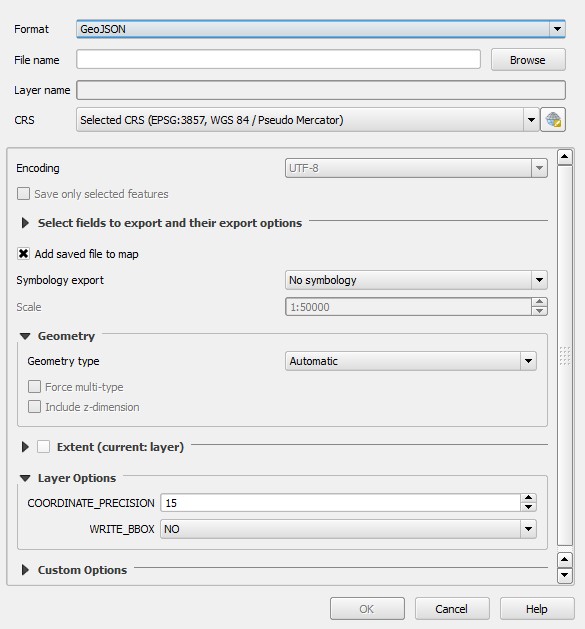
8. Notice that a window with options has appeared
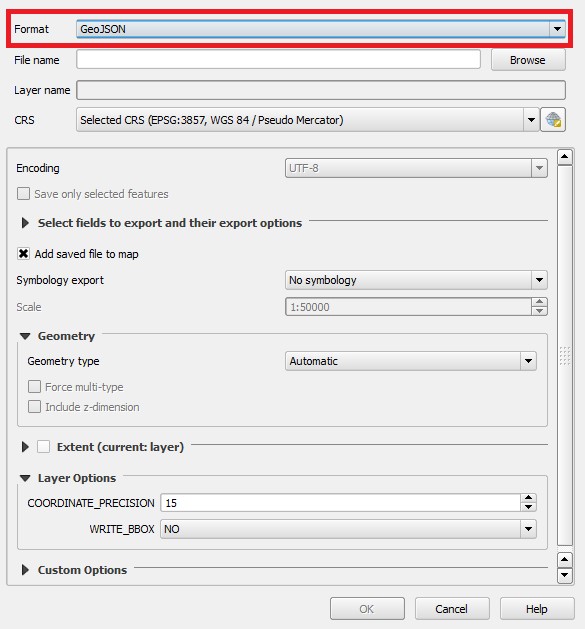
9. In the 'Format' field choose 'GeoJSON'
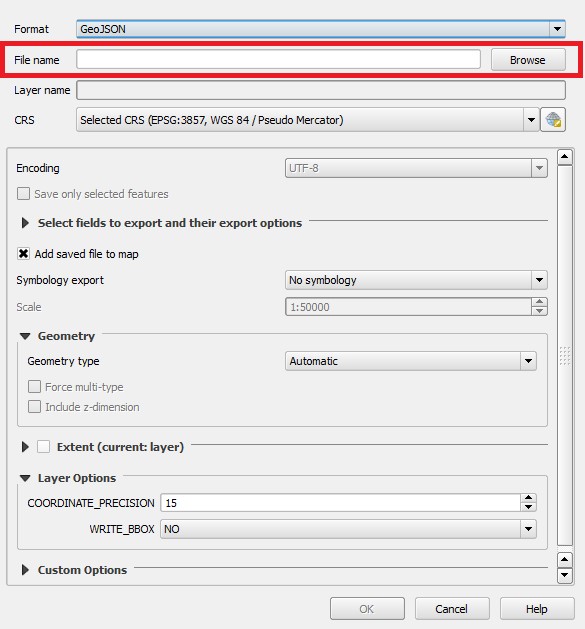
10. In the 'Name' field enter a name for the file
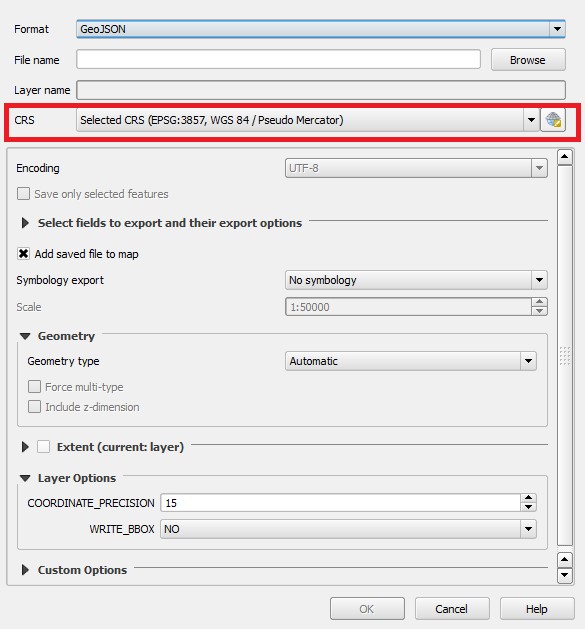
11. In the 'CRS' field choose the right CRS for the file
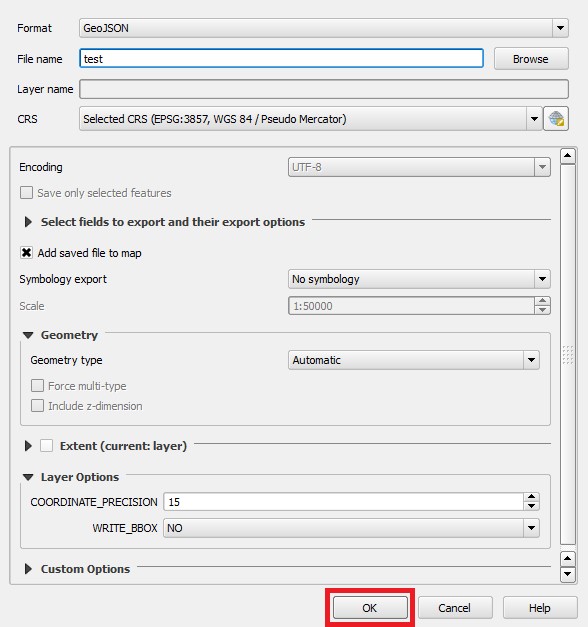
12. Select 'Ok' to create the new GeoJSON file
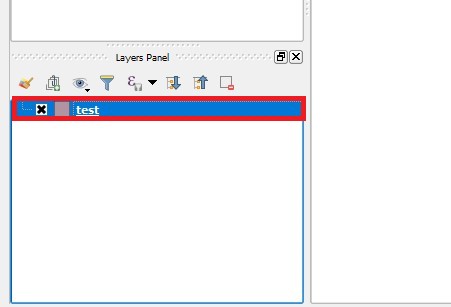
13. Notice that the newly created GeoJSON file is added to the Layers Panel


