|
|
| (21 intermediate revisions by the same user not shown) |
| Line 1: |
Line 1: |
| {{being updated}} | | {{being updated}} |
| {{learned|file=|what a Traffic Model is|how a Traffic Model relates to the {{software}}|about the different Traffic Models in the {{software}}|how to add a Custom Traffic Model to your project|how to change the Traffic Model dynamically in your project}}
| |
|
| |
|
| == What is a Traffic Model == | | == Traffic model in the {{software}}== |
| ''From Wikipedia, the free encyclopedia''
| | The purpose of the default traffic model in the {{software}} is to calculate the effects of traffic on the [[3D World]] through traffic intensity. In order to calculate this impact, data such as the number of lanes, traffic speed and the traffic intensity on a particular road can be added to the project. The traffic model is a static model that does not change by carrying out [[Actions]], [[Upgrades]] or [[Measures]] for example. Read below how to create your own dynamic traffic model and use it in the {{software}}. |
| | | The following (dynamic) overlays show data from/effects of the traffic model: [[Traffic Density (Overlay)]], [[Traffic NO2 (Overlay)]], [[Traffic Noise (Overlay)]]. |
| A traffic model is a mathematical model of real-world traffic, usually, but not restricted to, road traffic. Traffic modeling draws heavily on theoretical foundations like network theory and certain theories from physics like the kinematic wave model. The interesting quantity being modeled and measured is the [[Traffic Flow (Overlay)|traffic flow]], i.e. the throughput of mobile [[units]] (e.g. vehicles) per time and transportation medium capacity (e.g. [[Constructions#Roads|road]] or lane width).
| | <br> |
| | | <br> |
| == How does a Traffic Model relate to the {{software}}? ==
| | When generating a [[Wizard|new project]], traffic related data is added for the selected project area, based on available open data sources. The following datasets are used: |
| The main purpose of the default traffic model in the {{software}} is to calculate the effects of traffic on the [[3D World]] through traffic densities. In order to calculate this impact, data such as the number of traffic lanes, the traffic speed and the traffic flow on a particular lane can be added to the project. The traffic model is a static model that does not change by carrying out [[Actions]], [[Upgrades]] or [[Measures]] for example. Read below how to create your own dynamic traffic model and use it in the {{software}}. | |
| The following overlays show data from/effects of the traffic model: | |
| * [[Traffic Density (Overlay)]]
| |
| * [[Traffic NO2 (Overlay)]]
| |
| * [[Traffic Noise (Overlay)]]
| |
|
| |
|
| ==Traffic Data==
| | *[[Project_Sources#Sources_connected_to_the_Tygron_Platform|NWB (Nationaal Wegen Bestand)]] |
| When creating a [[Main Menu#New Project|new project]] a traffic model is generated for the selected project area, based on available open data sources. The following datasets are used:
| | *[[Project_Sources#Sources_connected_to_the_Tygron_Platform|NSL Monitoringstool]] |
| | *[[Project_Sources#Sources_connected_to_the_Tygron_Platform|INWEVA 2015]] |
|
| |
|
| * [[GEO_Data#Used_Datasets|NSL Monitoringstool]]
| |
| * [[GEO_Data#Used_Datasets|NWB (Nationaal Wegen Bestand)]]
| |
| * [[GEO_Data#Used_Datasets|INWEVA 2015]]
| |
| * [[GEO_Data#Used_Datasets|VI-Lucht & Geluid]]
| |
| <!--
| |
| ====INWEVA 2015====
| |
| :INWEVA is short for INtensiteiten op WEgVAkken (traffic intensities on road sections). Traffic intensities are measured on ca. 3000 road sections. For the other sections intensities are estimated, based on traffic modeling. The data are yearly averages per road section, and updated each year.
| |
| :'' See also: https://nis.rijkswaterstaat.nl/portalcontent/logon/p2_33.html
| |
|
| |
|
| ====VI-Lucht & Geluid====
| |
| :VI-Lucht en Geluid is a Dutch tool that provides the following data for a specific section of a road:
| |
| *An average traffic intensity expressed in motor vehicles per week day, per average daytime hour, per average evening hour, per average nighttime hour
| |
| *The share and size of medium heavy and heavy freight traffic
| |
| *The share and size of bus traffic
| |
| :In januari 2016 the application was updated and actualized for the last time.
| |
| :'' See also: https://www.infomil.nl/onderwerpen/klimaat-lucht/luchtkwaliteit/slag/hulpmiddelen/inschatten/
| |
| -->
| |
|
| |
|
| ===Edit Traffic data=== | | ===Traffic data=== |
| | Traffic related data in the {{software}}, can be found on the Details tab of a [[Construction|Building]] and the Attributes tab. |
| [[File:Traffic_data.jpg|thumb|200px|left|The right panel shows details about the selected road part]] | | [[File:Traffic_data.jpg|thumb|200px|left|The right panel shows details about the selected road part]] |
| ====Height offset==== | | ====Height offset==== |
| Line 41: |
Line 21: |
|
| |
|
| ====Units per hour==== | | ====Units per hour==== |
| ''This field specifies the number of units that can drive on a road in an hour.'' | | ''This field specifies the traffic intensity: the number of units that drive on the road in an hour. For the data source, see [[Traffic_Model#Traffic_intensity|traffic intensity]].'' |
|
| |
|
| ====Lanes==== | | ====Lanes==== |
| Line 56: |
Line 36: |
| <br clear= all> | | <br clear= all> |
|
| |
|
| ==Add a custom Traffic Model== | | <!-- |
| It is also possible to creata and add a custom traffic model, better suited for your use case. The traffic model can be either a static model (the model and data do not change in the project) or a dynamic model (the model and data change when something in the 3D world changes).
| | ====INWEVA 2015==== |
| | :INWEVA is short for INtensiteiten op WEgVAkken (traffic intensities on road sections). Traffic intensities are measured on ca. 3000 road sections. For the other sections intensities are estimated, based on traffic modeling. The data are yearly averages per road section, and updated each year. |
| | :'' See also: https://nis.rijkswaterstaat.nl/portalcontent/logon/p2_33.html |
|
| |
|
| ===Static Traffic Model === | | ====VI-Lucht & Geluid==== |
| ''A static model does not change (over time), when changes occur in the 3D world.
| | :VI-Lucht en Geluid is a Dutch tool that provides the following data for a specific section of a road: |
| This type of model can be used when you for example have a scenario for 2030 ready that contains the traffic intensities then and want to use this data in your project.
| | *An average traffic intensity expressed in motor vehicles per week day, per average daytime hour, per average evening hour, per average nighttime hour |
| To upload the dataset, create a [[Geojson]] file of the data and make sure the features contain an attribute with the number of [[units]]/hour. This attribute will overwrite the current TRAFFIC_FLOW attribute of the roads.
| | *The share and size of medium heavy and heavy freight traffic |
| When importing this data, [[Constructions]] that are intersected by sections of the imported data are given the new traffic flow attribute of imported data.
| | *The share and size of bus traffic |
| <br>
| | :In januari 2016 the application was updated and actualized for the last time. |
| {{Editor location|Geo Import}}
| | :'' See also: https://www.infomil.nl/onderwerpen/klimaat-lucht/luchtkwaliteit/slag/hulpmiddelen/inschatten/ |
| {{Editor steps|title=add a Static Traffic Model using the Geo Data Wizard|Select the Geo Data header|Select the Geo Import bar|Notice that a Geo Data Wizard window appears|In the data wizard select the type 'Buildings'|Select the 'Import a GeoJson file' option in step 1|Select the GeoJson file you wish to add in step 1|View the features of the selected GeoJson file in step 2|Select the 'No Filtering' option in step 3|Select the option 'Only update existing building with attributes' and the option 'Any Building' in step 4|Ensure that the attribute TRAFFIC_FLOW is activated in the list of attributes in step 5|Select 'Finish' in step 6}}
| | --> |
| <br>
| |
|
| |
|
| <gallery> | | ==Traffic intensity== |
| File:Geo_data_0.jpg | 4. Select 'Buildings' type
| | The traffic intensity is depicted in the Platform by the ''Units per hour'' attribute (in the software named TRAFFIC_FLOW). <br> |
| File:Geo_data_1.jpg | 5. Select the 'Import a GeoJson file option'
| | When generating a new project, the traffic intensity is assigned based on data sources. When the ''Units per hour'' attribute text color is black, the intensity is a default value based on the function. When the ''Units per hour'' attribute text color is red, the data is from one of the data sources below. <br> |
| File:Geo_data_3.jpg | 6. Select the GeoJson file you wish to add
| | When the road is a highway, the data is probably from [[Project_Sources#Sources_connected_to_the_Tygron_Platform|INWEVA 2015]]. |
| File:Geo_data_4.jpg | 7. View the features of the selected GeoJson file
| | Otherwise, the intensity is based on the VI-Lucht & Geluid model. (see also: https://www.infomil.nl/onderwerpen/lucht-water/luchtkwaliteit/slag/hulpmiddelen/inschatten/) |
| File:Geo_data_5.jpg | 8. Select the 'No Filtering option'
| | This excel based traffic model estimates traffic intensity based on the following road characteristics: |
| File:Geo_data_static.jpg| 9. Select the 'Only update existing building with attributes' and 'Any Building' options
| | * Traffic speed |
| File:Geo_data_8.jpg | 10. Select the TRAFFIC_FLOW attribute
| | * Is it a one way street or not? |
| File:Geo_data_11.jpg| 11. Select 'Finish'
| | * Is the road inside an urban area or not (NL: binnen of buiten de bebouwde kom)? |
| </gallery>
| | * Is there a separate cycle path along the road? |
| | * Are there more than 2x2 lanes? |
| | * Is parking along the road possible? |
|
| |
|
| ===Dynamic traffic model===
| | These characteristics combined with the [[Attribute#URBANIZATION|urbanization]] factor, determines the type of road. In the Excel model, the different road types have different average traffic intensities. The average daytime traffic intensity is converted to an hourly value to be used for the TRAFFIC_FLOW attribute. |
| ''A dynamic model changes (over time), according to changes in the 3D world.
| |
| An example of a dynamic traffic model is a model in where is calculated how the traffic intensity changes when building a certain amount of houses. Effectively the TRAFFIC_FLOW attribute of the roads will be updated with a new value, when building houses in the {{software}}.
| |
| To create such a model, first create a [[Geojson]] file with the roads that will be changed by a certain [[Action]] or [[Measures|Measure]] and import the file.
| |
| In an [[Excel|Excel]] file, the calculation for how much and when the traffic intensity changes has to be made. This file can be uploaded as either an [[indicator]] or [[panel]]. The indicator or panel explanation text in this case is not relevant. The Excel is only used to define the model and import it in the {{software}}. | |
| <br>
| |
| [[File:Excel_traffic_panel.jpg|thumb|500px|left|Example excel Traffic Flow panel template]]
| |
| <br> <br> <br>
| |
| The Excel implementation of a simple dynamic traffic model, consists of the following consecutive steps:
| |
| <br>
| |
| <br>
| |
| * Retrieval of the original traffic density in Area X - <code>SELECT_ATTRIBUTE_WHERE_NAME_IS_TRAFFIC_FLOW_AND_AREA_IS_X</code>
| |
| <br>
| |
| * Calculation in an excel file, with the new traffic density as outcome - <code>original traffic density + change</code>
| |
| <br>
| |
| * Output of the new traffic density for constructions in Area X - <code>UPDATE_BUILDING_TRAFFIC_FLOW_WHERE_AREA_IS_X</code>
| |
| <br clear=all>
| |
|
| |
|
| {{Editor location|Geo Import}}
| | ==Add a custom Traffic Model== |
| {{Editor steps|title=add a Dynamic Custom Traffic Model using the Geo Data Wizard|Select the Geo Data header|Select the Geo Import bar|Notice that a Geo Data Wizard window appears|Select the type 'Areas' in the Geo Data Wizard|Select the 'Import a GeoJson file' option in step 1| Select the GeoJson file you wish to add in step 1|View the features of the selected GeoJson file in step 2|Select the 'No Filtering' option in step 3|Select 'Import a New Area with attributes' in step 4|Select an option on how you want to name the features in step 5|Ensure that the attribute TRAFFIC_FLOW is activated in the list of attributes in step 6||Select 'Finish' in step 7}}
| | It is also possible to creata and add a custom traffic model, better suited for your use case. The traffic model can be either a static model (the model and data do not change in the project) or a dynamic model (the model and data change when something in the 3D world changes). |
| <br>
| |
|
| |
|
| <gallery>
| | * [[How_to_add_a_static_Traffic_model| How to add a static Traffic model]] |
| File:Geo_data_areas.jpg |4. Select the type 'Areas'
| | * [[How_to_add_a_dynamic_Traffic_model| How to add a dynamic Traffic model]] |
| File:Geo_data_1.jpg |5. Select the 'Import a GeoJson file' option
| |
| File:Geo_data_3.jpg |6. Select the GeoJson file you wish to add
| |
| File:Geo_data_4.jpg |7. View the features of the selected GeoJson file
| |
| File:Geo_data_5.jpg |8. Select the 'No filtering' option
| |
| File:Geo_data_areas_1.jpg |9. Select 'Import a New Area with attributes'
| |
| File:Geo_data_7.jpg |10. Choose how you want to name the features
| |
| File:Geo_data_8.jpg |11. Select the TRAFFIC_FLOW attribute
| |
| File:Geo_data_11.jpg |12. Select 'Finish'
| |
| </gallery>
| |
| <br>
| |
|
| |
|
| {{Editor steps|title=add an Excel Indicator or Panel|Select the Indicators header|Select the Indicators bar or Panels bar depending on what is needed|Select the type 'Add Excel Indicator' option or 'Add Excel Panel' in the dropdown menu|Select 'Select Excelsheet' in the [[right panel]]|Select 'Import New Excelsheet' in the popup window|Choose an excelsheet and select 'Apply'|Rename the added indicator in the 'Name' and 'Short Name' fields on the [[right panel]]|Select the color to be used in the progression panel|Select to activate the indicator, if desired|Add a proper description|Highlight 'Excel File Name' on the [[left panel]]|Select the 'Upload' button|Select the file to upload in the 'Choose your file' panel|Select Indicators > recalculate Indicators}}
| | ==See also== |
| <br>
| | *[[Project_Sources|Project sources]] |
| | | * [[Traffic Density (Overlay)]] |
| ===Create GeoJSON File===
| | * [[Traffic NO2 (Overlay)]] |
| <br>
| | * [[Traffic Noise (Overlay)]] |
| {{Editor steps|title=create a GeoJson file in QGis|Open QGis|Select the Layer tab|Select 'Add Layer' in the Layer tab|Select 'Add Vector Layer' in the dropdown menu|Choose the file you wish to add and select 'Open'| Notice that the file appeared in the Layers Panel|Select the newly added file and choose 'Save As'|Notice that a new window with options has appeared| In the 'Format' field choose 'GeoJSON'| In the 'Name' field enter a name for the file| In the 'CRS' field choose the right CRS for the file| Select 'Ok' to create and save the GeoJSON file| Notice that the newly created GeoJSON file is added in the Layers Panel}}
| |
| <br>
| |
| | |
| <gallery>
| |
| File:Select_layer.jpg |2. Select the Layer tab
| |
| File:Add_layer.jpg |3. Select 'Add Layer' in the Layer tab
| |
| File:Select_vector_layer.jpg |4. Select 'Add Vector Layer' in the dropdown menu
| |
| File:Add_vector_layer1.jpg |5. Choose the file you wish to add and select 'Open'
| |
| File:Layer_panel.jpg |6. Notice that the file has appeared in the Layers Panel
| |
| File:Select_save_as.jpg |7. Select the newly added file and choose 'Save As'
| |
| File:New_window.jpg |8. Notice that a window with options has appeared
| |
| File:Format.jpg |9. In the 'Format' field choose 'GeoJSON'
| |
| File:Choose_name.jpg |10. In the 'Name' field enter a name for the file
| |
| File:Choose_crs.jpg |11. In the 'CRS' field choose the right CRS for the file
| |
| File:Select_ok.jpg |12. Select 'Ok' to create the new GeoJSON file
| |
| File:New_file_added.jpg |13. Notice that the newly created GeoJSON file is added to the Layers Panel
| |
| </gallery>
| |
| <br>
| |
| | |
| <!--<gallery mode="nolines">
| |
| File:editor.jpg|Drag and drop a prepared Geojson file on the Editor
| |
| File:ImportAreas-FileHandler.jpg|Select "Import Areas" from the "File Handler" panel
| |
| File:ImportAreaFile.jpg|Ensure the attribute TRAFFIC_FLOW is activated
| |
| File:ImportAreaFileSend.jpg|Select the "Send" button
| |
| </gallery>
| |
| -->
| |
Please note: This page is currently being updated.
Traffic model in the Tygron Platform
The purpose of the default traffic model in the Tygron Platform is to calculate the effects of traffic on the 3D World through traffic intensity. In order to calculate this impact, data such as the number of lanes, traffic speed and the traffic intensity on a particular road can be added to the project. The traffic model is a static model that does not change by carrying out Actions, Upgrades or Measures for example. Read below how to create your own dynamic traffic model and use it in the Tygron Platform.
The following (dynamic) overlays show data from/effects of the traffic model: Traffic Density (Overlay), Traffic NO2 (Overlay), Traffic Noise (Overlay).
When generating a new project, traffic related data is added for the selected project area, based on available open data sources. The following datasets are used:
Traffic data
Traffic related data in the Tygron Platform, can be found on the Details tab of a Building and the Attributes tab.
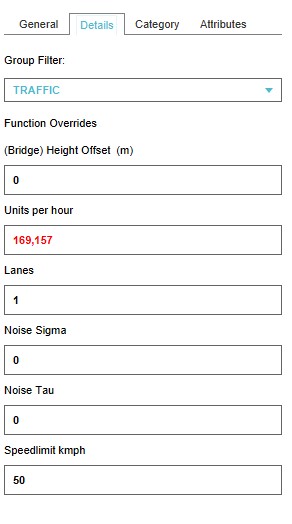
The right panel shows details about the selected road part
Height offset
This field specifies the height offset of a bridge.
Units per hour
This field specifies the traffic intensity: the number of units that drive on the road in an hour. For the data source, see traffic intensity.
Lanes
This field specifies the number of lanes that a road can have.
Noise Sigma
This field specifies the correction factor at reference traffic speed [1].
This value is used in the calculation of the Traffic Noise (Overlay).
Noise Tau
This field specifies the correction factor per 10 km/hour deviation from reference traffic speed [2].
This value is used in the calculation of the Traffic Noise (Overlay).
Speedlimit
This field specifies the max allowed speedlimit on road or part of a road.
Traffic intensity
The traffic intensity is depicted in the Platform by the Units per hour attribute (in the software named TRAFFIC_FLOW).
When generating a new project, the traffic intensity is assigned based on data sources. When the Units per hour attribute text color is black, the intensity is a default value based on the function. When the Units per hour attribute text color is red, the data is from one of the data sources below.
When the road is a highway, the data is probably from INWEVA 2015.
Otherwise, the intensity is based on the VI-Lucht & Geluid model. (see also: https://www.infomil.nl/onderwerpen/lucht-water/luchtkwaliteit/slag/hulpmiddelen/inschatten/)
This excel based traffic model estimates traffic intensity based on the following road characteristics:
- Traffic speed
- Is it a one way street or not?
- Is the road inside an urban area or not (NL: binnen of buiten de bebouwde kom)?
- Is there a separate cycle path along the road?
- Are there more than 2x2 lanes?
- Is parking along the road possible?
These characteristics combined with the urbanization factor, determines the type of road. In the Excel model, the different road types have different average traffic intensities. The average daytime traffic intensity is converted to an hourly value to be used for the TRAFFIC_FLOW attribute.
Add a custom Traffic Model
It is also possible to creata and add a custom traffic model, better suited for your use case. The traffic model can be either a static model (the model and data do not change in the project) or a dynamic model (the model and data change when something in the 3D world changes).
See also
