Tutorial Heat Stress Project: Difference between revisions
No edit summary |
|||
| Line 48: | Line 48: | ||
File:Heat-step4.PNG|Output overlays | File:Heat-step4.PNG|Output overlays | ||
</gallery> | </gallery> | ||
== Setup == | |||
Generally, the steps required to use and configure the Heat Stress Overlay are as followed: | |||
# Determine the location and area of interest and generate a project for that area; | |||
# Add the Heat stress overlay; | |||
# Open the Heat stress overlay wizard to kick off the configuration process. | |||
## Select date(s) and time of day | |||
## Supply daily weather station data | |||
## Supply hourly weather station data | |||
## Select source for Foliage height | |||
====Date and time of day==== | |||
# Select a day for which you want to generate results. You can also choose to select multiple consecutive days when using the Heat Overlay Wizard. | |||
# Configure per day which hours you want to generate results for. Each day-hour combination will become a result. This result is stored as a time-frame to relate it back to the day and time. | |||
====Generated sun parameters==== | |||
For each day, and for each time of day, the following will be automatically generated when using the wizard: | |||
# The day and time pairs, along with the project location, will be used to automatically calculate the sun altitude and azimuth angles for each day-time pair. | |||
# The [[Sun_daily_motion_(Heat_Overlay)|sun daily motion factor]] is a parameter used in the atmospheric temperature formula. It will be automatically selected from the sun motion factor table, based on the date (column) and time of day (row). | |||
====Weather station data==== | |||
Next, manually determine which weather station you want to use as a reference. Download the historical hourly weather data for that station and use the data from certain columns as input. | |||
In a nutshell, using the weather data, you have to supply: | |||
*'''Daily Values''' | |||
# The [[Daily_temperature_min_(Heat_Overlay)|minimum]] and [[Daily_temperature_max_(Heat_Overlay)|maximum temperature]] of the day; | |||
# The [[Daily_avg_wind_speed_(Heat_Overlay)|average wind speed]], measured at the height of 10 meters; | |||
# The [[Daily_avg_radiation_(Heat_Overlay)|average global sun radiation]] during sun hours; | |||
*'''Hourly Values''' | |||
# The [[Hourly_temperature_(Heat_Overlay)|hourly temperature]]; | |||
# The [[Hourly_humidity_(Heat_Overlay)|hourly humidity]]; | |||
# The [[Hourly_radiation_(Heat_Overlay)|hourly sun radiation]], as an average of the current and previous hour; | |||
# The [[Wind_speed_(Heat_Overlay)|hourly wind speed]]; | |||
# The [[Wind_direction_(Heat_Overlay)|hourly wind direction]]; | |||
====Foliage Height==== | |||
Select what source will define the Foliage height: | |||
* Buildings with [[Function|functions]] related to foliage. The [[Foliage_height_calculation_model_(Heat_Overlay)|foliage height calculation model]] will determine the foliage height using the height of the vegetation (as buildings) and the foliage crown factor attribute; | |||
* Areas with as foliage height attribute, defining the foliage height for a whole area; | |||
* [[GeoTiff]], defining a foliage height value for each cell in its raster. | |||
===Further reading=== | ===Further reading=== | ||
To read more documentation about the Heat Stress Overlay go to [[Heat_DPRA_Module]] | To read more documentation about the Heat Stress Overlay go to [[Heat_DPRA_Module]] | ||
Revision as of 10:11, 16 December 2019
The Heat Overlay allows user to visualize a generated Physiological Equivalent Temperature (PET) overlay, along with other intermediate overlay results. The Heat Overlay can be configured using the Wizard.
This tutorial shows how to setup a new Heat Overlay by using the Wizard step by step.
Add Heat Overlay
1. Go to the Current Situation Tab and click on Overlays.
2. Choose "Add Heat Stress" to add the Overlay.
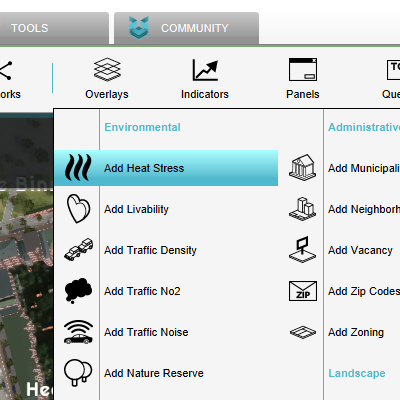
Add Overlay
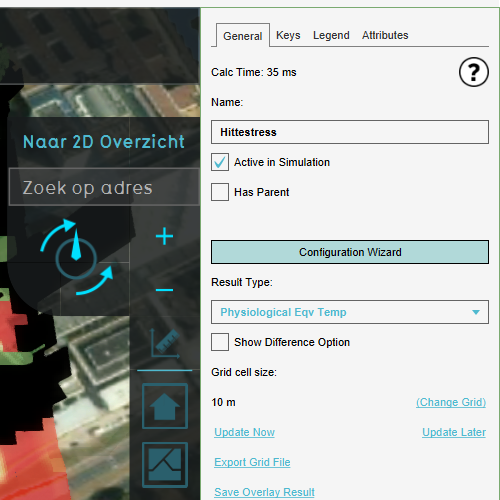
Open Wizard


Configure Wizard
1. Open the Wizard by clicking on the "Configuration Wizard" button on the right panel.
2. Click on "Next" in the Introduction of the Wizard.
3. Now you can see the steps which you will be setting up. In Step 1 you can choose either the new (more accurate) DPRA Model or the old UNESCO-IHE Model.
For this tutorial choose the DPRA Model.
4. In Step 2 you can select the start and end date for the PET calculation, also the specific hours. Additional paramaters can also be adjusted for the specific hours and days given. To learn more about this step go to the Tutorial on how to use Dutch weather data values for the Heat Stress Overlay.
To find out more about the attributes and the impact they have on the overall system go to Heat Stress Overview
5. In step 3 you can define how to treat the foliage in your project. You can setup how you want the foliage height and crown factor to behave and wether or not you want to visualize foliage in the Heat Overlay. To see how this is setup in detail go to:
- How to adjust the foliage height and crown factor
- How to import foliage height areas
- How to import a foliage height GeoTIFF
6. In the final step you can choose which result types you want to display in the Overlay. Most users will be interested in the PET (Physiological Equivalent Temperature) but it varies from project to project.
Choose which of these results will initially be shown in the menu by clicking on the "First" checkbox. The rest will be shown as a subcategory.
Click on Finish to close the Wizard. You have succesfully setup your Heat Stress Overlay.
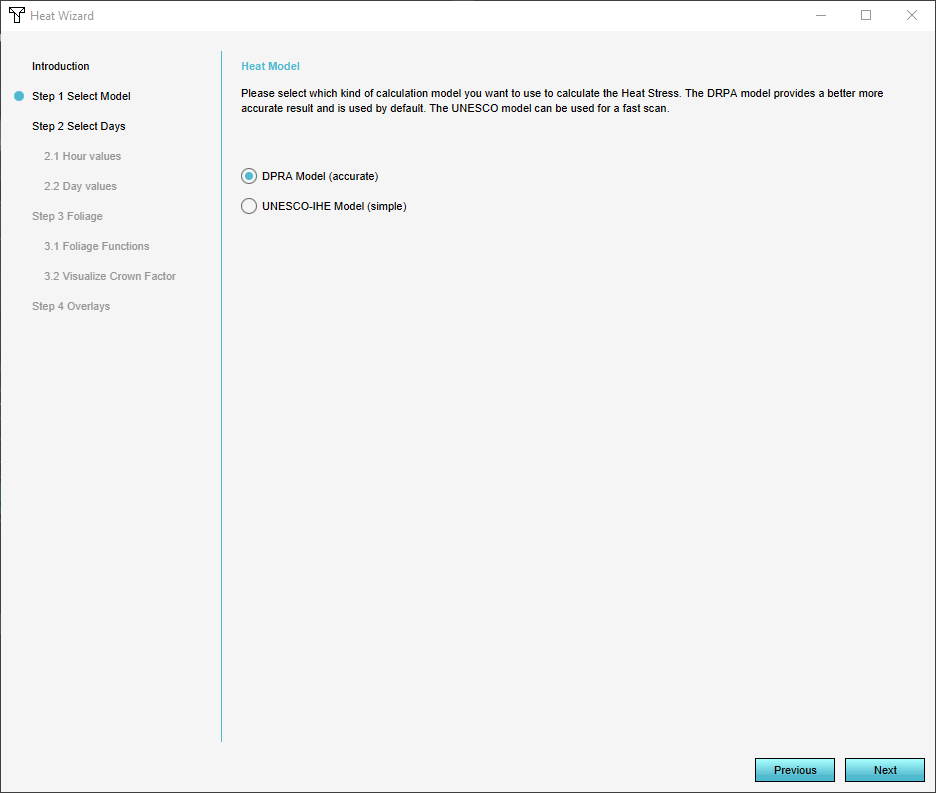
Choose model
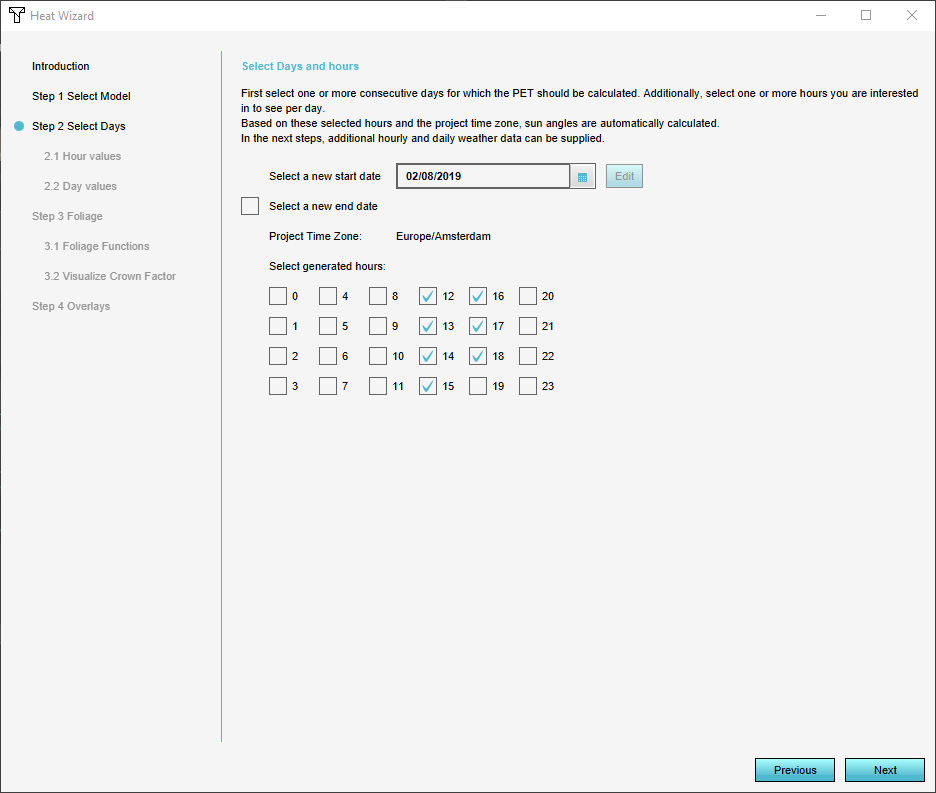
Select days and hours
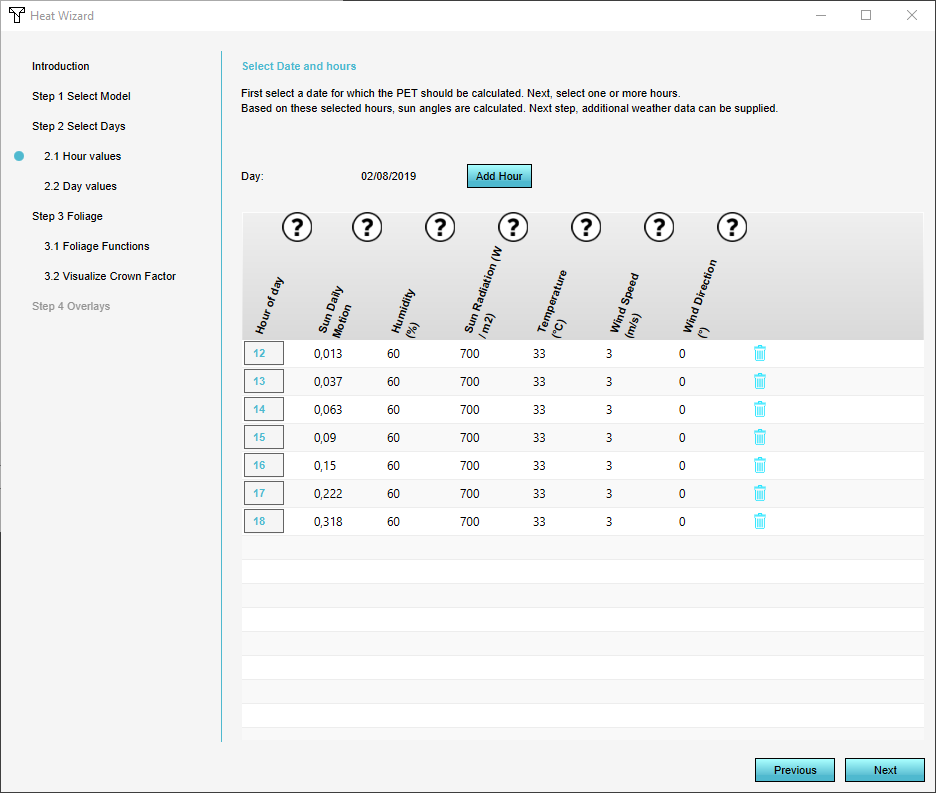
Configure hours
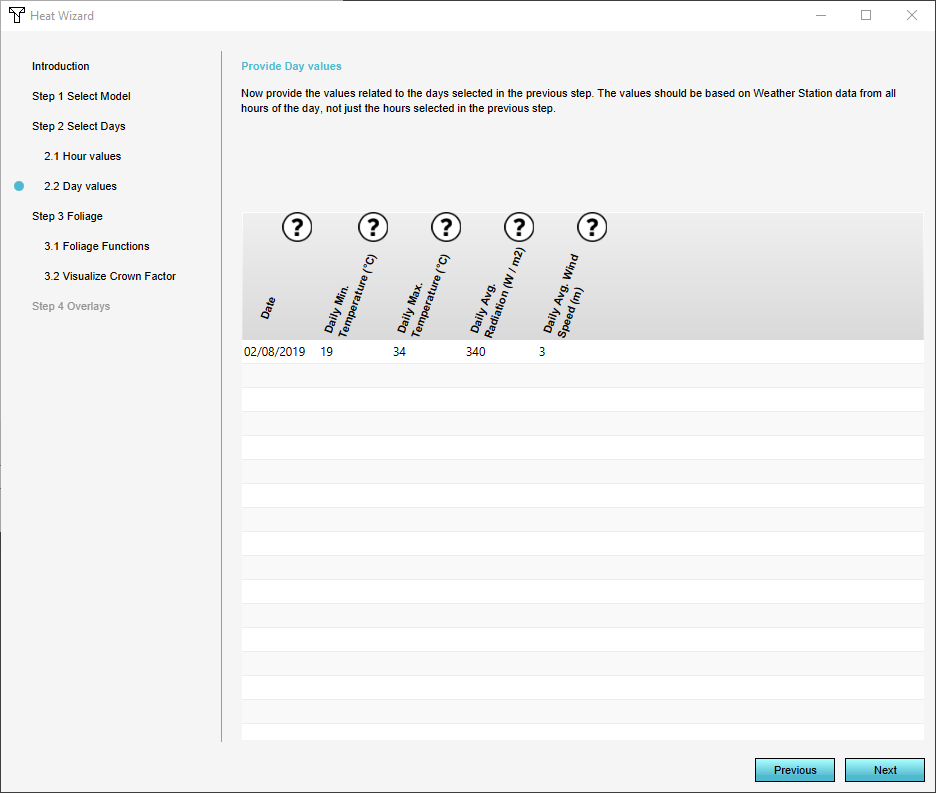
Day values
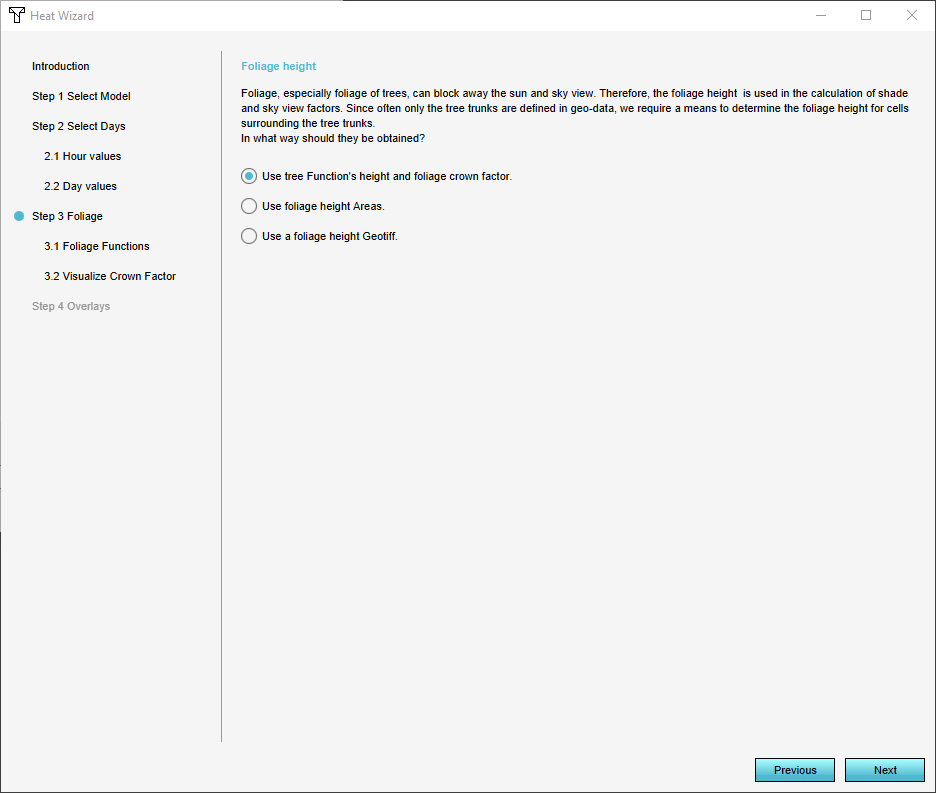
Foliage height
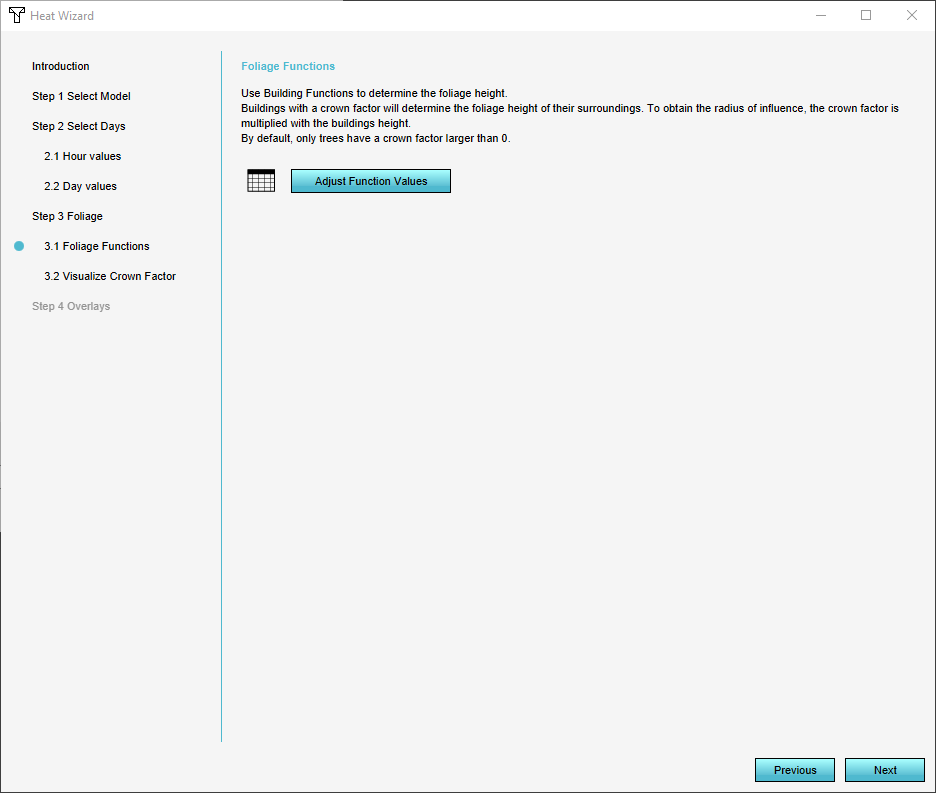
Foliage functions
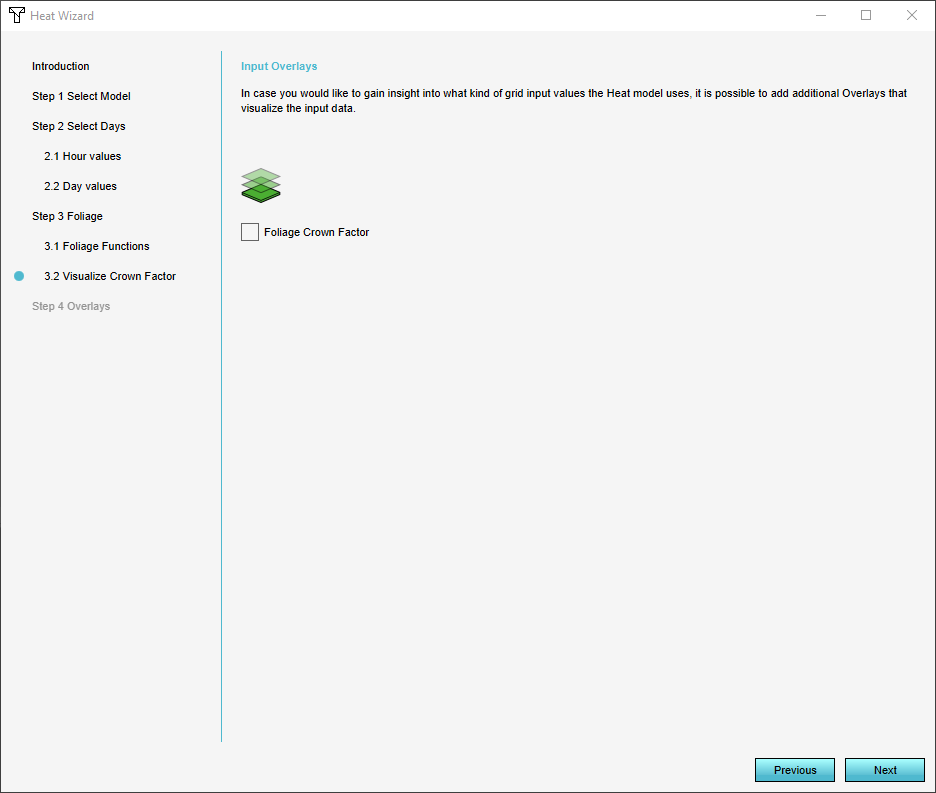
Input Overlays
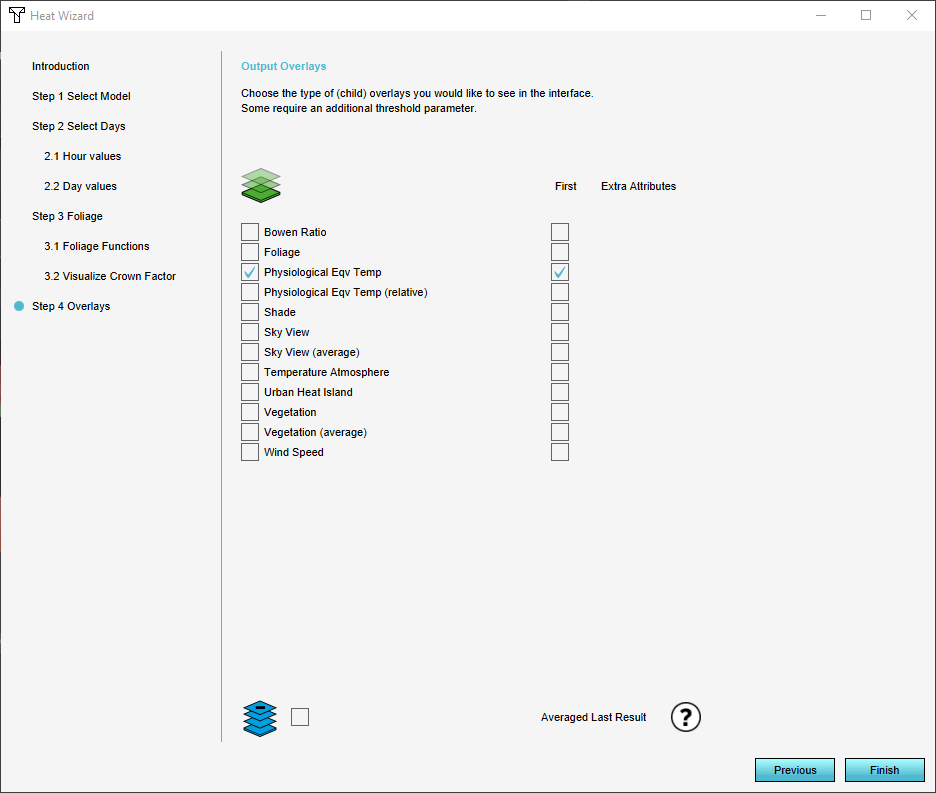
Output overlays


Setup
Generally, the steps required to use and configure the Heat Stress Overlay are as followed:
- Determine the location and area of interest and generate a project for that area;
- Add the Heat stress overlay;
- Open the Heat stress overlay wizard to kick off the configuration process.
- Select date(s) and time of day
- Supply daily weather station data
- Supply hourly weather station data
- Select source for Foliage height
Date and time of day
- Select a day for which you want to generate results. You can also choose to select multiple consecutive days when using the Heat Overlay Wizard.
- Configure per day which hours you want to generate results for. Each day-hour combination will become a result. This result is stored as a time-frame to relate it back to the day and time.
Generated sun parameters
For each day, and for each time of day, the following will be automatically generated when using the wizard:
- The day and time pairs, along with the project location, will be used to automatically calculate the sun altitude and azimuth angles for each day-time pair.
- The sun daily motion factor is a parameter used in the atmospheric temperature formula. It will be automatically selected from the sun motion factor table, based on the date (column) and time of day (row).
Weather station data
Next, manually determine which weather station you want to use as a reference. Download the historical hourly weather data for that station and use the data from certain columns as input. In a nutshell, using the weather data, you have to supply:
- Daily Values
- The minimum and maximum temperature of the day;
- The average wind speed, measured at the height of 10 meters;
- The average global sun radiation during sun hours;
- Hourly Values
- The hourly temperature;
- The hourly humidity;
- The hourly sun radiation, as an average of the current and previous hour;
- The hourly wind speed;
- The hourly wind direction;
Foliage Height
Select what source will define the Foliage height:
- Buildings with functions related to foliage. The foliage height calculation model will determine the foliage height using the height of the vegetation (as buildings) and the foliage crown factor attribute;
- Areas with as foliage height attribute, defining the foliage height for a whole area;
- GeoTiff, defining a foliage height value for each cell in its raster.
Further reading
To read more documentation about the Heat Stress Overlay go to Heat_DPRA_Module