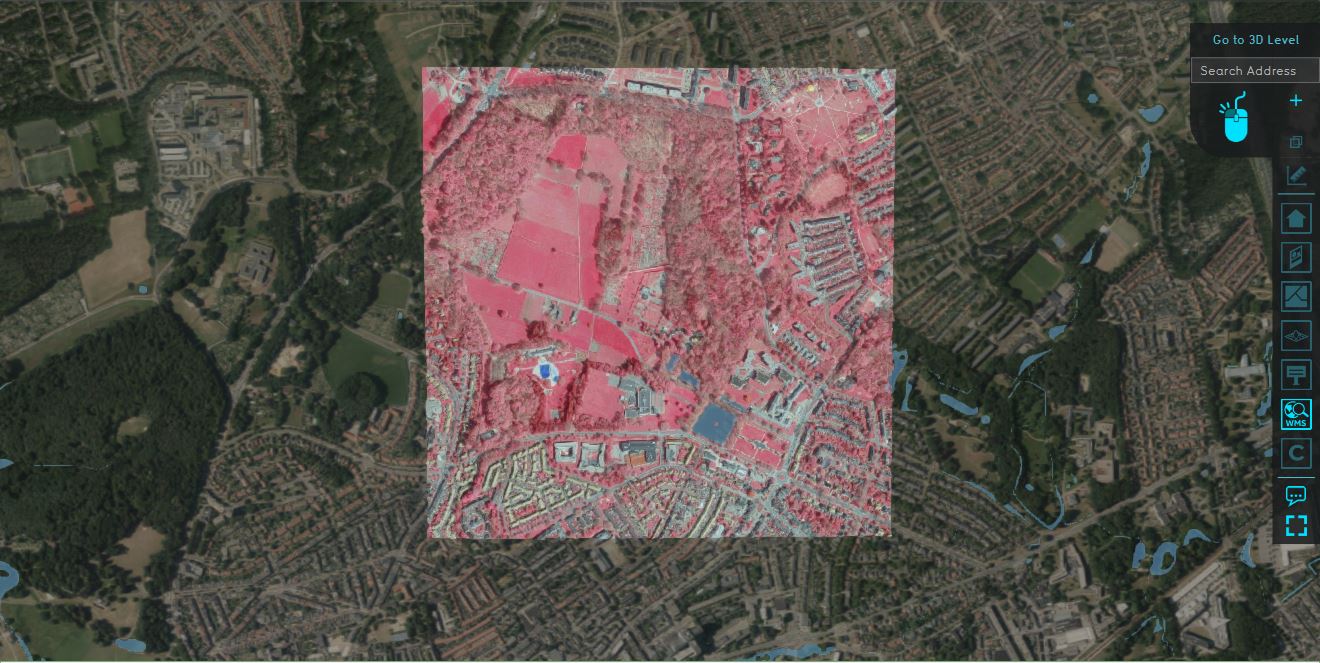
WMS Overlay
The WMS Overlay is a Grid overlay which can display an image result of a Web Map Service query of the project area. Because a Web Map service provides image data, this image data can be displayed as an Overlay in the 3D Visualization.
The main intent of the WMS Overlay is to offer the ability to expose the color channels of the image data as rasterized data. Each color channel is available as a separate result type. This means the WMS Overlay allows the images to serve as input for other Overlays such as the Combo Overlay.
Additional information displayed in hover panel
When clicking on a specific location in the map of the WMS Overlay, the hover panel gives additional information on the color (channel) value in that specific grid cell, depending on the result type.
Result Types
The WMS Overlay allows the ARGB color channels of the image data to be accessed as separate grids of data.
| Name | Data | Value range |
|---|---|---|
| Red | Value of the red color channel | 0-255 (0 is no red, 255 is maximum red) |
| Green | Value of the green color channel | 0-255 (0 is no green, 255 is maximum green) |
| Blue | Value of the blue color channel | 0-255 (0 is no blue, 255 is maximum blue) |
| Alpha | Value of the opacity channel | 0-255 (0 is transparent, 255 is fully opaque) |
| Color | Float representation of the ARGB Integer color value | n/a |
Notes
- When set to use the Color result type, the Overlay's colors are not derived from the Grid Overlay legend. Instead, the float values are converted to ARGB Integer color values.
- Although the Color result type outputs numerical values, these values are not intended to be re-interpreted in further calculations.
- The WMS must conform to the following requirement before it can be loaded properly into the Tygron Platform: the WMS must have PNG as output format.
- When recalculating, the WMS is queried for the latest version of the data. This occurs with each recalculation.
How-to's
- How to add and remove an Overlay
- How to edit an overlay legend
- How to add a WMS as an WMS Overlay
- How to select a Web Map Service for a WMS Overlay
- How to use a WMS to estimate foliage (Heat Overlay)
