Falen keringen template: Difference between revisions
| Line 65: | Line 65: | ||
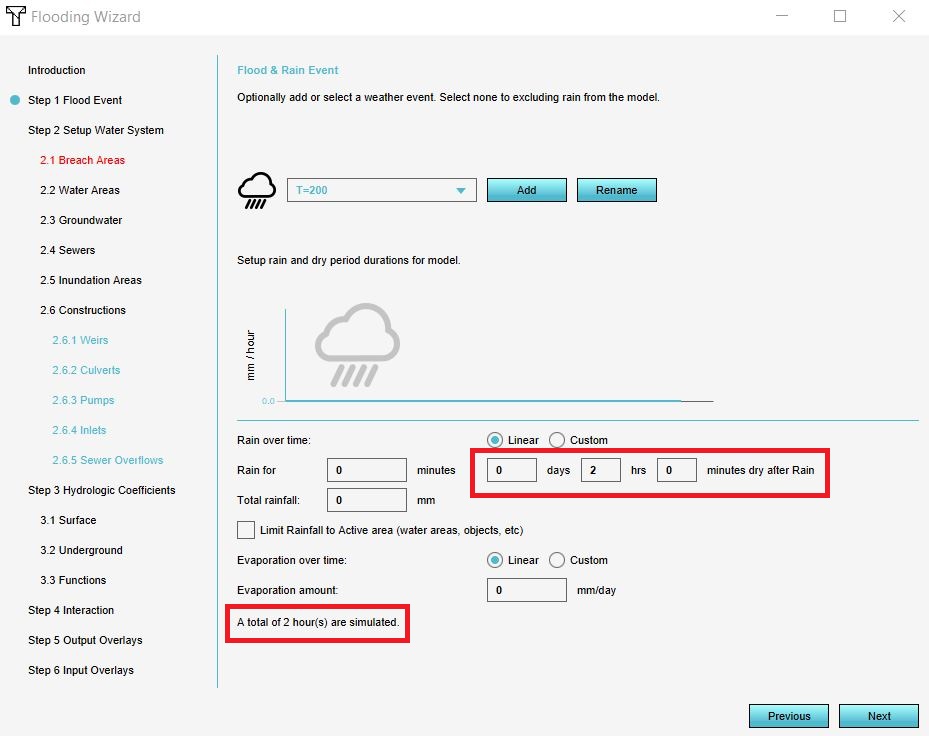
|In step 1, specify the time for the simulation calculation period. | |In step 1, specify the time for the simulation calculation period. | ||
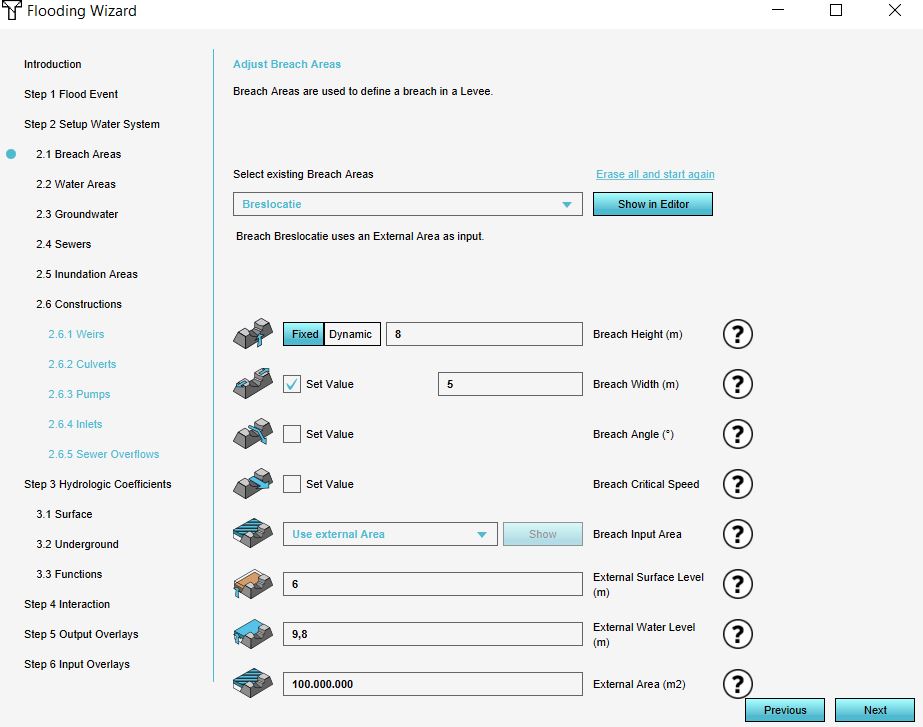
|In step 2.1 select your breach area from the dropdown menu and fill in: | |In step 2.1 select your breach area from the dropdown menu and fill in: | ||
| | |Fixed height and width. Leave [[Breach_angle_(Water_Overlay)|breach angle]] empty. Use for the [[Breach_speed_(Water_Overlay)|breach critical speed]] .... | ||
| | |Select use external area. | ||
| | |Use an [[External_surface_level_(Water_Overlay)|external surface level]] which is lower than the [[Breach_height_(Water_Overlay)|breach height]] | ||
| | |Use for the [[External_water_level_(Water_Overlay)|external water level]] the measured water levels from the Peilen hoofdsysteem overlay. | ||
| | |Calculate for the [[External_area_(Water_Overlay)|external area]] 10 x the flow rate that flows through the breach ''te checken via show water balance''. Magnitude: 10.000.000 m2. If the expected water level fall of the main system is known, take this into account for the external area size. | ||
}} | }} | ||
<gallery mode=nolines> | <gallery mode=nolines> | ||
File:Simulation_period.JPG | |||
File:Breach_external_area_settings.JPG | |||
</gallery> | </gallery> | ||
====Culverts==== | ====Culverts==== | ||
Revision as of 15:01, 10 January 2020
Het falen van keringen is een van de toepassingen van het Tygron Platform. Hiervoor is een template project genaamd Falen keringen template gemaakt. Om dit template effectief in te kunnen zetten is deze handleiding gemaakt. Daarin wordt de te volgen werkwijze beschreven en worden aandachtspunten beschreven.
Required data
- AHN100x100.geojson
- Peilgebieden.geojson
- Duikers_WVS_041219.geojson
- Peilen hoofdsysteem Noord 121219.geojson
Experience with using the Tygron Platform, using the Water overlay wizard and Geo data wizard is required.
Steps
Below the steps for using the template project on a new project area and to calculate and export the results for further analysis.
Apply template on new project area
In this step we will apply the template Falen keringen project on a new project area.
- Log in to the Tygron Platform; the LTS
- Read the headlines to know if there are any failures, for example at the data provider level which could have effect on creating new projects without certain datasets.
- Click on New Project
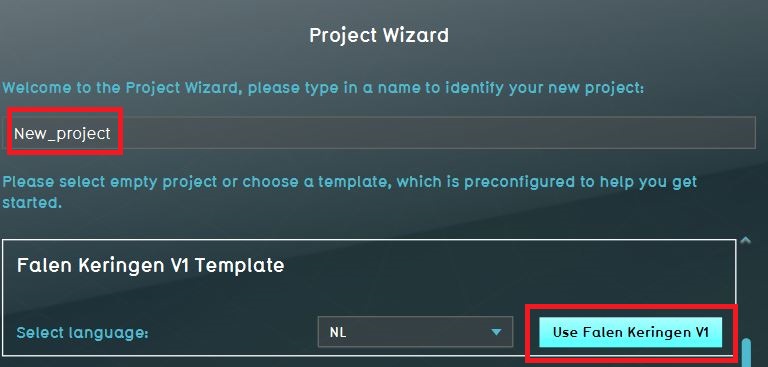
- Give the new project a name and click on Use Falen keringen template
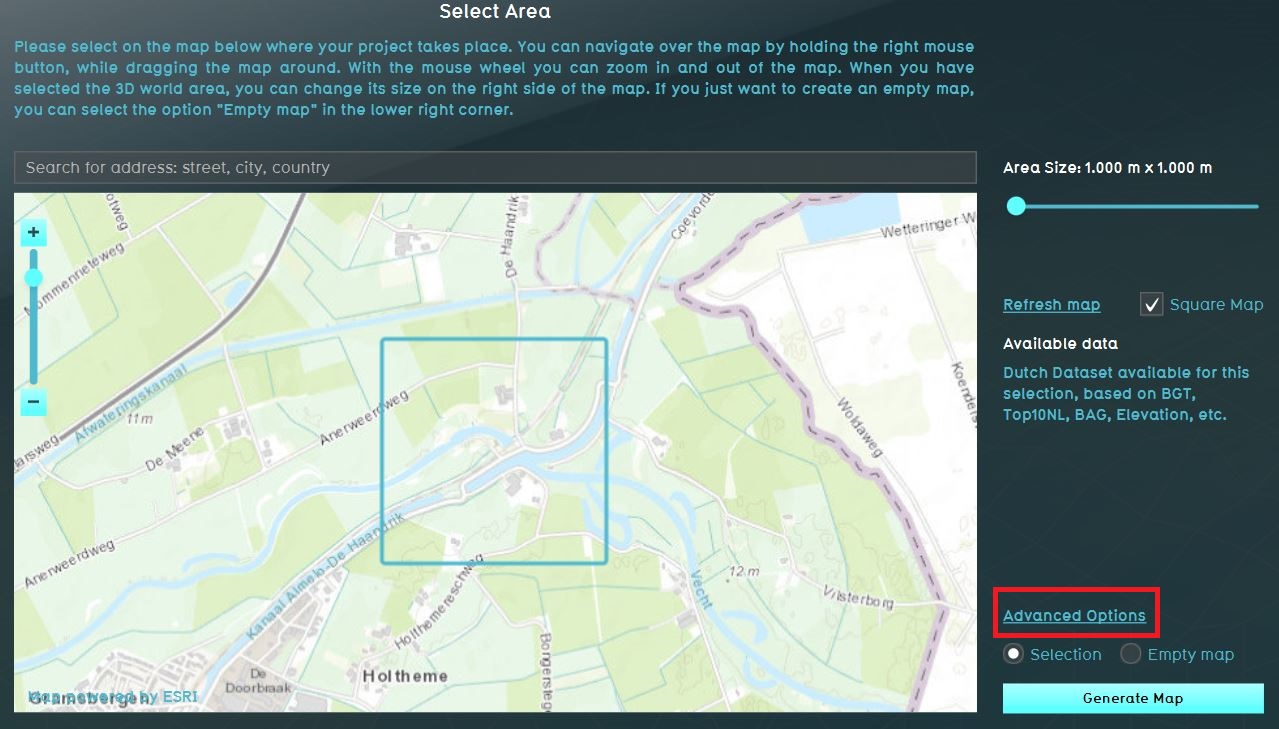
- Zoom in the next step to the area where you want to create a 3D model from. If required, adjust the size of the square/ rectangle with the sliders to adjust the size of the to be created project. The part of the map in the square/rectangle will become the 3D model.
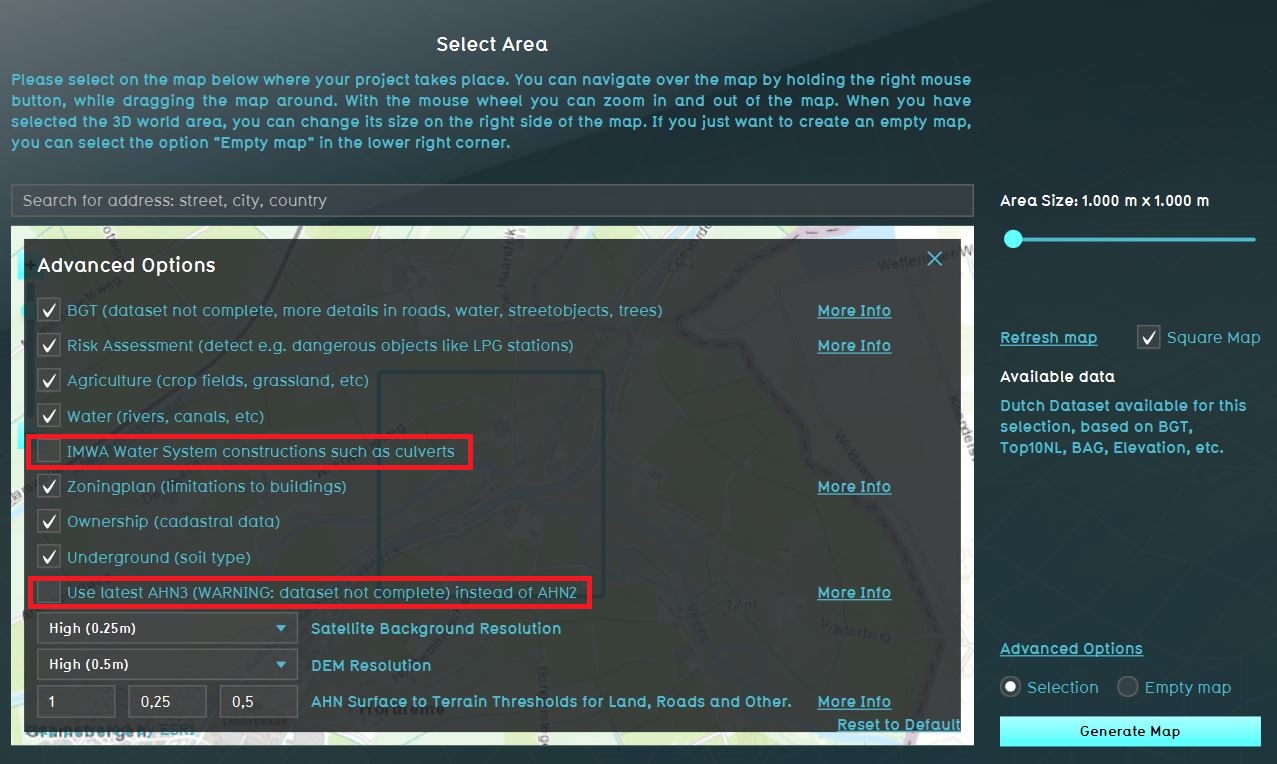
- Click on the Advanced settings and uncheck IMWA. If AHN3 data is available as open data for this project area, check the Use latest AHN3 option.
- Click on the Generate map button.
- The new project will now be created from the various open data sources.
Import water level areas
The water level areas contain water levels for various scenario's and will be used to determine the water level of the water body which will flow into the breach.
- Open the Geo data wizard
- Click on next and choose for Areas
- In the next step choose to Import a GeoJSON file and select the file Peilen hoofdsysteem Noord 121219.geojson
- In step 2, set the slider on 20m to create polygons from the point data.
- Choose the attribute .... for the name of the water level areas in step 5.
- Finish the wizard
- In the Current tab, click on the button Overlays
- Select the overlay Peilen hoofdsysteem from the left panel and and click on Add areas with attribute in the bottom right corner.
- In the panel that pops up, choose the attribute .... and click on Add.
Define breach location
- Add a new Area to the project. This will be the breach area. Give it a recognizable name.
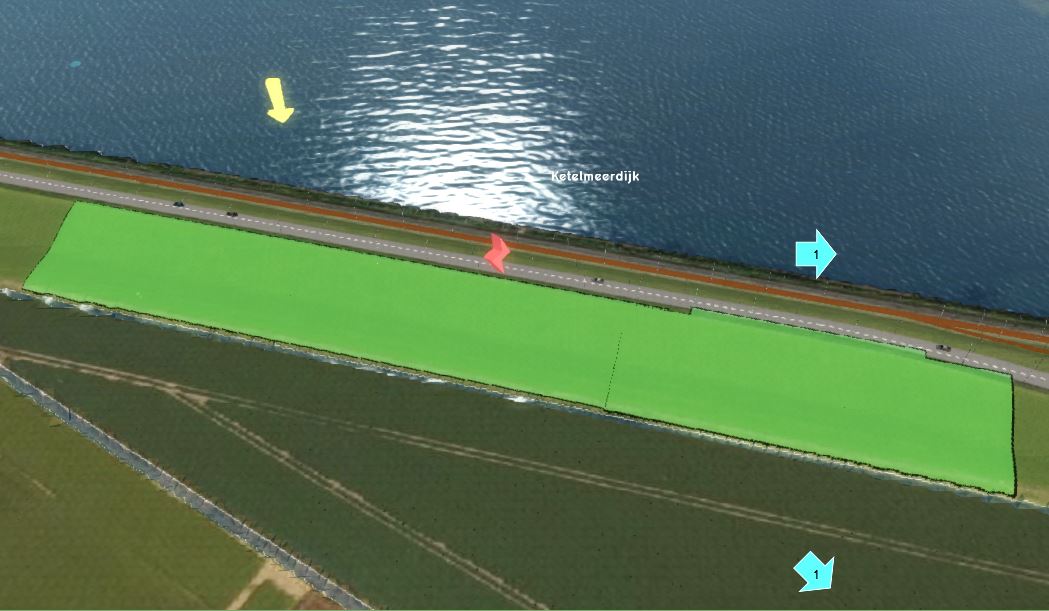
- Draw the breach area in the 3D world, in the location where the water from the breach should emerge (see tips below in gallery).
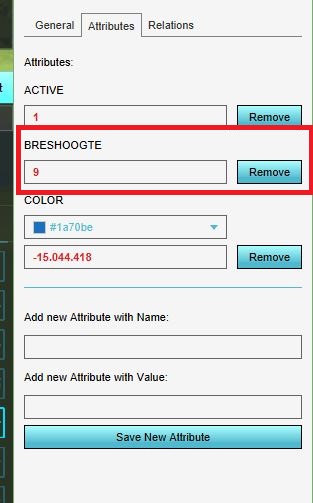
- Add an Attribute to the created Area, with the name BRESHOOGTE and the breach height value. Click on the location of the breach to know the terrain height.
-
Draw the breach area not too close to the water body and only on the slope of the levee on the side of the area that is going to flood.
Configure flooding overlay
Breach
- In the right panel, click on Configuration wizard to start the wizard
- In step 1, specify the time for the simulation calculation period.
- In step 2.1 select your breach area from the dropdown menu and fill in:
- Fixed height and width. Leave breach angle empty. Use for the breach critical speed ....
- Select use external area.
- Use an external surface level which is lower than the breach height
- Use for the external water level the measured water levels from the Peilen hoofdsysteem overlay.
- Calculate for the external area 10 x the flow rate that flows through the breach te checken via show water balance. Magnitude: 10.000.000 m2. If the expected water level fall of the main system is known, take this into account for the external area size.
Culverts
- Choose from step 2.3 to 2.6.1 the option Do nothing and proceed with next.
- In the step 2.6.4 Culverts, aelect Import culverts and click on Import culverts.
- In the Geo data wizard select the file Duikers_WVS_041219.geojson
Finish wizard
- Choose from step 2.6.3 to 2.6.5 the option Do nothing
- In step 3 and 4 proceed with next.
- In step 5 make sure the Surface elevation, Surface max speed, Surface max value and Base types are checked.
- Choose an amount of timeframes by taking into account the calculation time (which is entered in step 1), so that for example, you arrive at timesteps per hour or day.
Export results
In this last step, the results will be exported as raster data.
- When the overlay is calculated, play the overlay to see the results and check for yourself if they are realistic. If not, open the configuration wizard and adjust settings. Make sure you recalcuate the overlay again by clicking on Update now.
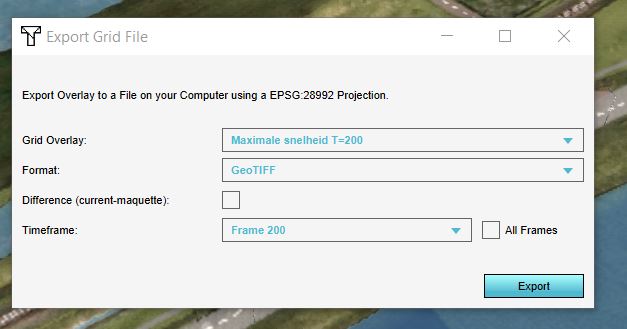
- Click on Export Grid File and check if the name is correct, choose for GeoTIFF as format and check the All frames box. The Surface max value overlay is now exported.
- Click on export and create a new folder to save all the files
-
For the Surface max value overlay click on Export Grid File and check the All frames box to export all the timeframes
-
For the Surface max speed overlay click on Export Grid File and select the last timeframe from the dropdown to only export the last timeframe
The final GeoTIFFs need to be opened in a GIS program and saved as a map with proper legend and title in jpg format. These maps needs to be created from the exported data:
- Maximale stroomsnelheid: Surface max speed map at the last timeframe
- Maximale waterdiepte per locatie: Surface max value map at the last timeframe
- Waterdiepte in de tijd/tijd-tot-inundatie: multiple Surface max value maps at different timeframes. Create for example a map for every one or two hours (depending on the simulation time).
