3D Visualization: Difference between revisions
Jump to navigation
Jump to search
No edit summary |
No edit summary |
||
| Line 1: | Line 1: | ||
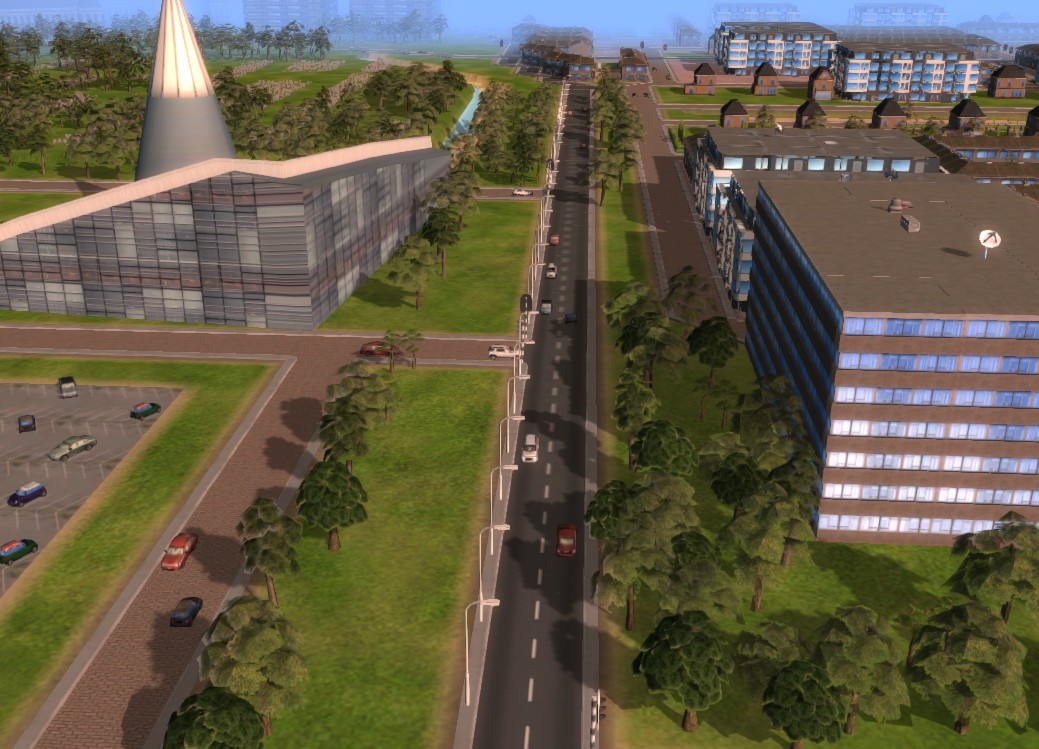
When using the {{software}} client application, a three dimensional (3D) visualization of the selected | When using the {{software}} client application, a three dimensional (3D) visualization of the selected [[project]] is rendered. In this 3D visualization users can navigate, inspect overlays and hover information and perform actions on both the current situation and future design. The effects of these actions are also visualized, either directly or after calculation. Users can switch between the current and future situation and see differences made visually. Furthermore, certain actions and events can be fired to activate special visual effects, such as a flood calculated by a Flooding overlay, visualized using a water shader. | ||
[[File:3DWorld2.jpg|left|thumb|{{software}} 3D World]]<br clear=all> | [[File:3DWorld2.jpg|left|thumb|{{software}} 3D World]]<br clear=all> | ||
Revision as of 11:01, 19 January 2023
When using the Tygron Platform client application, a three dimensional (3D) visualization of the selected project is rendered. In this 3D visualization users can navigate, inspect overlays and hover information and perform actions on both the current situation and future design. The effects of these actions are also visualized, either directly or after calculation. Users can switch between the current and future situation and see differences made visually. Furthermore, certain actions and events can be fired to activate special visual effects, such as a flood calculated by a Flooding overlay, visualized using a water shader.
