List of Demo Projects: Difference between revisions
Jump to navigation
Jump to search
No edit summary |
No edit summary |
||
| Line 76: | Line 76: | ||
--> | --> | ||
|} | |} | ||
[[Category:Demo | [[Category:Demo projects]] | ||
Revision as of 10:48, 30 January 2024
The following Demo Projects are available to users in the Tygron Platform, including users with a trial account:
| Demo Project | Image | Description |
|---|---|---|
| Basics | 
|
In this Basics project you will learn to develop a number of basic skills for working with the Tygron Platform. A good project to start with for new users. |
| Breach | 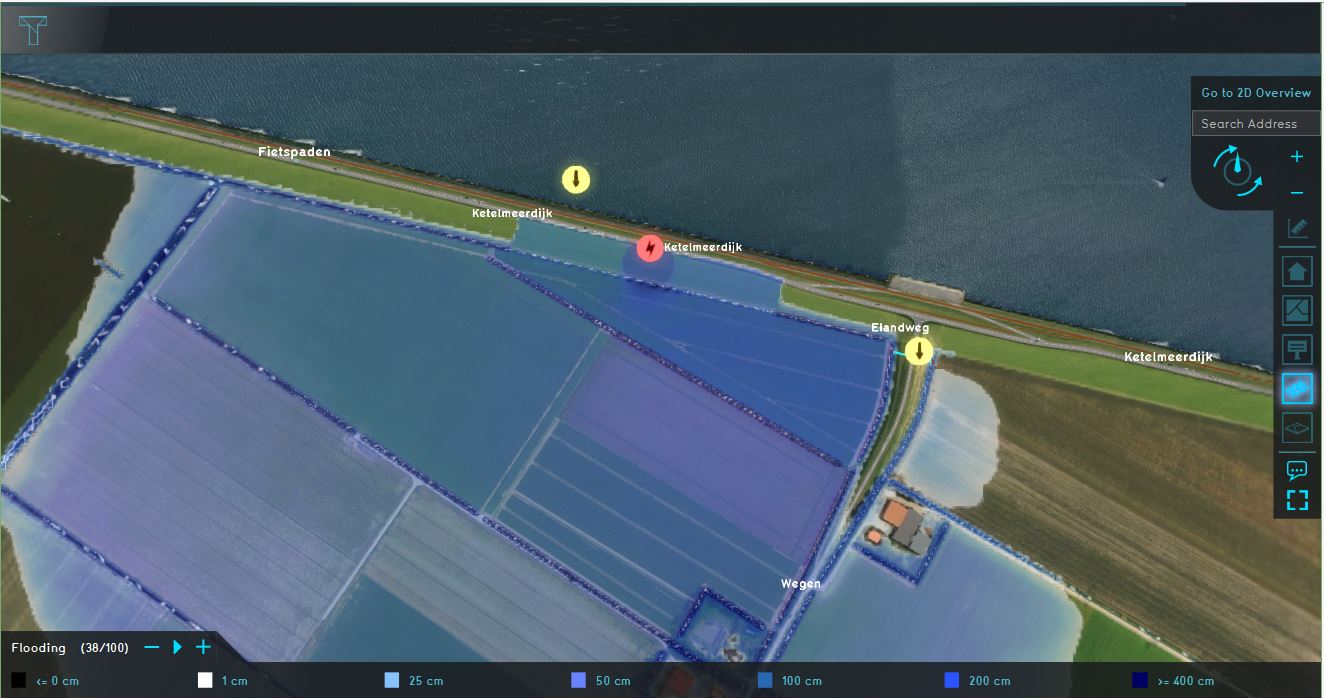
|
A flooding due to a levee breach is modelled in this project of a polder area in Flevoland, the Netherlands. In the project you will see the levee breach is growing over time. View this project if you are working in fields such as hydrology, water safety and data analysis and visualization. |
| DXF Import | File:DXF project.png | An urban plan in DXF format is imported, and a geotiff is added to a measure. |
| Create culverts | 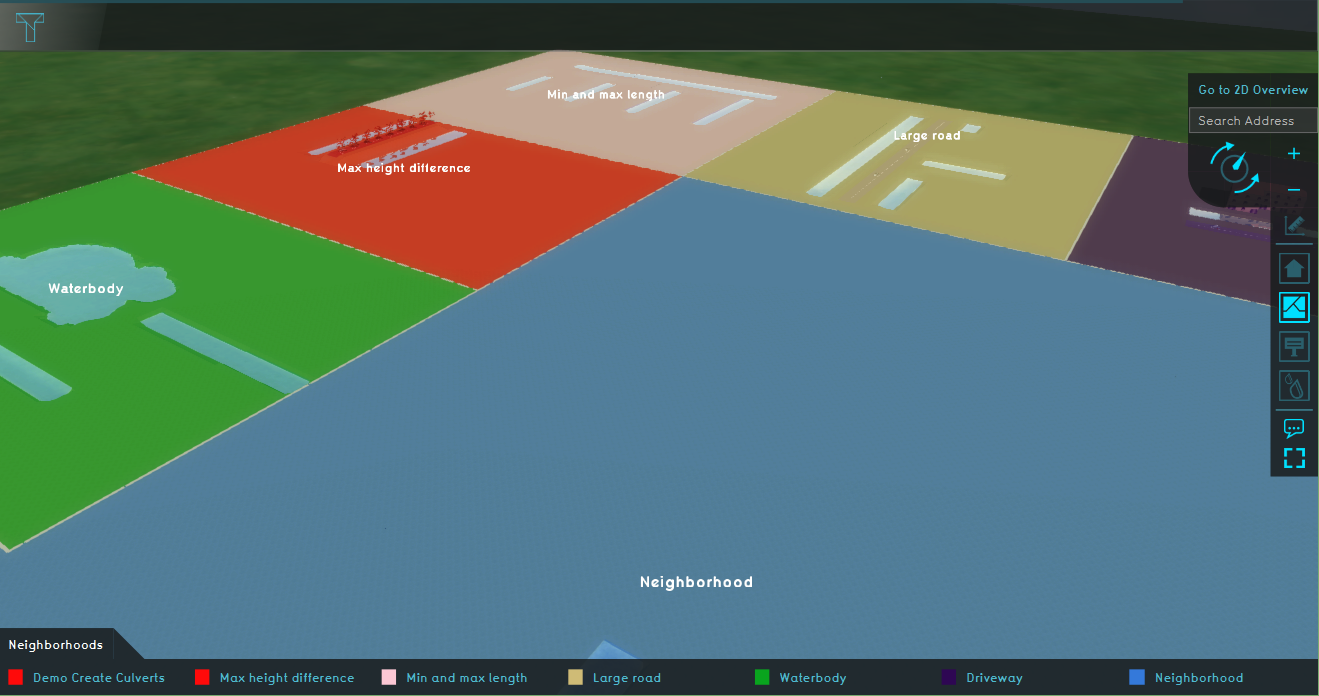
|
The Demo Create Culverts project demonstrates the use of the Water Connection Generator for creating culverts in a testbed setting. It can serve as a working demo to further explore the configurable parameters of the Water Connection Generator panel. View this project if you are working on water related projects. |
| Heat Stress | 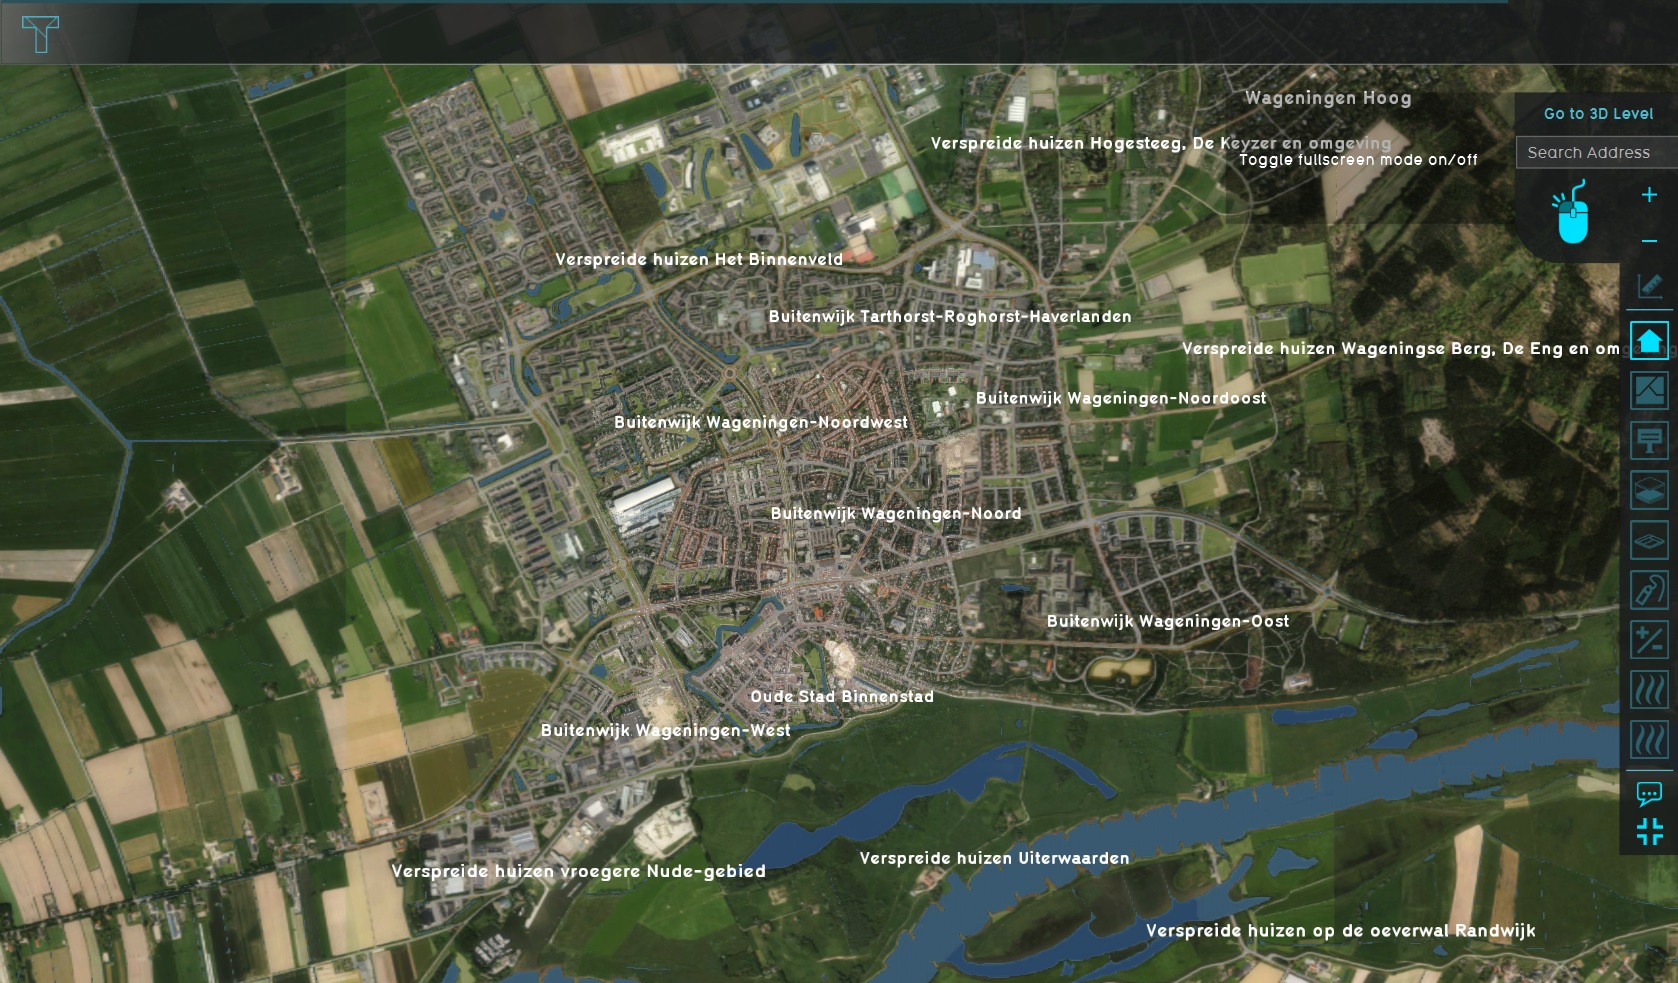
|
This project demonstrates the Heat module in the city Wageningen, the Netherlands. The Heat module calculates Heat stress, implemented according to the Dutch DPRA standard for climate adaptive cities. In this example project, also other maps can be analyzed such as shade and foliage maps. Also actions and measures can be taken to reduce heat stress. View this project if you are working in fields such as climate adaptation, environmental studies, data analysis and visualization and urban planning. |
| Inlet Flooding | 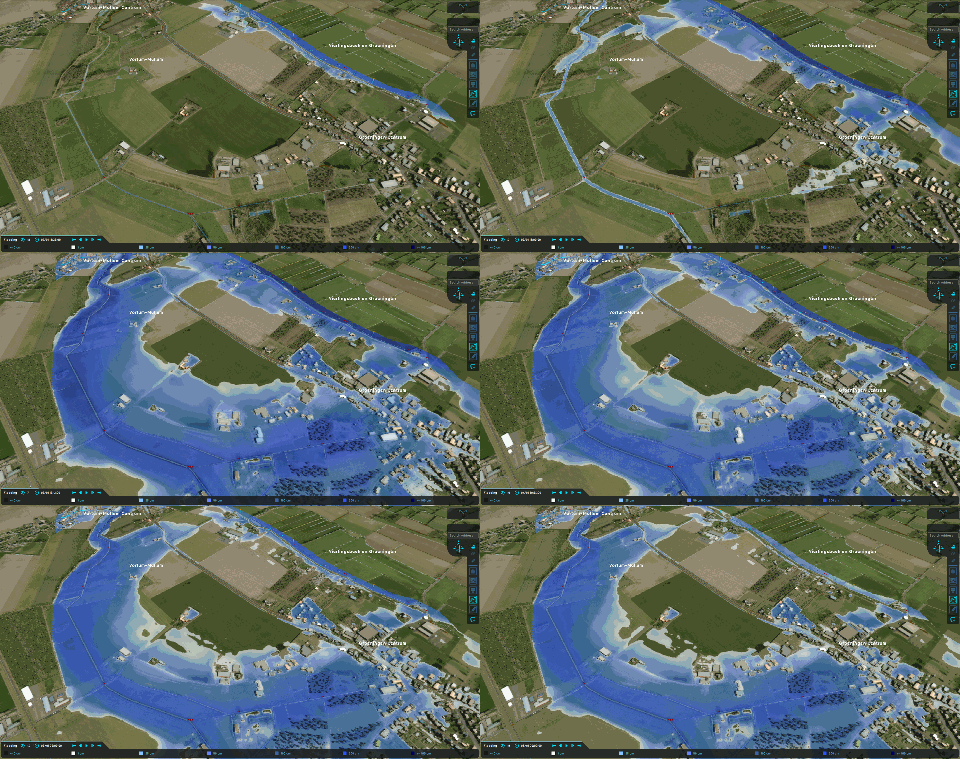
|
This project demonstrates how to simulate a rising and lowering flooding of a river near a levee using multiple inlets. |
| Parametric | 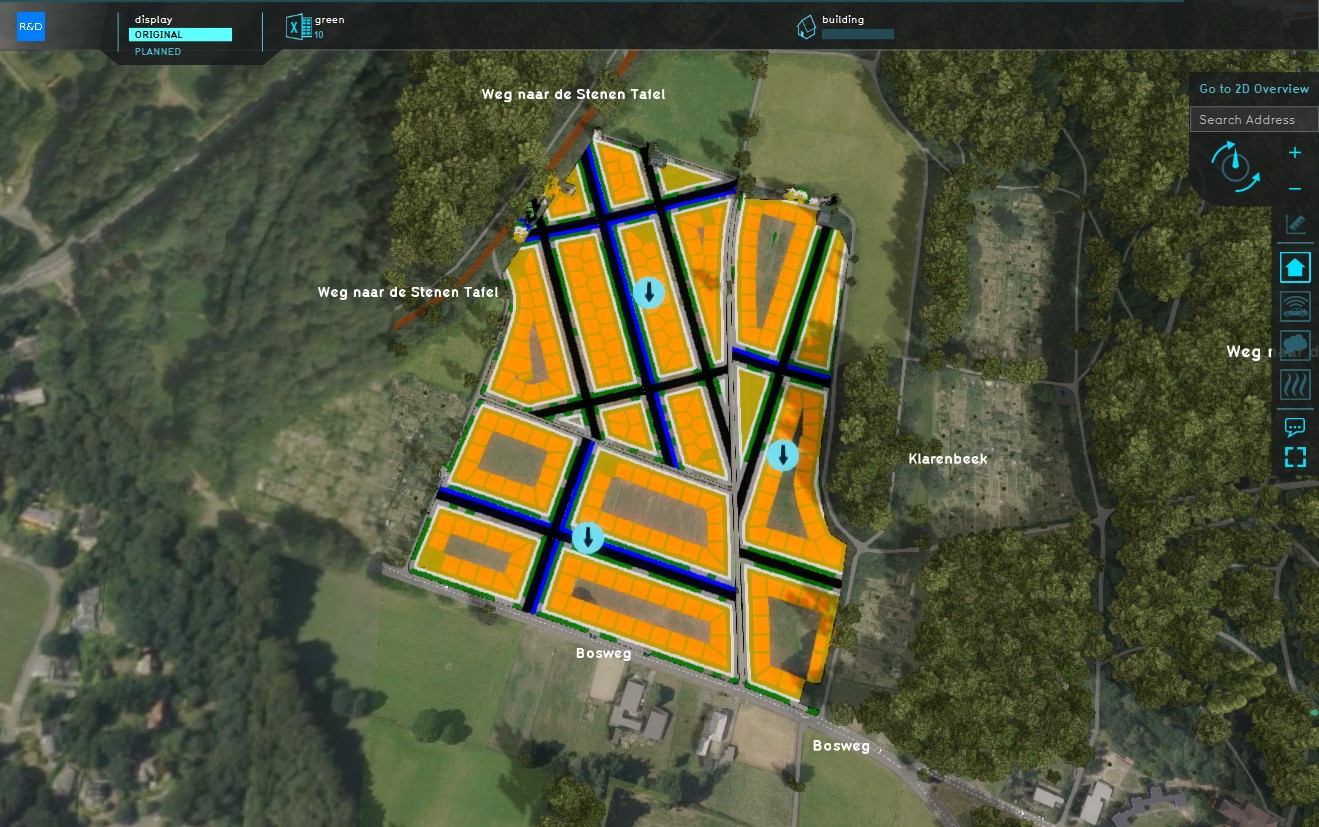
|
This project features an unused section of land and a number of prepared parametric plans to experiment with the parametric design functionality. Indicators provide insight into the net results of each plan, and the setup allows for quickly iterating between configurations. |
| Rainfall | 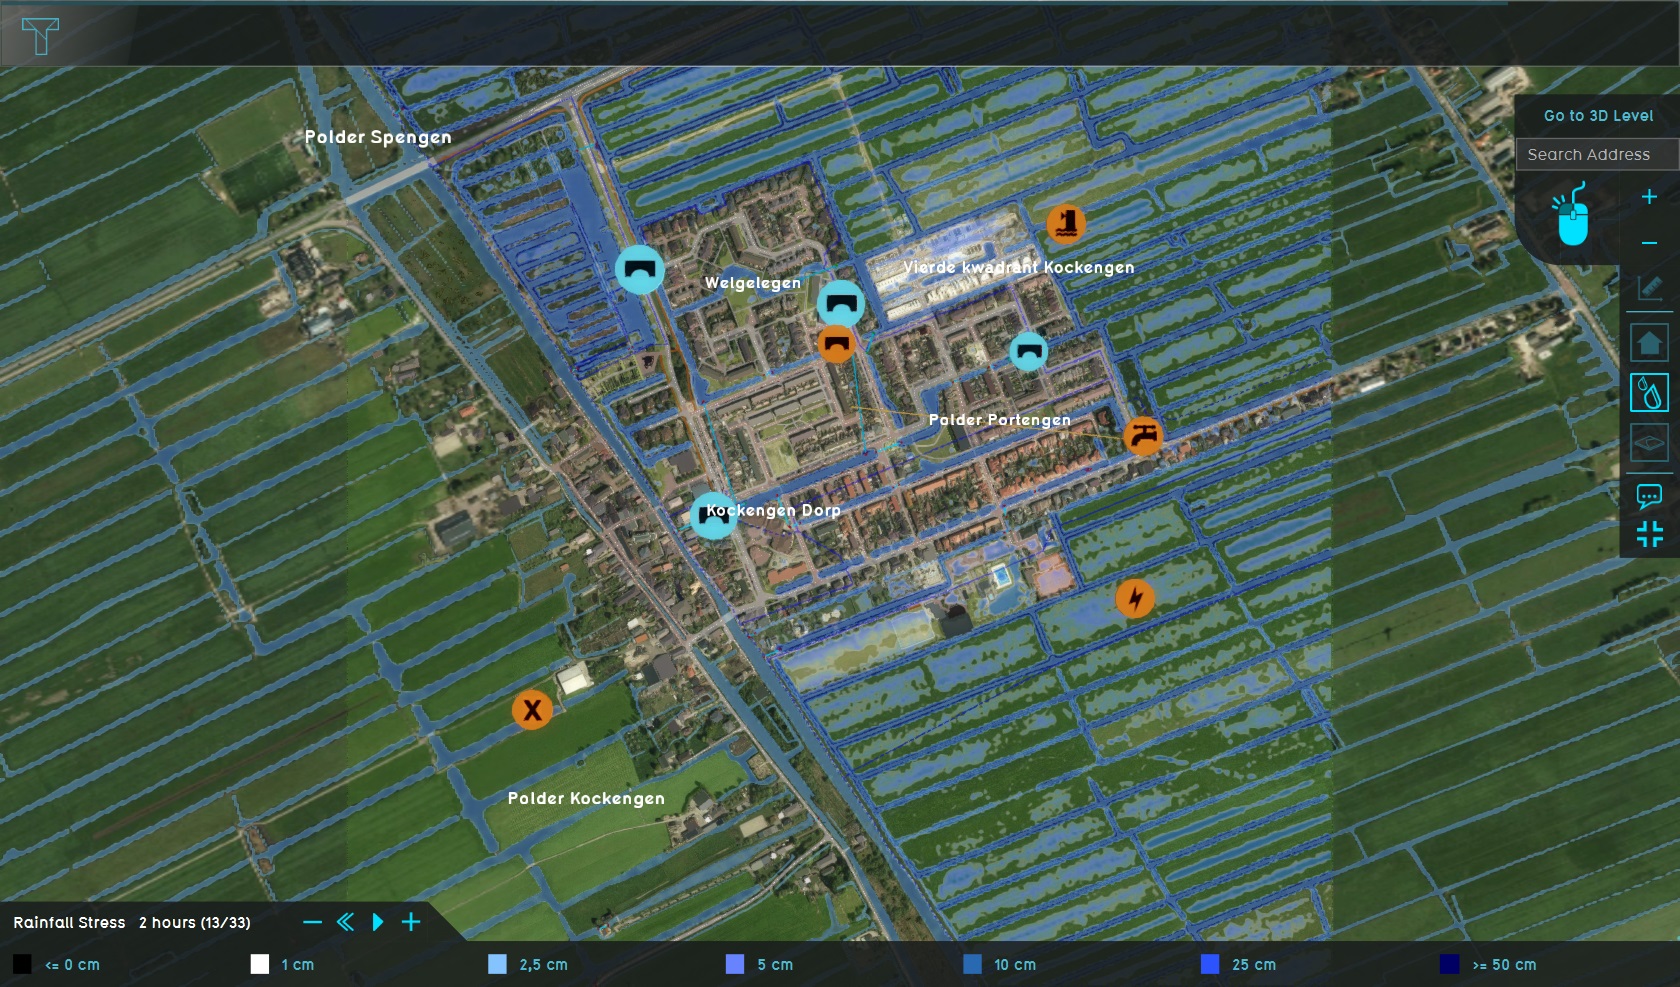
|
In this project the Rainfall overlay is demonstrated, one of the calculated results from the Water module in the urban/rural area in the Netherlands: Kockengen. Data to form the water model, such as water level areas and hydraulic structures such as weirs and culverts are added to create an accurate calculation. In this example project, actions and measures can be taken to reduce water stress. View this project if you are working in fields such as hydrology, environmental studies, climate adaptation, data analysis and visualization and urban planning. |
| San Francisco | 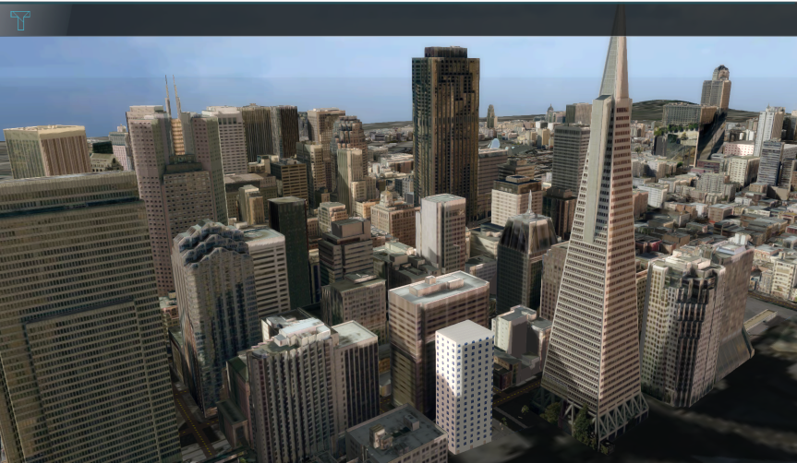
|
Take a look at this photorealistic project of San Francisco. With the use of an I3S Scene Layer of San Francisco the 3D model is created and further enriched with OpenStreetMap data and open data of San Francisco. A spatial analysis on the sky view factor in this high-rise urban area is demonstrated. View this project if you are working in fields such as GIS, BIM, data analysis, 3D visualization, urban planning and architecture. |
| Seepage | 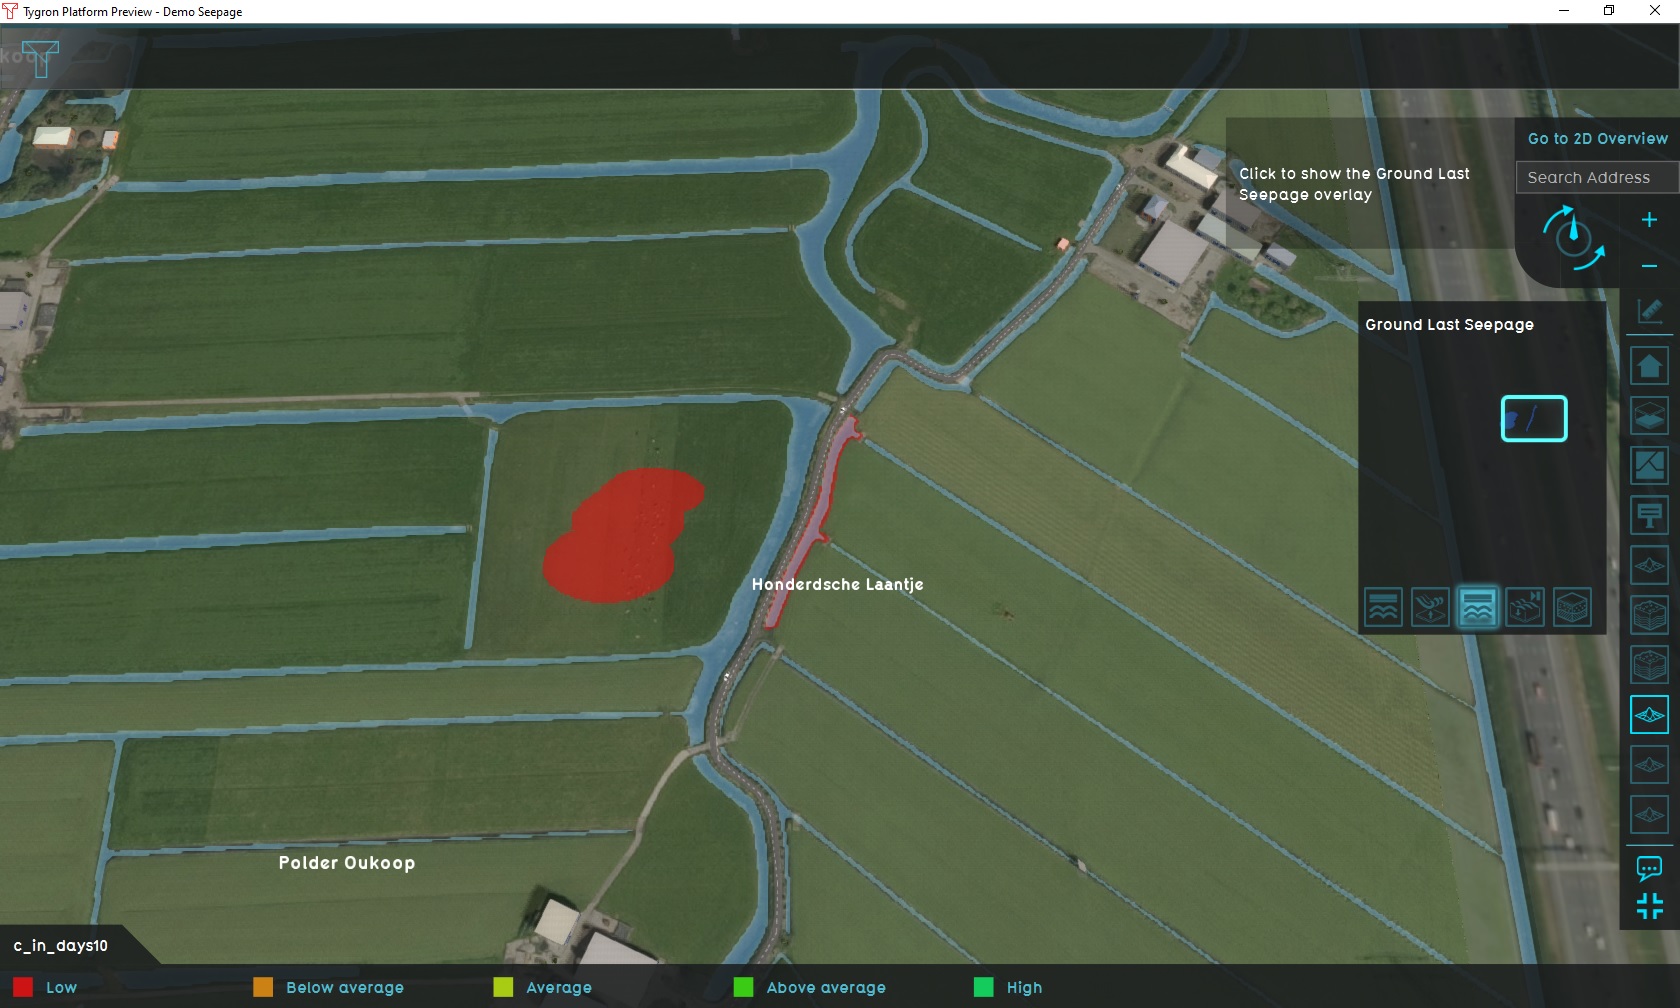
|
In this project a location in The Netherlands, Polder Oukoop, is experiencing seepage.
It can serve as a working demo to explore the Seepage functionality and the configurable parameters. The following steps below show how seepage calculations with different parameters highlight the different ways seepage can be configured and varied. |
| Water | 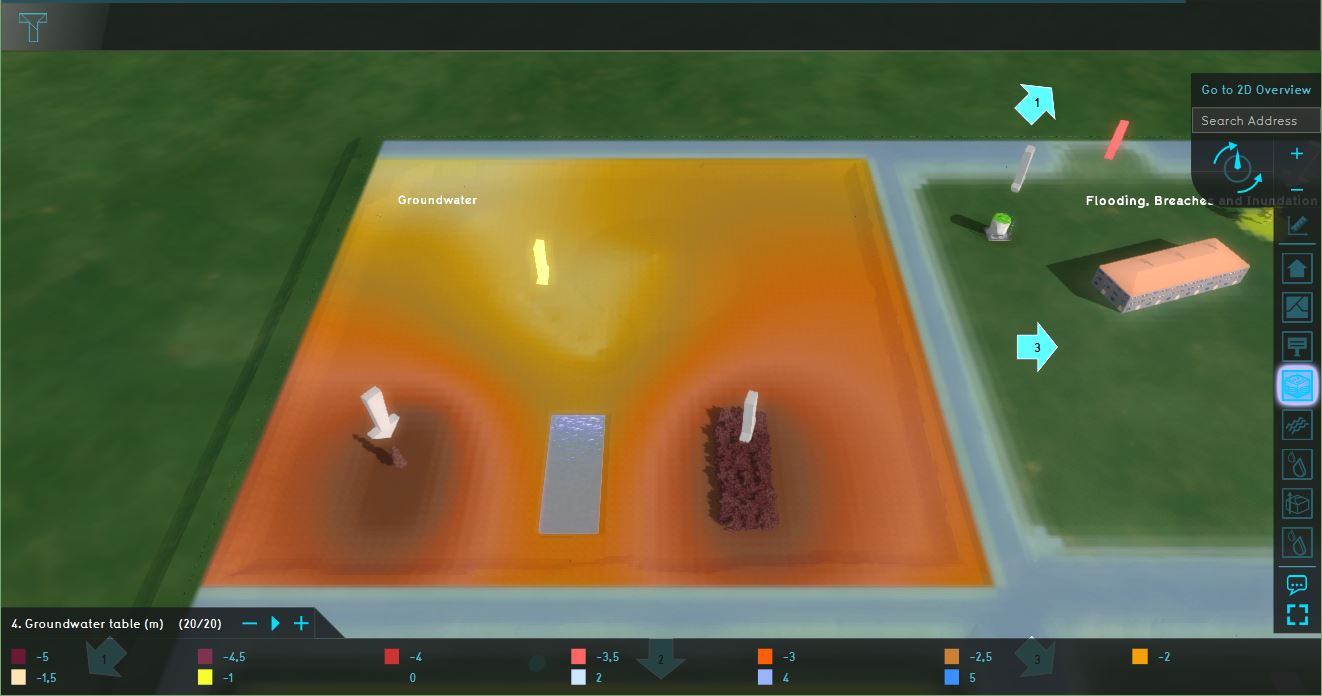
|
This project shows multiple aspects of the water module in a testbed setting. Take a look in this project to see the workings of the water module. View this project If you are working in fields such as hydrology, environmental studies and climate adaptation. |
| Watershed | 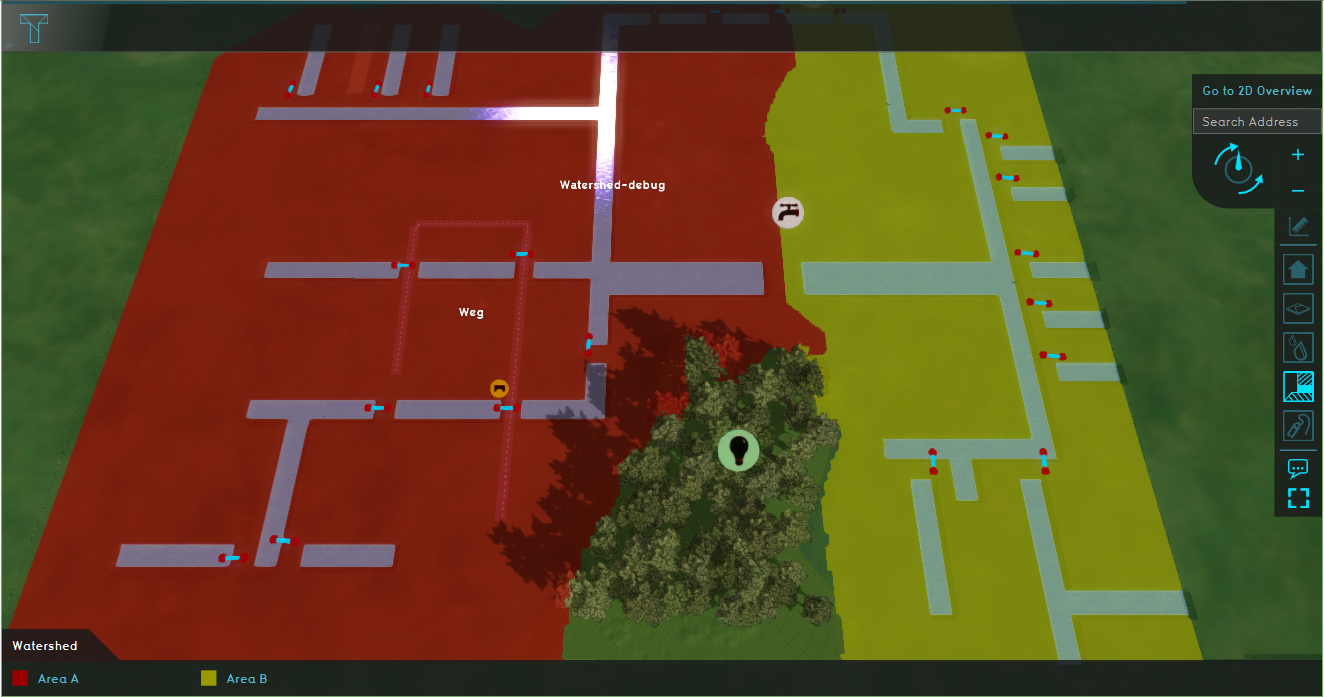
|
This project shows the watershed module in a testbed setting. Take a look at this project to see the workings of the watershed module to calculate watershed areas. View this project if you are working in fields such as hydrology and environmental studies. |
| Windsolar Power | 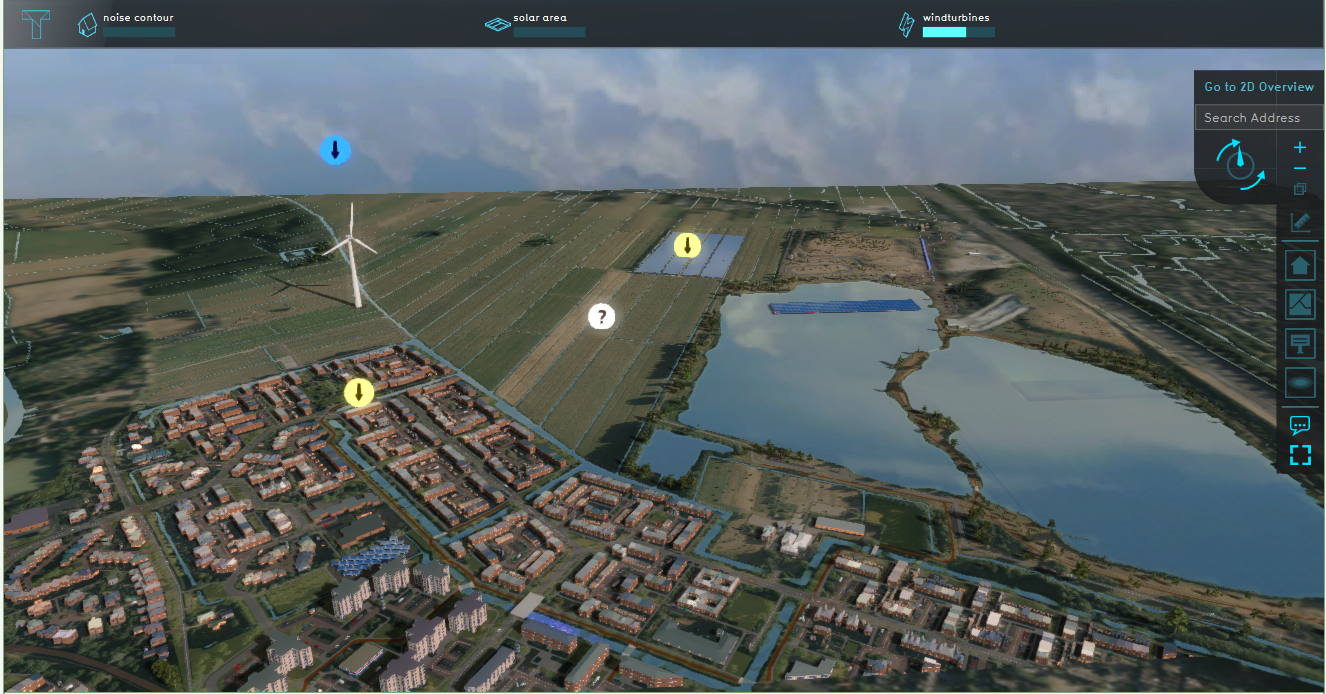
|
This project demonstrates examples of different wind and solar functionalities and analysis related to energy that can be done with the Tygron Platform. The scenarios in this project are completely fictional and only serve to demonstrate these functionalities. Take a look at this project when working on topics such as sustainable energy and (regional) energy strategy. |
| Demo 3-30-300 Project | 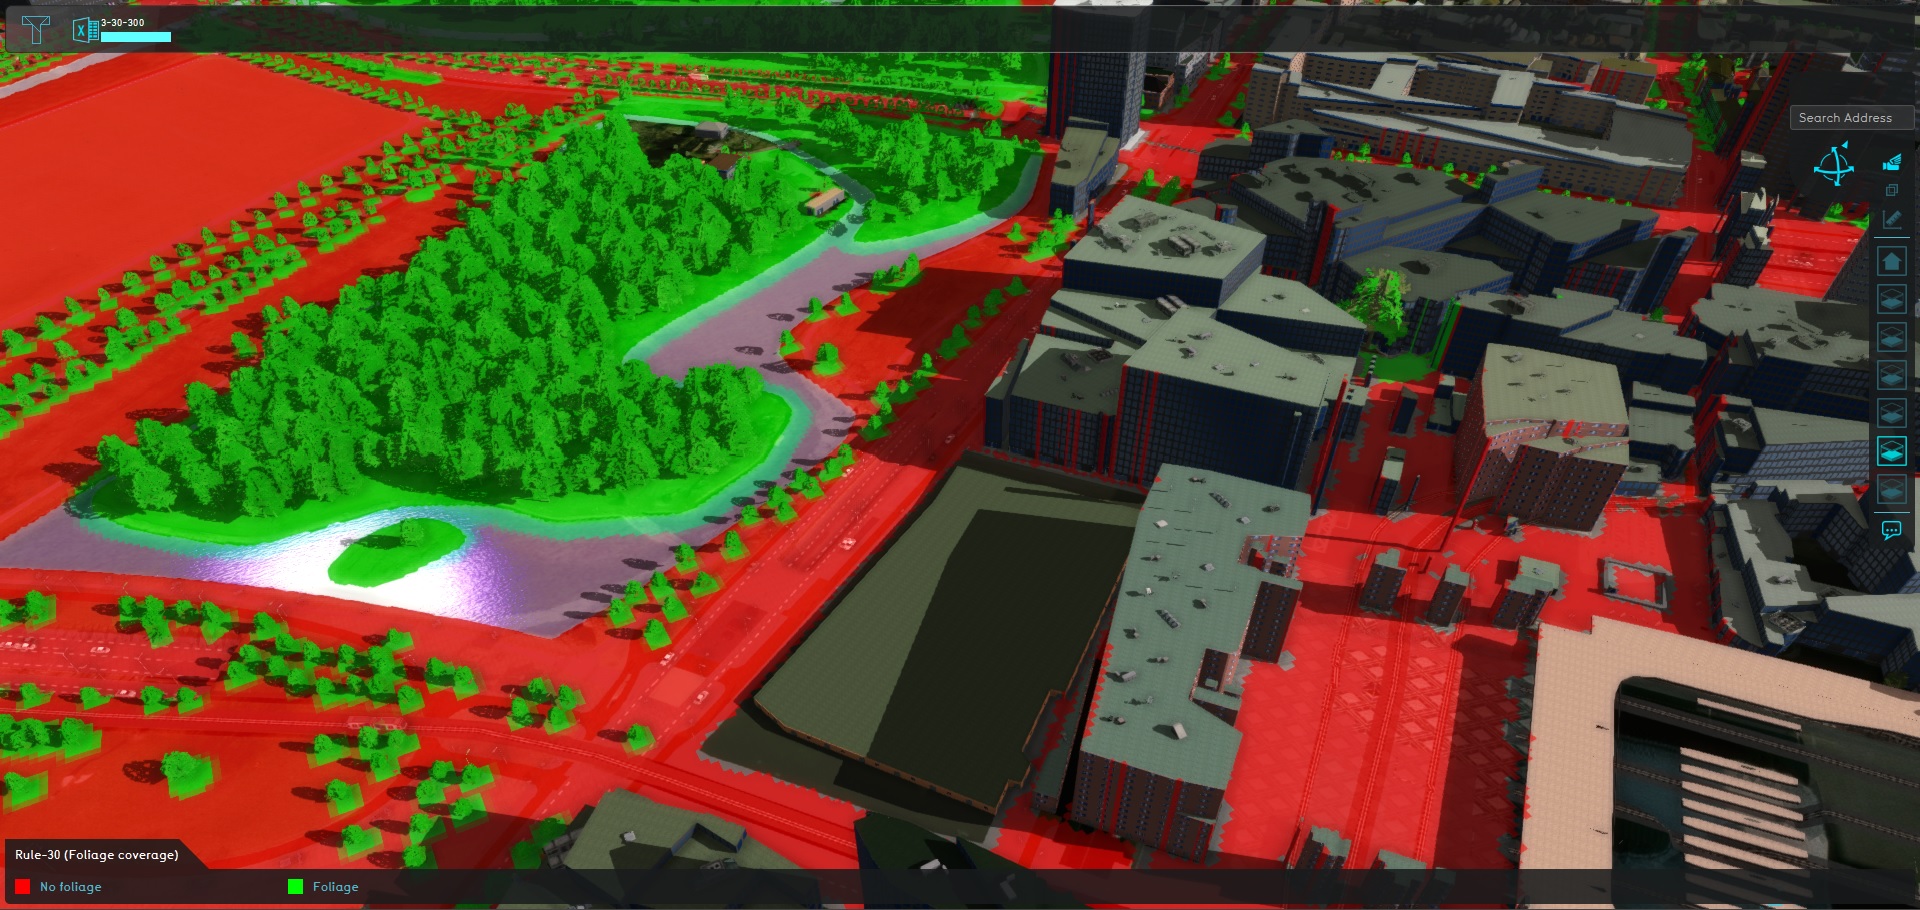
|
This Project demonstrates one possible implementation for the 3-30-300 guidelines. All calculations are dynamic and can be run based on data present in Projects by default. It relies strongly on spatial calculations, resulting in Overlays with both intermediate and final results. |