Geo Data tutorial: Difference between revisions
No edit summary |
No edit summary |
||
| (113 intermediate revisions by 6 users not shown) | |||
| Line 1: | Line 1: | ||
{{ | {{tutorial prerequisites | ||
| tutorial=This tutorial relies on base knowledge about the editor interface. | |||
| project=This tutorial will include the creation of a new project. | |||
| Download and unpack the content of this zip-file on your desktop for the necessary files: {{wiki download|Tutorial_GeoData.zip}} | |||
| Create a [[New Project Wizard#Videos|new project]] of Delft. For the exact location of the project, see the image below or use the ''project_location.geojson'' file (in the above zip-file) to define the project location. See [https://community.tygron.com/forum/discussion/219/new-feature-for-easier-selecting-a-new-project-area#latest this tip] on our forum for more information on how to use the GeoJSON file for selecting the location. | |||
}} | |||
==Getting Started== | ==Getting Started== | ||
In this tutorial | In this tutorial you will learn the different ways to import different types of data in your project: | ||
* data from Web services | |||
* vector data | |||
* 3D models | |||
* raster data | |||
<!--For this tutorial you will have to create a new project of the city of Delft in the Netherlands.--> | |||
==Import data from Web services== | |||
In this section we are going to import data from a: | |||
* WFS (Web Feature Service) | |||
* WMS (Web Map Service) | |||
* CSW (Catalogue Service) | |||
== | ===WFS=== | ||
In this | In this assignment you will create an Archeological Terrains Map. | ||
[[File:Archeological_map.JPG|600px|center]] | |||
# First read what exactly a [[WFS|Web Feature Service]] is. | |||
# Now we need to find data that is published as a WFS. For the Netherlands, a website to find open data is: [http://nationaalgeoregister.nl Nationaal Georegister]. Go to the Nationaal Georegister and search for the''Cultuurhistorische Hoofdstructuur: Archeologische terreinen van provinciaal belang'' dataset. Take a moment to read what this dataset is about. Then copy the WFS URL: this is the URL that contains WFS in the URL link. | |||
[[File:Search_ngr.JPG|500px|center]] | |||
<br> | |||
<br> | |||
[[File:Copy_wfs_url.JPG|500px|center]] | |||
# Start the Geo Data Wizard by clicking in the Editor on ''Geo import''. {{Editor location|Geo Import}} | |||
# Choose the correct type for importing the data. Since we are going to create a map which is equivalent to an overlay, choose as type: Areas. Read the [[Geo_Data_Wizard|Geo Data Wizard]] for more information about the differences between the import types. | |||
[[File:Import_areas.JPG|600px|center]] | |||
# In step 1 of the wizard, choose for ''Import a Web Feature Service''. | |||
# Click on ''add a new Feature Service'' and provide a custom name, Service Type (WFS_JSON) and URL of the WFS. After you have entered this data, click on ''add'' and then ''next''. | |||
{{Editor | [[File:Paste_wfs2.JPG|600px|center]] | ||
# In step 1.2 all the datasets that are published through this URL are shown (these are called layers). Choose from the drop down menu the layer: ''RCE_RIJKSMONUMENTEN_VLAK''. If this dataset is not in your project, an error message is given. What could be a reason that the data is not in your project? | |||
# In step 2 the location of the objects in your project area is shown. Click ''next''. | |||
# In step 3 we can filter the features and in step 4 adding as new areas or updating areas. Click 2 times on ''next''. | |||
# In step 5 we name the features. Click on: ''Based on specific Attribute'' and choose for the attribute for example ''subcategorie''. Now the features will be named after their sub category. | |||
[[File:Naming2.JPG|600px|center]] | |||
# In step 6 the attributes that will be imported are selected. Only numerical attributes are imported in the {{software}}. These are by default checked. Why is the list of attributes shorter than the list was in step 5? Click on ''next''. | |||
# In step 7 click on ''Finish''. Now the Geo data wizard is finished and the data is imported. | |||
====Create an overlay==== | ====Create an overlay==== | ||
# In the Editor, go to Areas and notice that the areas you have imported are listed on the left side. Select one and notice that in the [[3D Visualization]] the corresponding area is highlighted. In the tab ''Attributes'' on the right side of the screen, notice that the attributes are imported as well. | |||
{{Editor | {{Editor location|areas}} | ||
[[File:View_area3.JPG|600px|center]] | |||
# Since we don't want to go by these areas one by one to see the archeological value areas, we are going to create a map so we can see them in one view. | |||
{{Editor | Click therefore in the editor on overlays. | ||
{{Editor location|overlays}} | |||
# Add a new overlay by clicking in the bottom left corner on ''Add Areas''. | |||
# Notice a new overlay, named: ''Speciaal gebied'' is added. | |||
# Select this overlay and notice the new menu on the right side. | |||
[[File:View_area2.JPG|600px|center]] | |||
# Give the new overlay a fitting name and check the areas belonging to the archeological value map. If there are a lot of areas, you can also click on the button in the bottom right corner on ''Add Areas with Attribute''. Here you can select a common attribute of these areas. Select the common attribute, for example ''RIJKSMONUMENT_NUMMER'' and click on Add. | |||
[[File:Add_areas1.JPG|600px|center]] | |||
=== | ===WMS=== | ||
In this assignment we will also create an Archeological Terrains map. | |||
# Read first on the Wiki what a [[WMS|WMS]] exactly is. | |||
# Add an Image overlay by hovering over the overlays button and choose the add Image overlay. | |||
{{Editor | {{Editor location|Overlays}} | ||
# Notice that a new overlay (named Beeldlaag) is added. Change on the right side the name and then open the Configuration Wizard. | |||
# Select the second option: import from a Web Image Service | |||
# Select ''Add a new Image Service'' and provide a custom name, Service Type (WMS_IMAGE) and URL of the WMS. If the data is filled in correctly, click on add and then ''Next''. As WMS URL you can use the WMS url of the ''Cultuurhistorische Hoofdstructuur: Archeologische terreinen van provinciaal belang'' of the Nationaal Georegister from the previous assignment. The WMS url is the url with WMS in the link. | |||
# Choose in the drop down menu the layer ''Terreinen van archeologische waarde - provincie'' and click ''Next''. | |||
# In the following steps, proceed with ''Next'' and then ''Finish''. | |||
# After you have finished the wizard and given the overlay a proper name, can you tell the difference between the WFS and the WMS data? If not, click on the colored areas in both maps (WFS and WMS). Do you see a difference in the information in the hover panel? | |||
=== | [[File:Archeological_map_wms.JPG|600px|center]] | ||
===Catalogue Service=== | |||
In this step we are going to create a map (overlay) of all the monumental buildings in Delft. | In this step we are going to create a map (overlay) of all the monumental buildings in Delft. | ||
[[File:Monumental_buildings.JPG|600px|center]] | |||
# Start by reading what a [[CSW|CSW]] exactly is. | |||
# Open the Geo Data wizard and choose for type ''AREAS''. | |||
# In step 1 of the wizard, choose for: ''Search for data in a Catalog Service''. | |||
# Click on ''Select Catalog Service'' and choose ''ArcGIS online''. | |||
[[File:Catalog_service.JPG|600px|center]] | |||
# In the next screen you can type a keyword of the dataset you want to find. We are going to create a map of the monumental buildings in Delft. Think of a correct keyword to type and click on ''Search''. Remember the project owner of the data should match the location of your project. Why is that? | |||
[[File:Monument_csw.JPG|600px|center]] | |||
# Complete the wizard. Don't forget in step 5 to choose the correct attribute to base the name on. | |||
# Follow the previous steps for creating an Overlay. | |||
# Now your map of Monumental Buildings is finished. | |||
==Import vector data== | |||
In this section we are going to import [[Geo_Data|vector]] data from a file. | |||
To import data in the {{software}}, the file must be of the GeoJSON format. | |||
In the next assignment we are going to import two fictional datasets as objects in the 3D model. | |||
One dataset contains a [[spatial_plan|spatial plan]] with a road, an office, parking space and a park. The other dataset contains trees. | |||
====Office plan==== | |||
* Read this [[GeoJSON#What_is_GeoJSON|section]] on the Wiki of what exactly a GeoJSON file is. | |||
* Mostly data is not available as a GeoJSON but for example as a Shapefile. We can create a GeoJSON file ourselves with a GIS. | |||
# In the zip folder you downloaded at the start of this tutorial are two .shp files. These are Shapefiles. Follow the [[GeoJSON#How_to_create_a_GeoJSON_file|steps]] to create a GeoJSON file in you preferred GIS. You can skip the part of modifying the attributes. | |||
# After you have created the two GeoJSON files, open the Geo Data Wizard. | |||
# Select as type ''Buildings''. | |||
[[File:Type_buildings.JPG|600px|center]] | |||
# Select in step 1 ''Import a GeoJSON file'' and choose the file: ''Office'' in the next step. | |||
# Click on Next in the following steps, choosing consequently the first option. In step 5 choose the correct column for the naming of the objects. | |||
#In step 7 we see a new step that we did not come across when choosing to import data as ''AREAS''. In this step you decide what kind of 3D object the data will be. Click on ''One Function'' if your dataset only consists of data of one type, for example a dataset with only buildings or only roads. If you have a file like we do with an office, road, parking space and building, choose ''Function Mapping''. | |||
# Choose first the default function by clicking on ''Select''. For this tutorial we choose as default function a function in the category Offices. | |||
# Then make sure the drop down menu is on ''Name'' and click on ''Add''. Choose for the Function fFlter 1 the Type column. Now check the other function box and click on ''Values''. Based on the data in the column Type, you can select a function. Select for example Park, click on ''Ok'' (the screen closes) en click on the button ''Select''. Choose from the Function list a park function. | |||
# Repeat the previous steps for the attributes ''Parkeerplaats'' and ''Weg''. We are now creating rules to base the mapping on. We do not have to create rules for every attribute, since we have set a default function. Think of what would happen if we had another feature in our dataset with for example Type:School. | |||
[[File:Function_mapping.JPG|600px|center]] | |||
# Click on Next. In step 8 we can also create a mapping for the Stakeholders. For example, we can assign the roads, park and parking space to the municipality and the office to the company stakeholder. The mapping is done in the same way as step 7. Create a mapping with at least two stakeholders. | |||
[[File:Stakeholders.JPG|600px|center]] | |||
# Finish the wizard. | |||
# Notice the new buildings are now in the 3D model | |||
[[File:Location_plan.JPG|400px|center]] | |||
[[File:New_plan_2.JPG|400px|center]] | |||
====Tree dataset==== | |||
# Import the other dataset ''trees'' by repeating the previous steps for importing a GeoJSON file. | |||
# In step 2 of the wizard, notice that there are 10 points in the datset and no lines or polygons. In the {{software}} it is only possible to import polygons. Therefore, we can buffer the points to create (round polygons) for the trees. Set the buffer size on 1, so as not to create very large trunks and follow the rest of the wizard. | |||
[[File:Point_data_buffer.JPG|600px|center]] | |||
# How would you do the mapping in step 7? As ''One Function'' or a ''Function Mapping''? | |||
# After finishing the wizard, notice the new trees in the office location area. | |||
[[File:Trees.JPG|400px|center]] | |||
==Importing a 3D model== | |||
In the following steps we will replace the previous imported office building with a simple 3D model of a fictional office building. | |||
# There are a lot of formats for 3D models. In the {{software}} we use the I3S format for importing 3D models. Read [[I3S|here]] more about this format. | |||
# Open the Geo Data wizard and choose Buildings. | |||
# Choose in step 1 the option import an I3S SLPK file and choose in the next step the ''office_building.slpk'' file. The originally 3D CAD building model (in DWG file format) was transformed to an SLPK file. For more information on how to create an SLPK file from different 3D file formats, consult [[How to create an SLPK file]]. | |||
[[File:I3s_step.PNG|600px|center]] | |||
4. Proceed with Next until step 4. In step 4, choose the first option to Update the 3D model of existing buildings. Now only the model will be updated, but the building will have the same function and attributes. | |||
[[File:Update_3D_model.PNG|600px|center]] | |||
5. Finish the wizard and notice the updated office building. | |||
<gallery mode="packed"> | |||
File:Test_building.PNG|3D CAD building | |||
File:Office_building_demo.PNG|Building imported in the {{software}} | |||
</gallery> | |||
See also the [[Demo_San_Francisco_Project|Demo San Francisco project]] for a project of San Francisco generated from, among others, [[I3S|I3S Scene Layer data]]. | |||
==Importing raster data== | |||
For this part of the tutorial we use the ready prepared GeoTIFF Kd_Delft.tif. This file contains a selection of the layer ''doorlatendheid_laag 1'' from the [http://data.nhi.nu/National Hydrological Instrument]. They layer represents classes of hydraulic conductivity of the freatic groundwater layer; the ability of the layer to transport groundwater, in m<sup>2</sup>/day: | |||
{| class="wikitable" | |||
! class in GeoTIFF | |||
! kd [m<sup>2</sup>/day] | |||
|- | |||
|2 | |||
|5-10 | |||
|- | |||
|3 | |||
|10-20 | |||
|- | |||
|4 | |||
|20-30 | |||
|- | |||
|5 | |||
|30-40 | |||
|- | |||
|6 | |||
|40-60 | |||
|- | |||
|7 | |||
|60-80 | |||
|- | |||
|8 | |||
|80-100 | |||
|- | |||
|} | |||
If you finish the tutorial, the result should be as the picture below: | |||
[[File:GD_tuto_KD_Overlay.PNG|800px|center]] | |||
===Creating a GeoTIFF Overlay=== | |||
Go to: | |||
{{Editor location|overlays}} | |||
and select Add Geo Tiff. | |||
Add the GeoTIFF ''Kd_Delft.tif'' in the following steps: | |||
# In the general-tab press ''Select GeoTIFF'' | |||
# In the GeoTIFF Import Wizard, press ''Import new Geo Tiffs''in the bottom-right | |||
# Locate ''Kd_Delft.tif'' and press ''Open'' | |||
# Make sure your newly imported GeoTIFF is selcted and press ''Apply'' | |||
In the general-tab ''GeoTIFF:'' should refer to ''Kd_Delft.tif''. Now add a legend: | |||
# go to the legend tab | |||
# create a legend with the 7 classes as above, by: | |||
#* checking ''Has Custom Legend'' | |||
#* adding 7 records (or removing if you have to many) | |||
#* adding values, descriptions and colors starting from the lowest record | |||
# if finished, go to the general-tab and press ''refresh grid'' | |||
You should arrive at the overlay as shown in the picture above. Please check the following: | |||
* open ''Kd_Delft.tif'' in a GIS-editor (e.g. QGIS); review the presence of a NoData value and projection. If these are not present, the file will not be imported(!!) | |||
* open the GeoTIFF Import Wizard and notice the option ''overwrite CRS''. If your GeoTIFF does not contain projection info, you can use this option to specify a CRS (Coordinate Reference System). If the {{software}} has trouble projecting your projected GeoTIFF on the map, you can also use this option to overwrite the existing CRS. | |||
===Changing a DEM=== | |||
For the purpose of this exercise, we will change the DEM with the ''Kd_delft.tiff'', previously imported. Note, it doesn't make sense to do so, but it is just for the purpose of the exercise. | |||
Note, if you change your DEM, you will loose the original DTM. Go To: | |||
{{Editor location|overlays}} | |||
And the Heightmap Overlay. Then: | |||
* change the grid-cell size to 1m | |||
* select DTM (where you will not see the elevation of houses) | |||
* export the DTM as a GeoTIFF | |||
Now we will import a different DEM. Go to: | |||
{{Editor location|import elevation}} | |||
And do the following: | |||
* Select ''Select elevation GeoTIFF'' | |||
* Select ''kd_delft.tiff'' | |||
* Press ''apply'' | |||
The DTM should look as below: | |||
[[File:GD_tuto_KD_as_elevation.PNG|800px|center]] | |||
Now: | |||
* revert the DTM to the elevation model to its original state by re-importing the DEM you previously exported | |||
* make a GeoTIFF in QGIS covering a part of the project area, import it via ''Select elevation GeoTIFF'' and see how it mergens with the DTM | |||
Latest revision as of 14:27, 11 April 2024
Prerequisites
The following prerequisites should be met before starting this tutorial:
- This tutorial relies on base knowledge about the editor interface. If you have not yet followed the tutorials related to those subjects please do so first.
- This tutorial will include the creation of a new project.
Preparations
Take the following steps as preparation for following this tutorial:
- Download and unpack the content of this zip-file on your desktop for the necessary files: https://previewsupport.tygron.com/wiki/File:Tutorial_GeoData.zip
- Create a new project of Delft. For the exact location of the project, see the image below or use the project_location.geojson file (in the above zip-file) to define the project location. See this tip on our forum for more information on how to use the GeoJSON file for selecting the location.
Getting Started
In this tutorial you will learn the different ways to import different types of data in your project:
- data from Web services
- vector data
- 3D models
- raster data
Import data from Web services
In this section we are going to import data from a:
- WFS (Web Feature Service)
- WMS (Web Map Service)
- CSW (Catalogue Service)
WFS
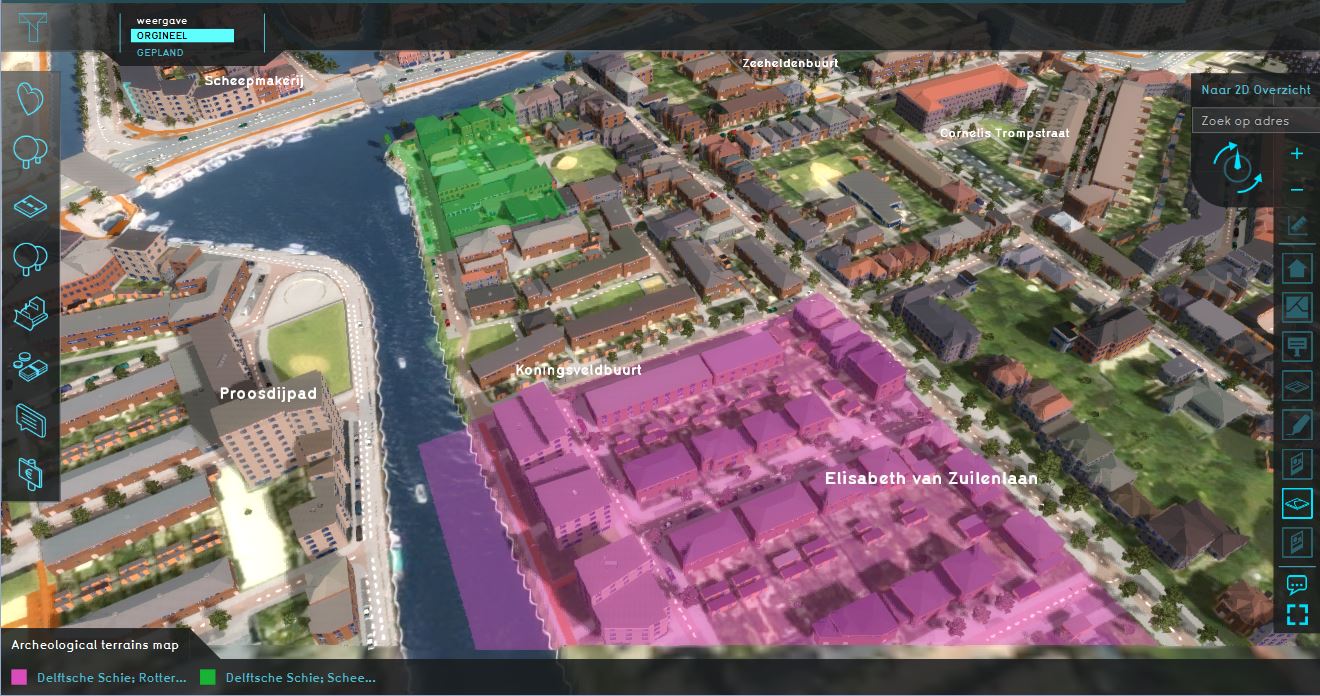
In this assignment you will create an Archeological Terrains Map.
- First read what exactly a Web Feature Service is.
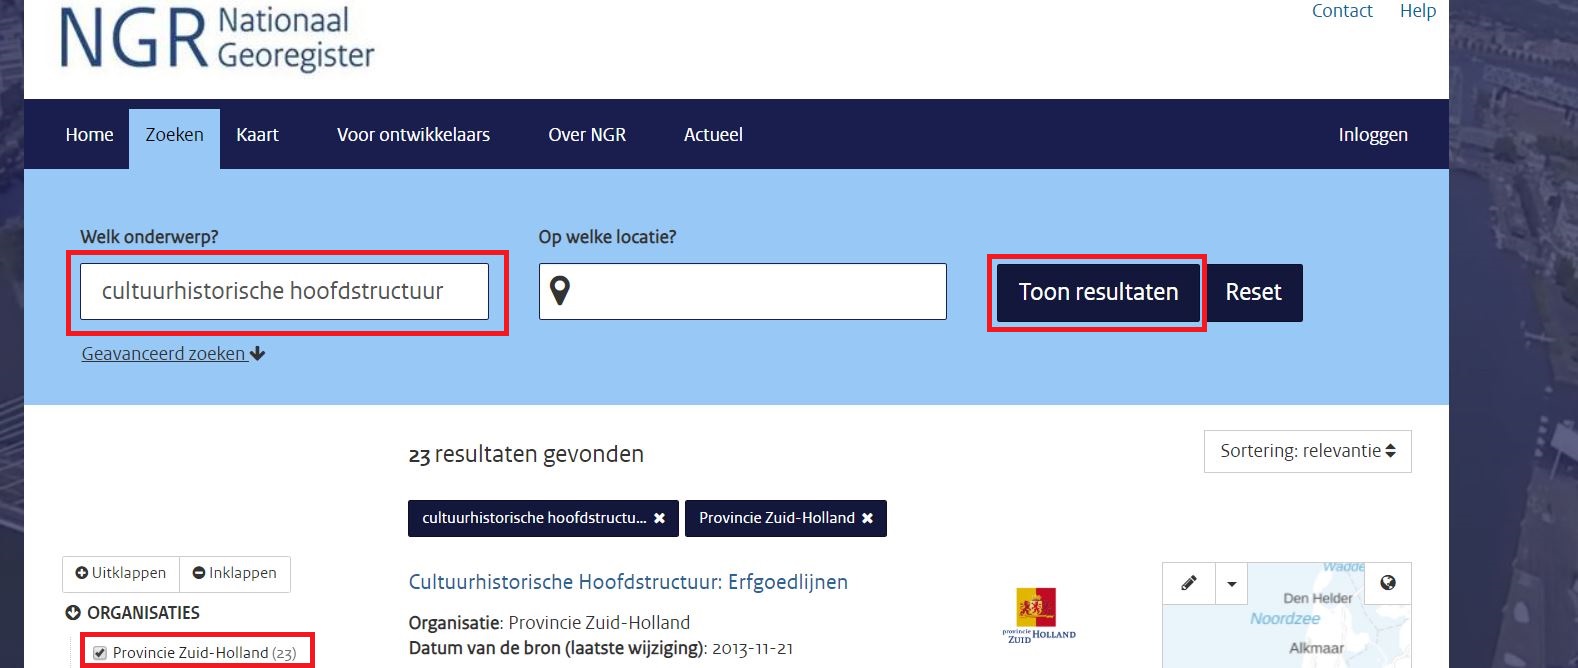
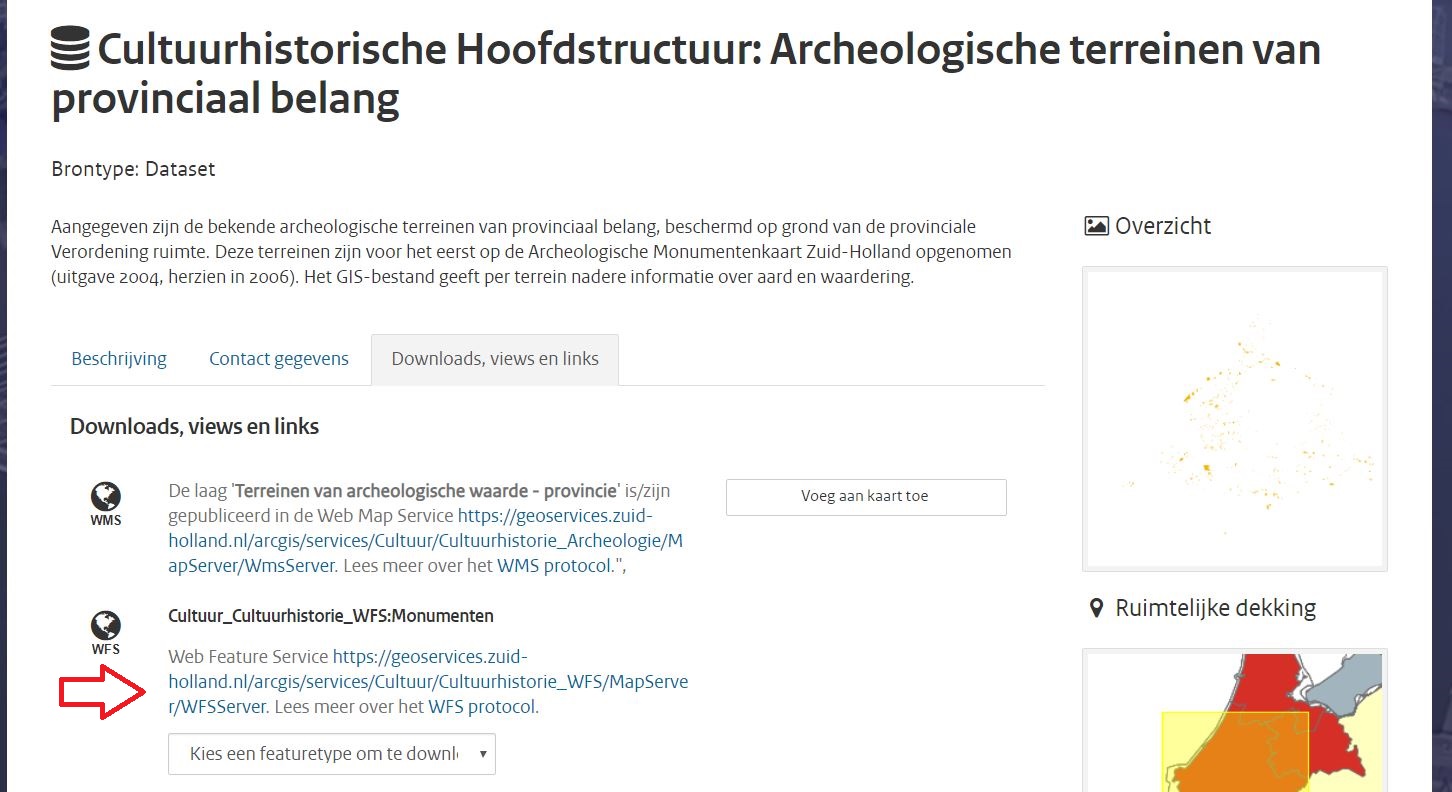
- Now we need to find data that is published as a WFS. For the Netherlands, a website to find open data is: Nationaal Georegister. Go to the Nationaal Georegister and search for theCultuurhistorische Hoofdstructuur: Archeologische terreinen van provinciaal belang dataset. Take a moment to read what this dataset is about. Then copy the WFS URL: this is the URL that contains WFS in the URL link.
- Start the Geo Data Wizard by clicking in the Editor on Geo import.
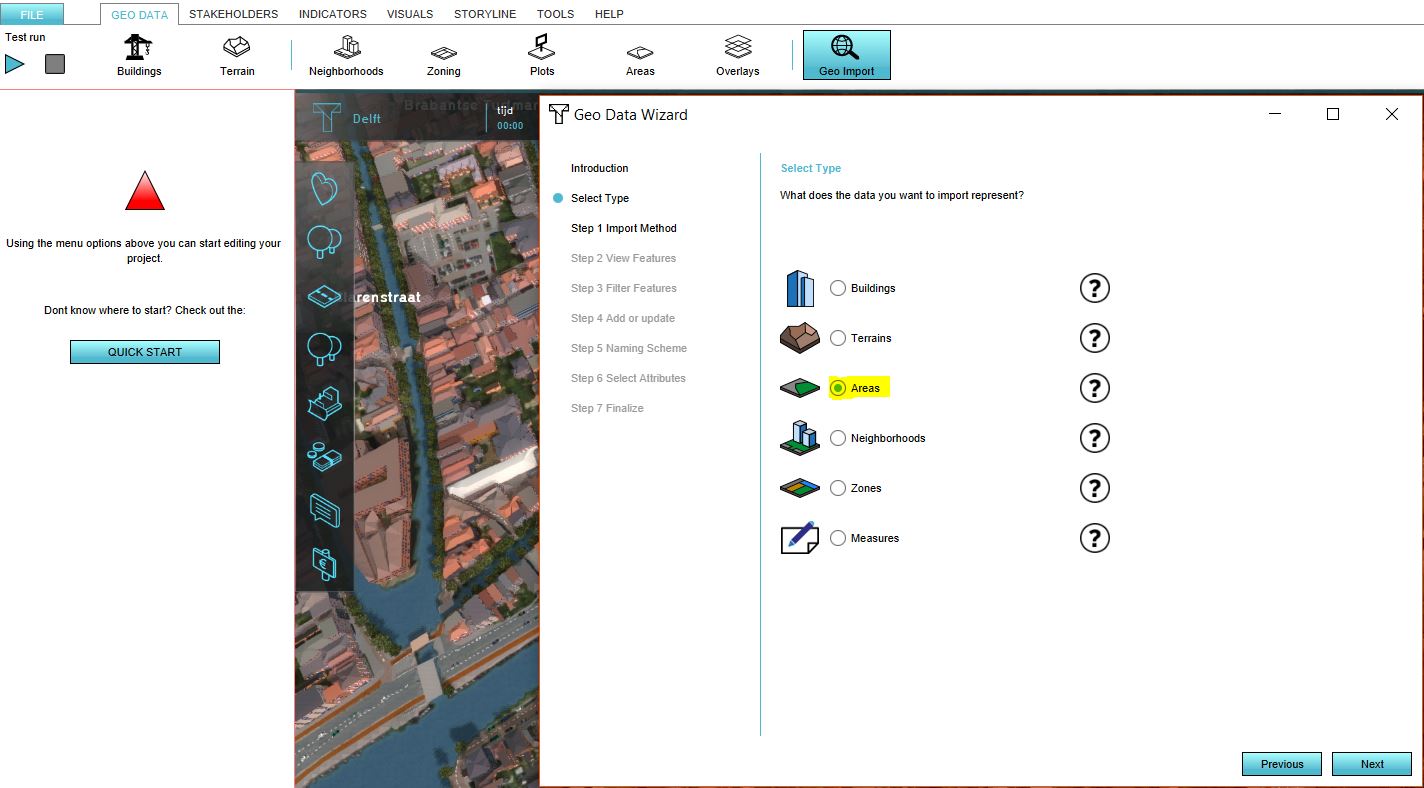
- Choose the correct type for importing the data. Since we are going to create a map which is equivalent to an overlay, choose as type: Areas. Read the Geo Data Wizard for more information about the differences between the import types.
- In step 1 of the wizard, choose for Import a Web Feature Service.
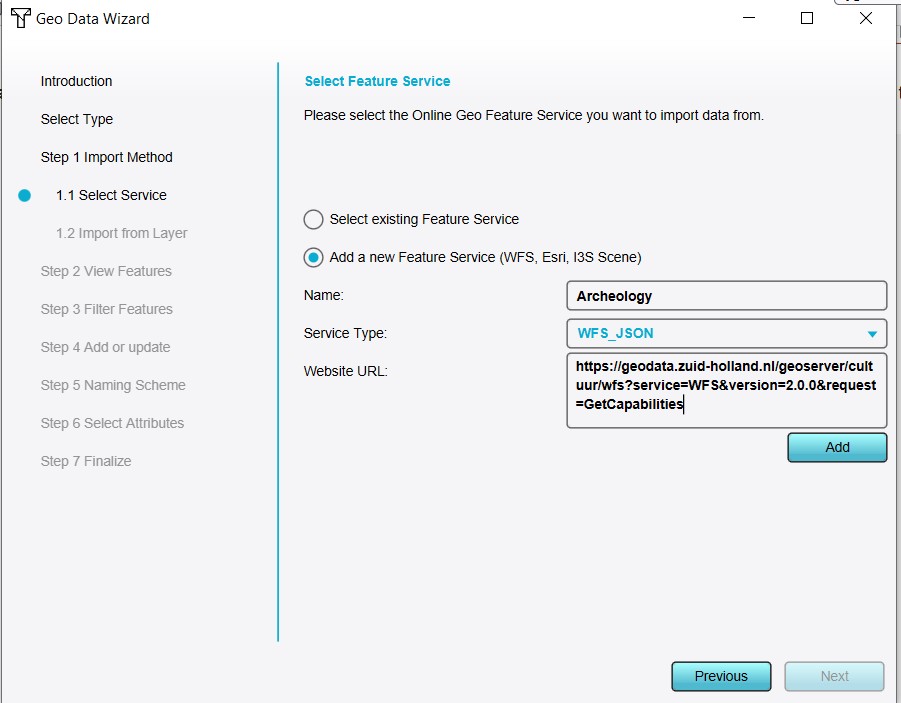
- Click on add a new Feature Service and provide a custom name, Service Type (WFS_JSON) and URL of the WFS. After you have entered this data, click on add and then next.
- In step 1.2 all the datasets that are published through this URL are shown (these are called layers). Choose from the drop down menu the layer: RCE_RIJKSMONUMENTEN_VLAK. If this dataset is not in your project, an error message is given. What could be a reason that the data is not in your project?
- In step 2 the location of the objects in your project area is shown. Click next.
- In step 3 we can filter the features and in step 4 adding as new areas or updating areas. Click 2 times on next.
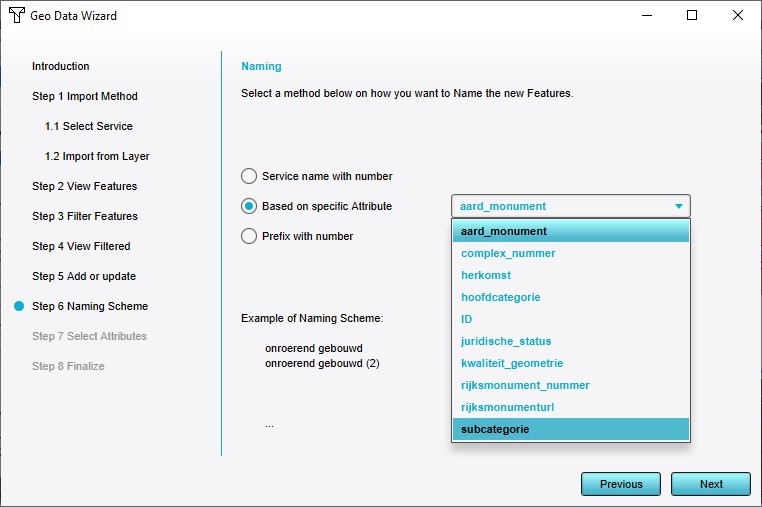
- In step 5 we name the features. Click on: Based on specific Attribute and choose for the attribute for example subcategorie. Now the features will be named after their sub category.
- In step 6 the attributes that will be imported are selected. Only numerical attributes are imported in the Tygron Platform. These are by default checked. Why is the list of attributes shorter than the list was in step 5? Click on next.
- In step 7 click on Finish. Now the Geo data wizard is finished and the data is imported.
Create an overlay
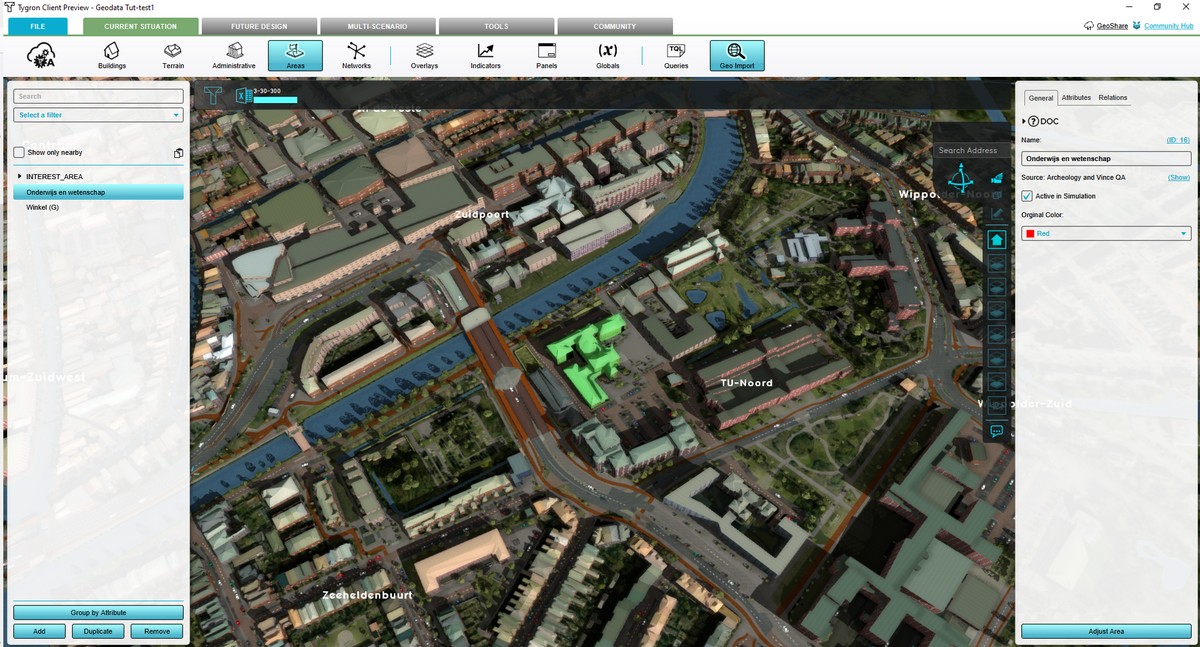
- In the Editor, go to Areas and notice that the areas you have imported are listed on the left side. Select one and notice that in the 3D Visualization the corresponding area is highlighted. In the tab Attributes on the right side of the screen, notice that the attributes are imported as well.
- Since we don't want to go by these areas one by one to see the archeological value areas, we are going to create a map so we can see them in one view.
Click therefore in the editor on overlays.
- Add a new overlay by clicking in the bottom left corner on Add Areas.
- Notice a new overlay, named: Speciaal gebied is added.
- Select this overlay and notice the new menu on the right side.
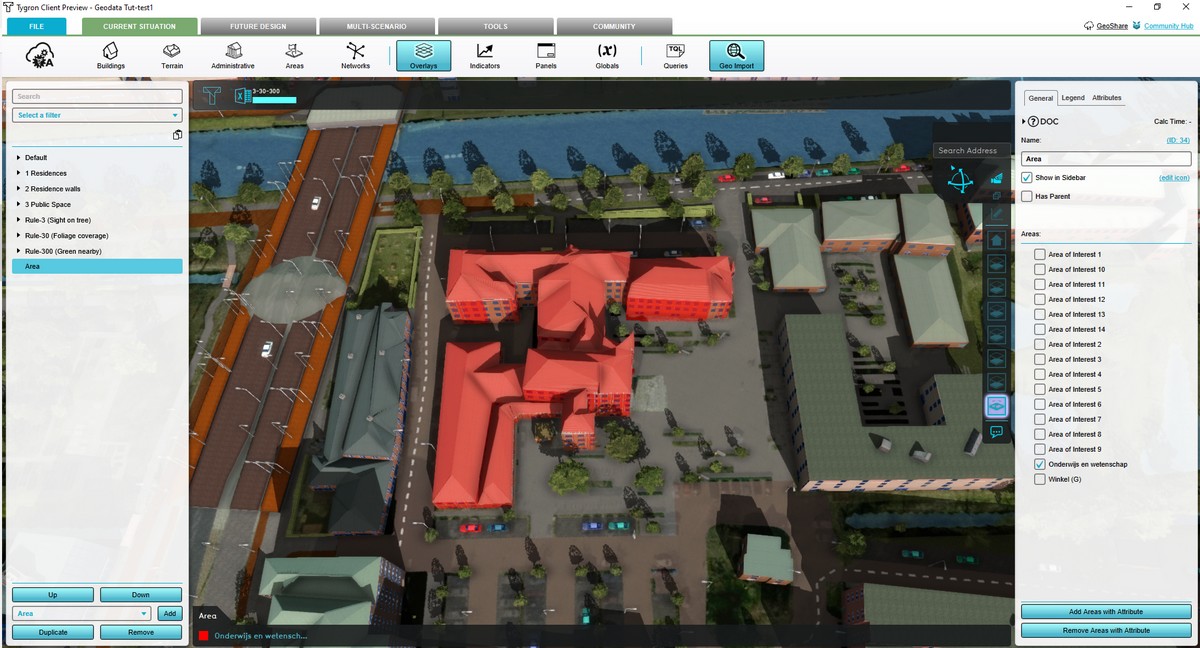
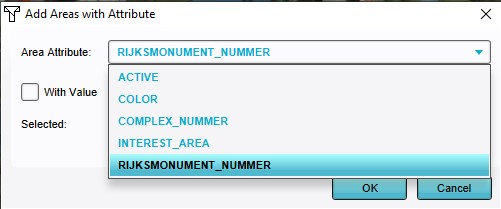
- Give the new overlay a fitting name and check the areas belonging to the archeological value map. If there are a lot of areas, you can also click on the button in the bottom right corner on Add Areas with Attribute. Here you can select a common attribute of these areas. Select the common attribute, for example RIJKSMONUMENT_NUMMER and click on Add.
WMS
In this assignment we will also create an Archeological Terrains map.
- Read first on the Wiki what a WMS exactly is.
- Add an Image overlay by hovering over the overlays button and choose the add Image overlay.
- Notice that a new overlay (named Beeldlaag) is added. Change on the right side the name and then open the Configuration Wizard.
- Select the second option: import from a Web Image Service
- Select Add a new Image Service and provide a custom name, Service Type (WMS_IMAGE) and URL of the WMS. If the data is filled in correctly, click on add and then Next. As WMS URL you can use the WMS url of the Cultuurhistorische Hoofdstructuur: Archeologische terreinen van provinciaal belang of the Nationaal Georegister from the previous assignment. The WMS url is the url with WMS in the link.
- Choose in the drop down menu the layer Terreinen van archeologische waarde - provincie and click Next.
- In the following steps, proceed with Next and then Finish.
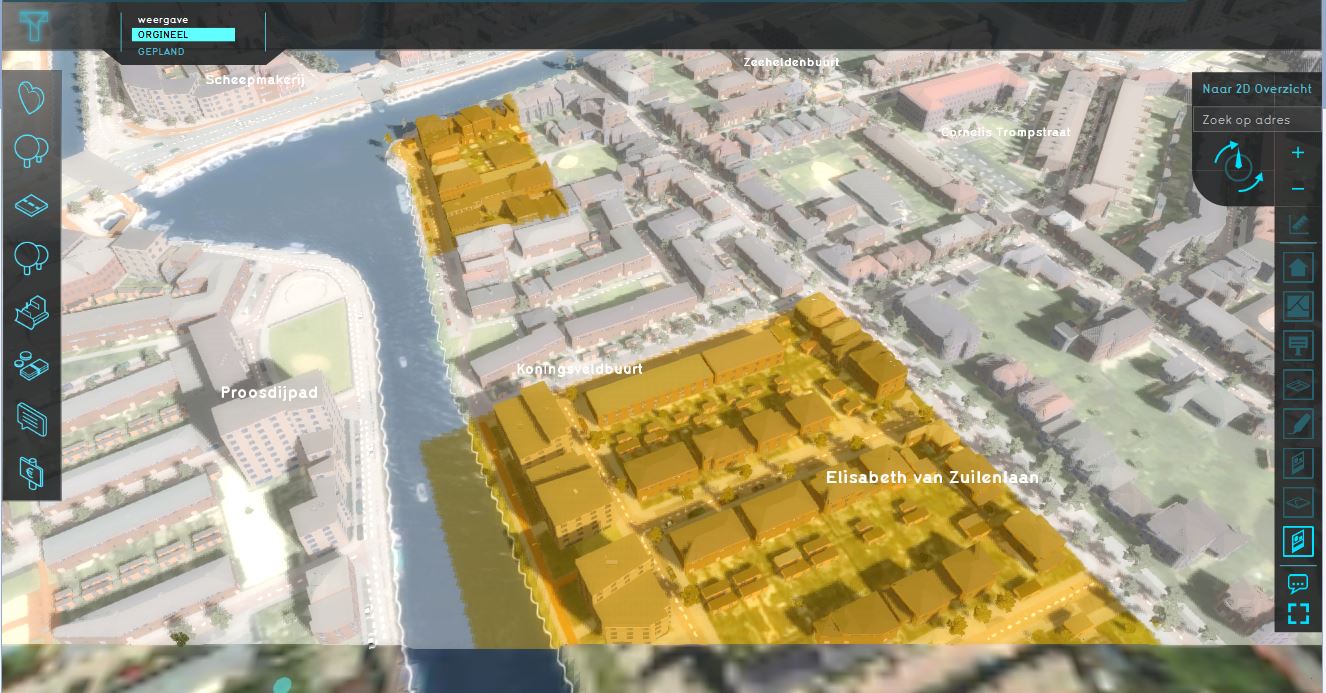
- After you have finished the wizard and given the overlay a proper name, can you tell the difference between the WFS and the WMS data? If not, click on the colored areas in both maps (WFS and WMS). Do you see a difference in the information in the hover panel?
Catalogue Service
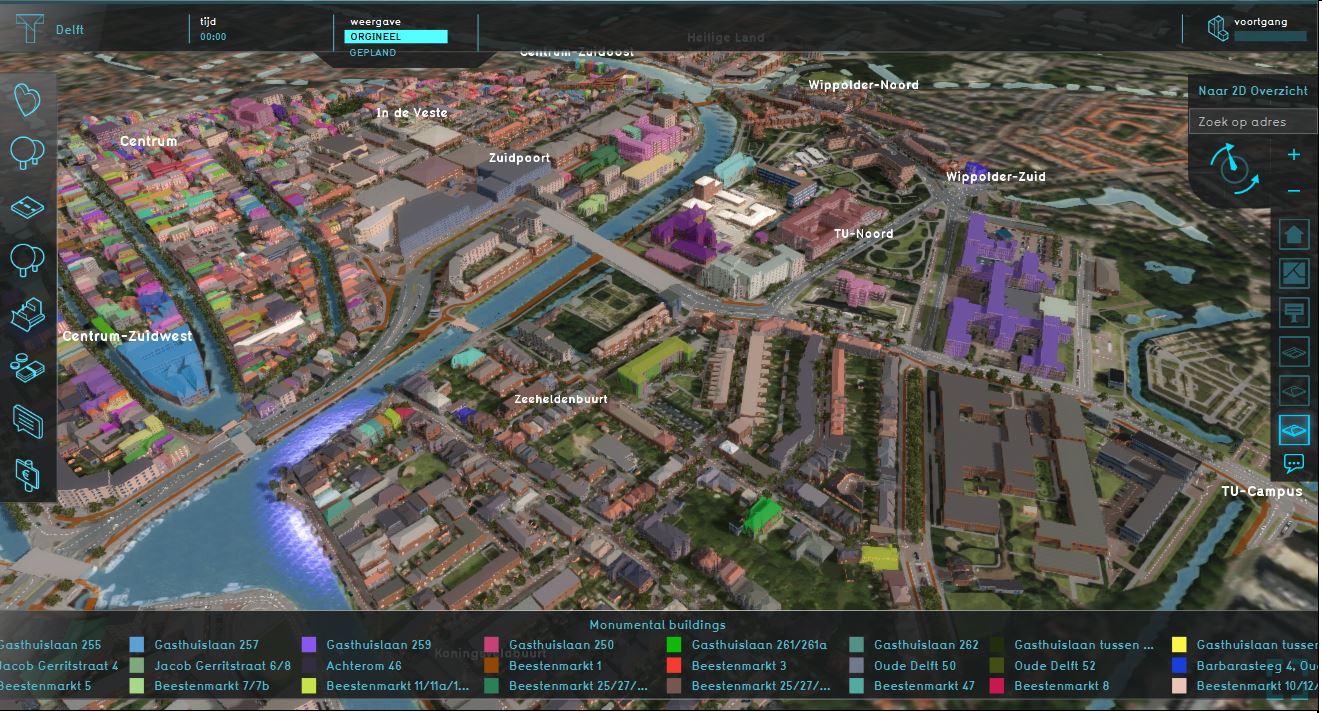
In this step we are going to create a map (overlay) of all the monumental buildings in Delft.
- Start by reading what a CSW exactly is.
- Open the Geo Data wizard and choose for type AREAS.
- In step 1 of the wizard, choose for: Search for data in a Catalog Service.
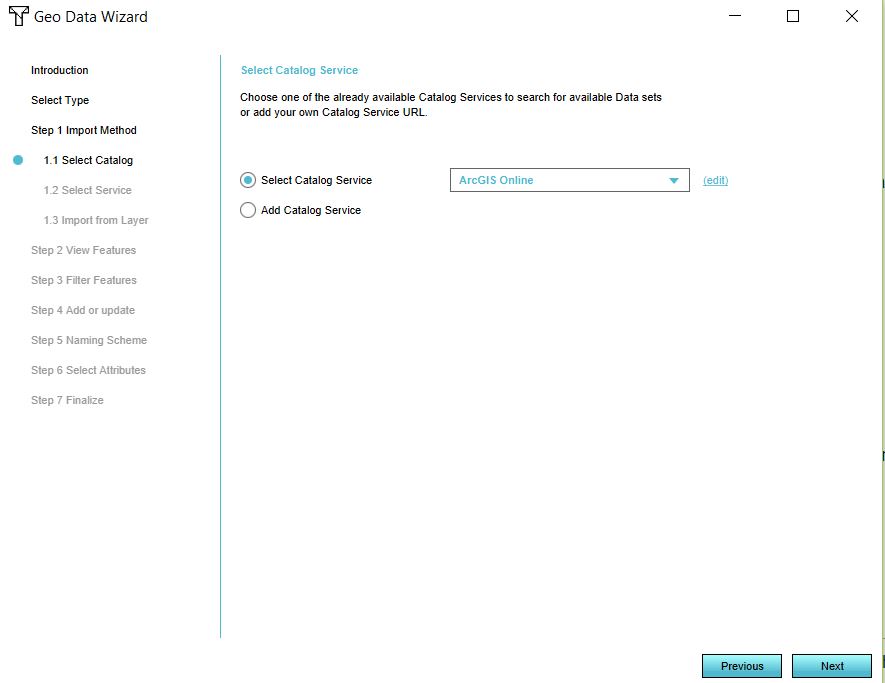
- Click on Select Catalog Service and choose ArcGIS online.
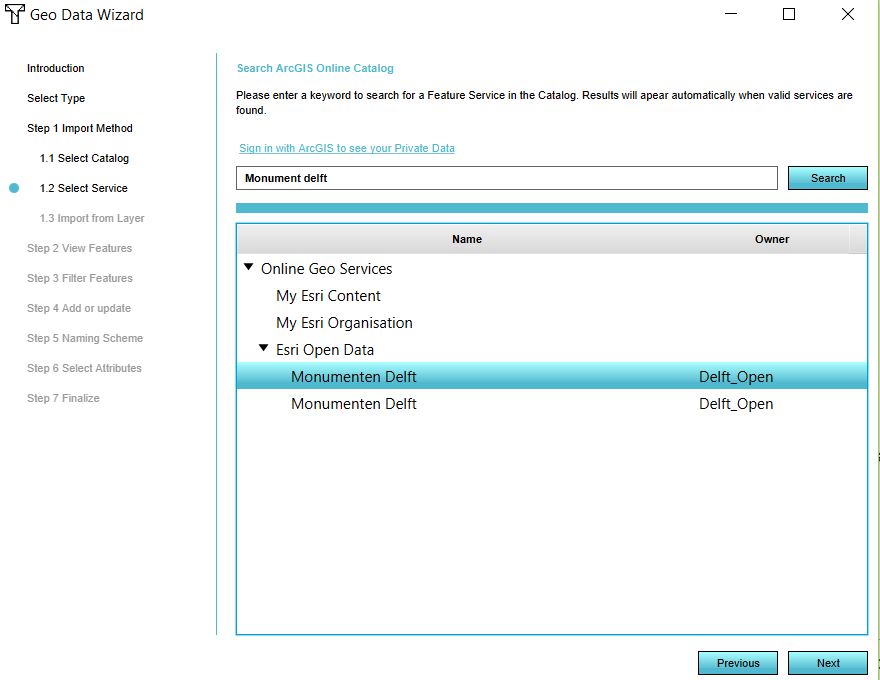
- In the next screen you can type a keyword of the dataset you want to find. We are going to create a map of the monumental buildings in Delft. Think of a correct keyword to type and click on Search. Remember the project owner of the data should match the location of your project. Why is that?
- Complete the wizard. Don't forget in step 5 to choose the correct attribute to base the name on.
- Follow the previous steps for creating an Overlay.
- Now your map of Monumental Buildings is finished.
Import vector data
In this section we are going to import vector data from a file. To import data in the Tygron Platform, the file must be of the GeoJSON format.
In the next assignment we are going to import two fictional datasets as objects in the 3D model. One dataset contains a spatial plan with a road, an office, parking space and a park. The other dataset contains trees.
Office plan
- Read this section on the Wiki of what exactly a GeoJSON file is.
- Mostly data is not available as a GeoJSON but for example as a Shapefile. We can create a GeoJSON file ourselves with a GIS.
- In the zip folder you downloaded at the start of this tutorial are two .shp files. These are Shapefiles. Follow the steps to create a GeoJSON file in you preferred GIS. You can skip the part of modifying the attributes.
- After you have created the two GeoJSON files, open the Geo Data Wizard.
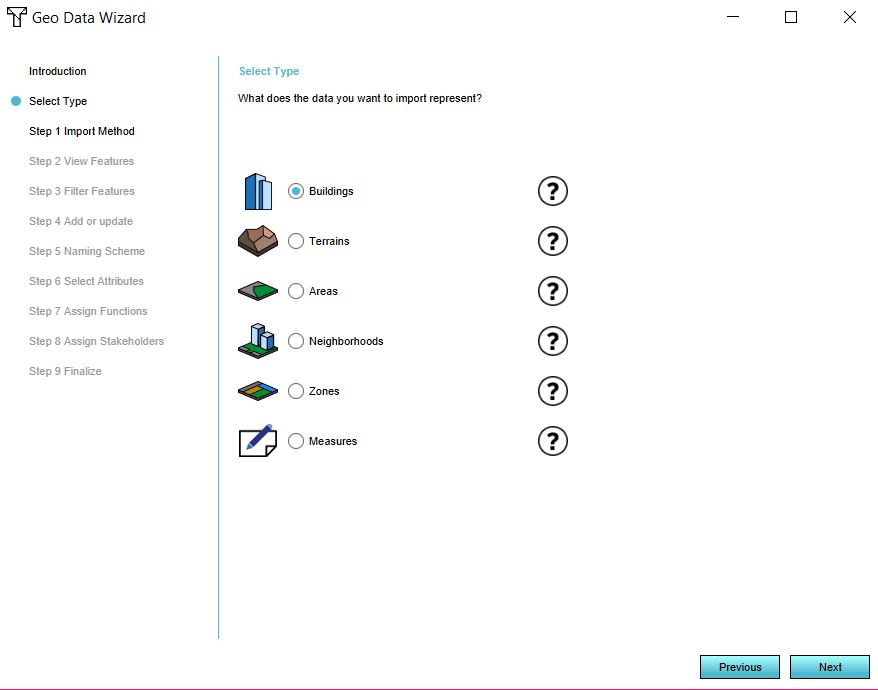
- Select as type Buildings.
- Select in step 1 Import a GeoJSON file and choose the file: Office in the next step.
- Click on Next in the following steps, choosing consequently the first option. In step 5 choose the correct column for the naming of the objects.
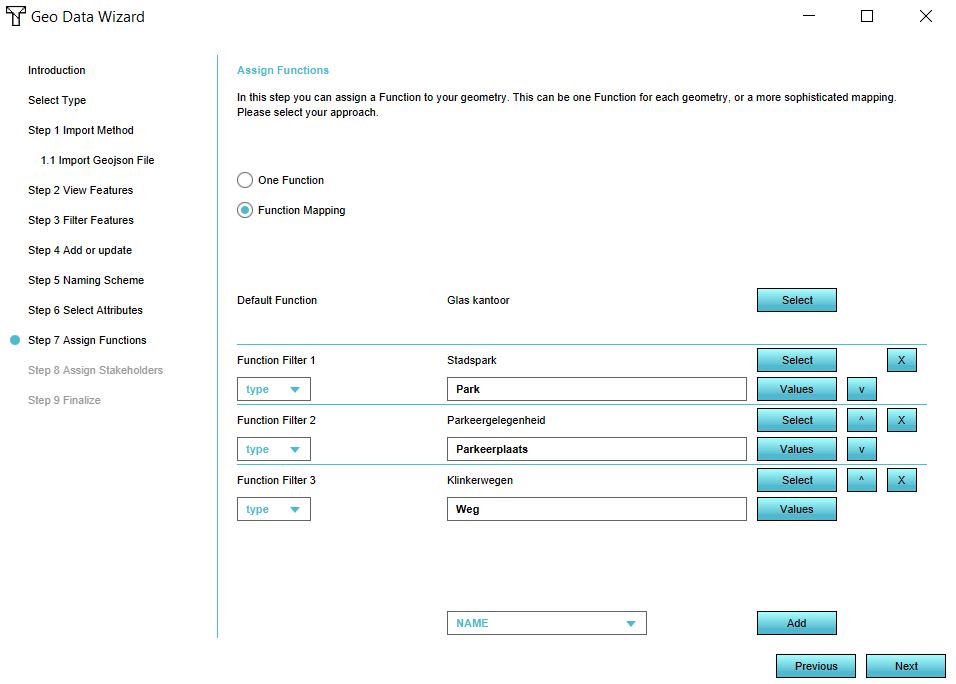
- In step 7 we see a new step that we did not come across when choosing to import data as AREAS. In this step you decide what kind of 3D object the data will be. Click on One Function if your dataset only consists of data of one type, for example a dataset with only buildings or only roads. If you have a file like we do with an office, road, parking space and building, choose Function Mapping.
- Choose first the default function by clicking on Select. For this tutorial we choose as default function a function in the category Offices.
- Then make sure the drop down menu is on Name and click on Add. Choose for the Function fFlter 1 the Type column. Now check the other function box and click on Values. Based on the data in the column Type, you can select a function. Select for example Park, click on Ok (the screen closes) en click on the button Select. Choose from the Function list a park function.
- Repeat the previous steps for the attributes Parkeerplaats and Weg. We are now creating rules to base the mapping on. We do not have to create rules for every attribute, since we have set a default function. Think of what would happen if we had another feature in our dataset with for example Type:School.
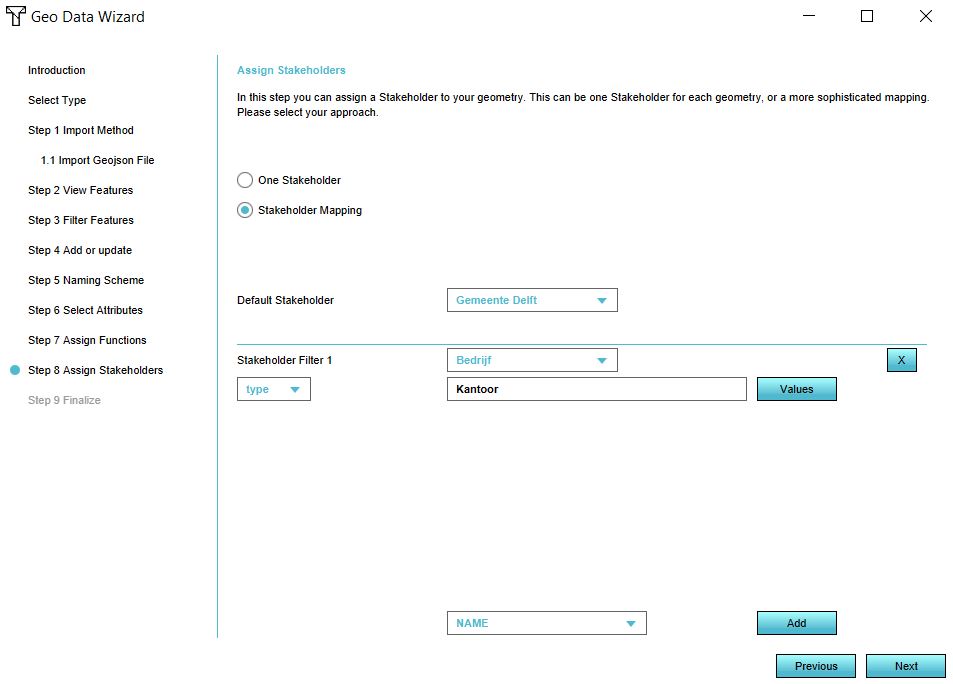
- Click on Next. In step 8 we can also create a mapping for the Stakeholders. For example, we can assign the roads, park and parking space to the municipality and the office to the company stakeholder. The mapping is done in the same way as step 7. Create a mapping with at least two stakeholders.
- Finish the wizard.
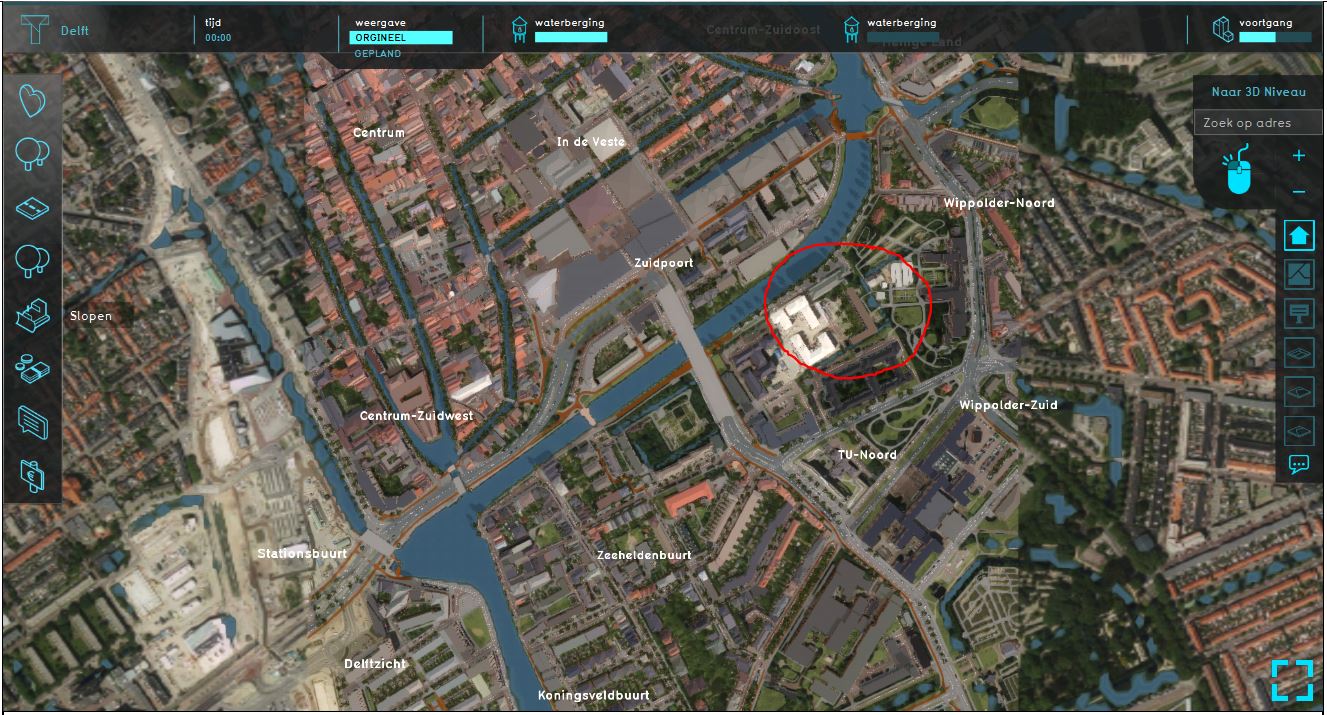
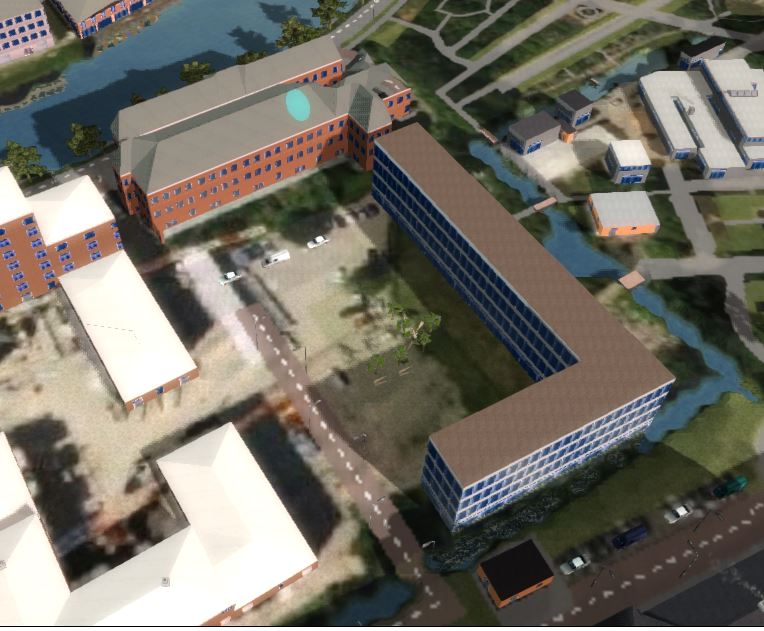
- Notice the new buildings are now in the 3D model
Tree dataset
- Import the other dataset trees by repeating the previous steps for importing a GeoJSON file.
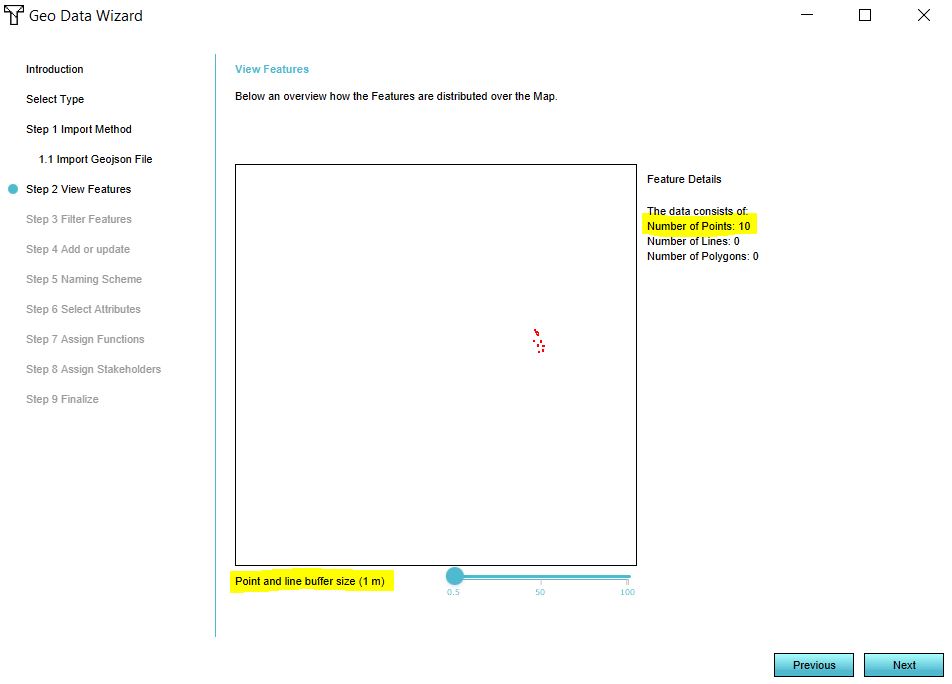
- In step 2 of the wizard, notice that there are 10 points in the datset and no lines or polygons. In the Tygron Platform it is only possible to import polygons. Therefore, we can buffer the points to create (round polygons) for the trees. Set the buffer size on 1, so as not to create very large trunks and follow the rest of the wizard.
- How would you do the mapping in step 7? As One Function or a Function Mapping?
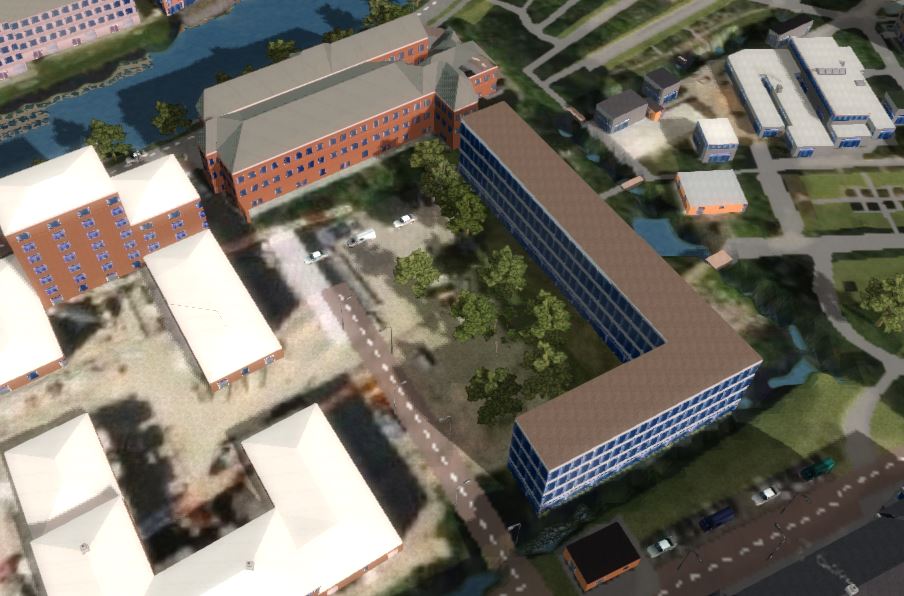
- After finishing the wizard, notice the new trees in the office location area.
Importing a 3D model
In the following steps we will replace the previous imported office building with a simple 3D model of a fictional office building.
- There are a lot of formats for 3D models. In the Tygron Platform we use the I3S format for importing 3D models. Read here more about this format.
- Open the Geo Data wizard and choose Buildings.
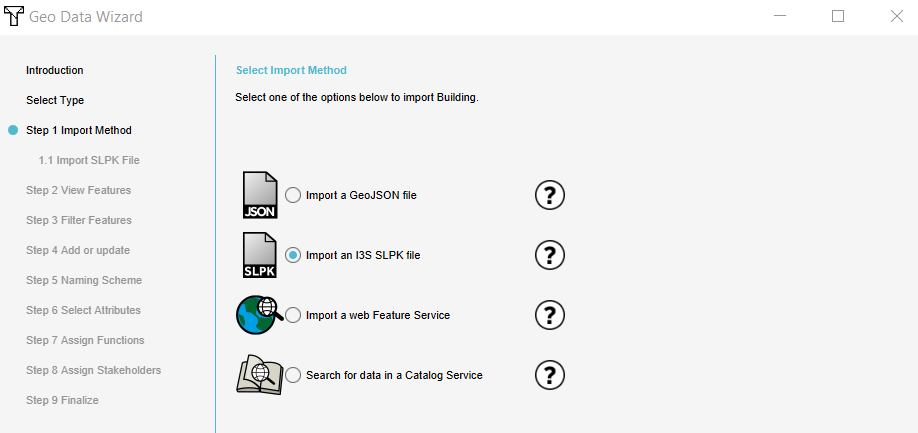
- Choose in step 1 the option import an I3S SLPK file and choose in the next step the office_building.slpk file. The originally 3D CAD building model (in DWG file format) was transformed to an SLPK file. For more information on how to create an SLPK file from different 3D file formats, consult How to create an SLPK file.
4. Proceed with Next until step 4. In step 4, choose the first option to Update the 3D model of existing buildings. Now only the model will be updated, but the building will have the same function and attributes.

5. Finish the wizard and notice the updated office building.
-
3D CAD building
-
Building imported in the Tygron Platform
See also the Demo San Francisco project for a project of San Francisco generated from, among others, I3S Scene Layer data.
Importing raster data
For this part of the tutorial we use the ready prepared GeoTIFF Kd_Delft.tif. This file contains a selection of the layer doorlatendheid_laag 1 from the Hydrological Instrument. They layer represents classes of hydraulic conductivity of the freatic groundwater layer; the ability of the layer to transport groundwater, in m2/day:
| class in GeoTIFF | kd [m2/day] |
|---|---|
| 2 | 5-10 |
| 3 | 10-20 |
| 4 | 20-30 |
| 5 | 30-40 |
| 6 | 40-60 |
| 7 | 60-80 |
| 8 | 80-100 |
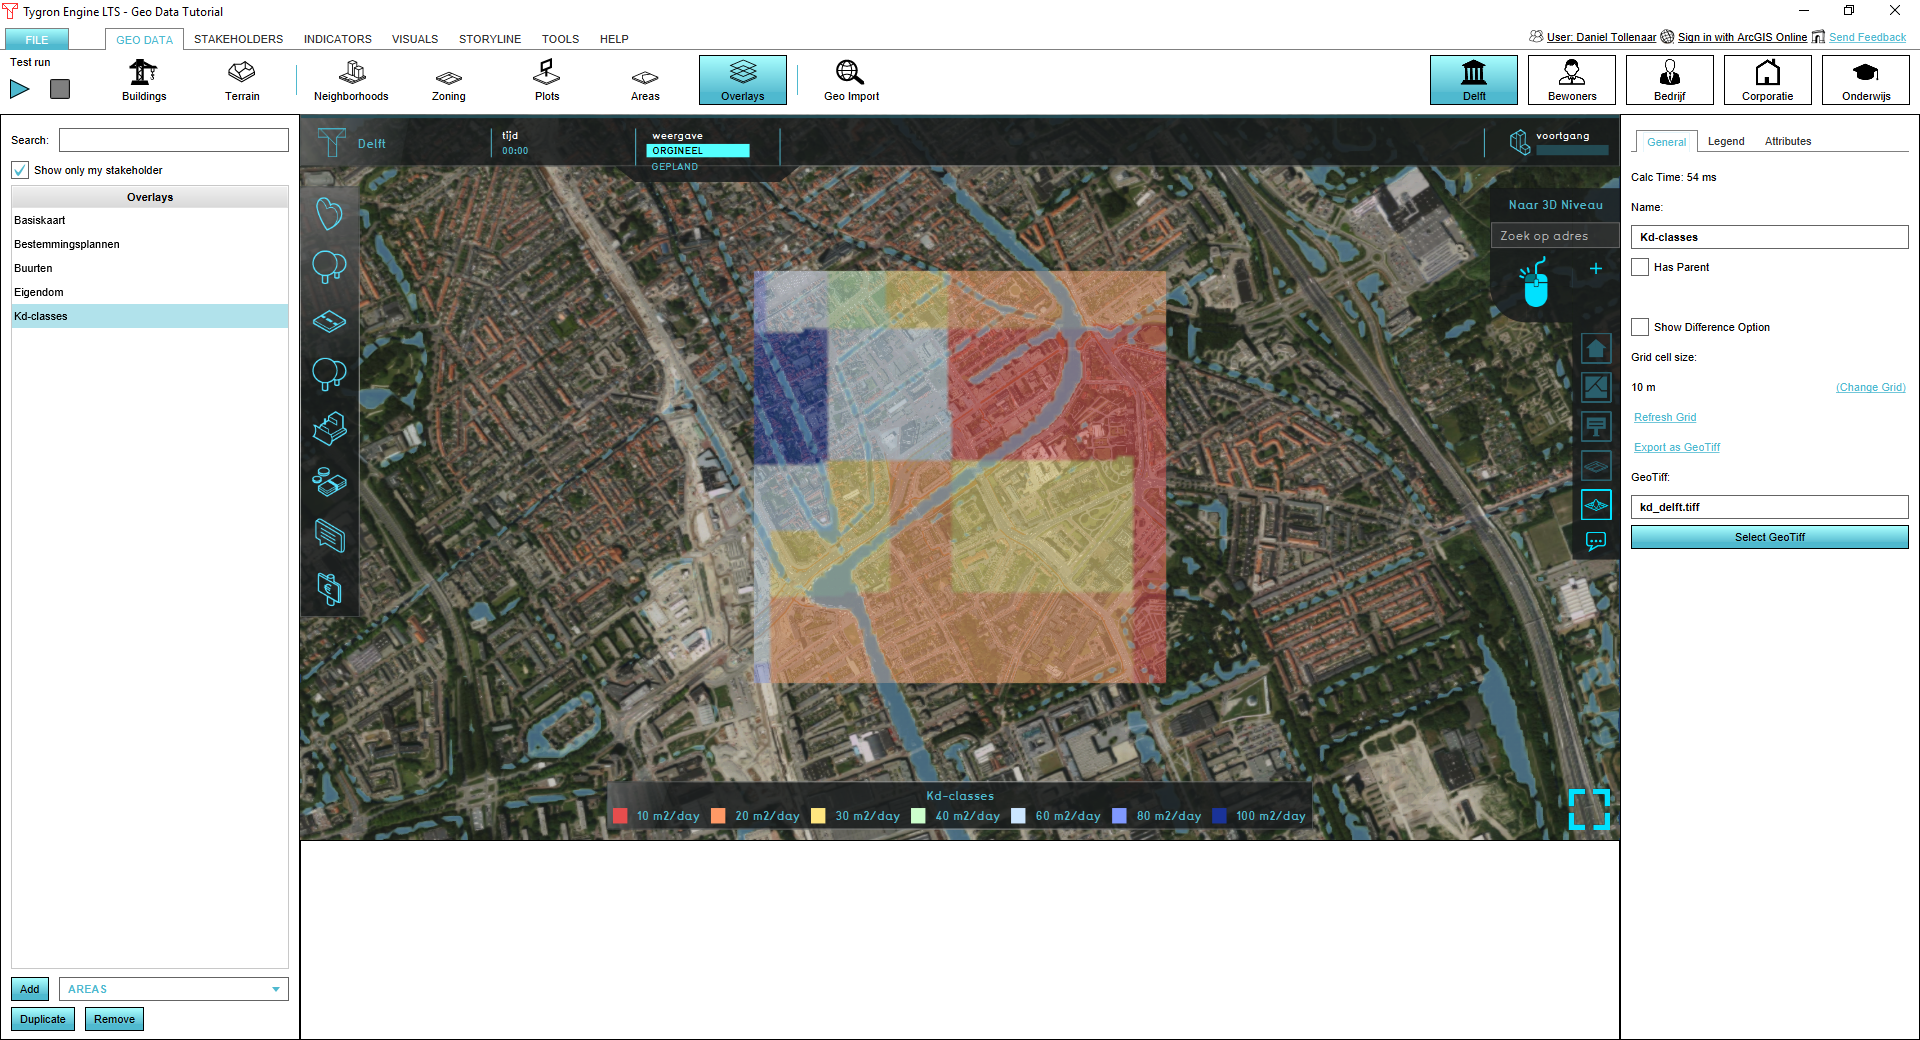
If you finish the tutorial, the result should be as the picture below:
Creating a GeoTIFF Overlay
Go to:
and select Add Geo Tiff.
Add the GeoTIFF Kd_Delft.tif in the following steps:
- In the general-tab press Select GeoTIFF
- In the GeoTIFF Import Wizard, press Import new Geo Tiffsin the bottom-right
- Locate Kd_Delft.tif and press Open
- Make sure your newly imported GeoTIFF is selcted and press Apply
In the general-tab GeoTIFF: should refer to Kd_Delft.tif. Now add a legend:
- go to the legend tab
- create a legend with the 7 classes as above, by:
- checking Has Custom Legend
- adding 7 records (or removing if you have to many)
- adding values, descriptions and colors starting from the lowest record
- if finished, go to the general-tab and press refresh grid
You should arrive at the overlay as shown in the picture above. Please check the following:
- open Kd_Delft.tif in a GIS-editor (e.g. QGIS); review the presence of a NoData value and projection. If these are not present, the file will not be imported(!!)
- open the GeoTIFF Import Wizard and notice the option overwrite CRS. If your GeoTIFF does not contain projection info, you can use this option to specify a CRS (Coordinate Reference System). If the Tygron Platform has trouble projecting your projected GeoTIFF on the map, you can also use this option to overwrite the existing CRS.
Changing a DEM
For the purpose of this exercise, we will change the DEM with the Kd_delft.tiff, previously imported. Note, it doesn't make sense to do so, but it is just for the purpose of the exercise.
Note, if you change your DEM, you will loose the original DTM. Go To:
And the Heightmap Overlay. Then:
- change the grid-cell size to 1m
- select DTM (where you will not see the elevation of houses)
- export the DTM as a GeoTIFF
Now we will import a different DEM. Go to:
And do the following:
- Select Select elevation GeoTIFF
- Select kd_delft.tiff
- Press apply
The DTM should look as below:
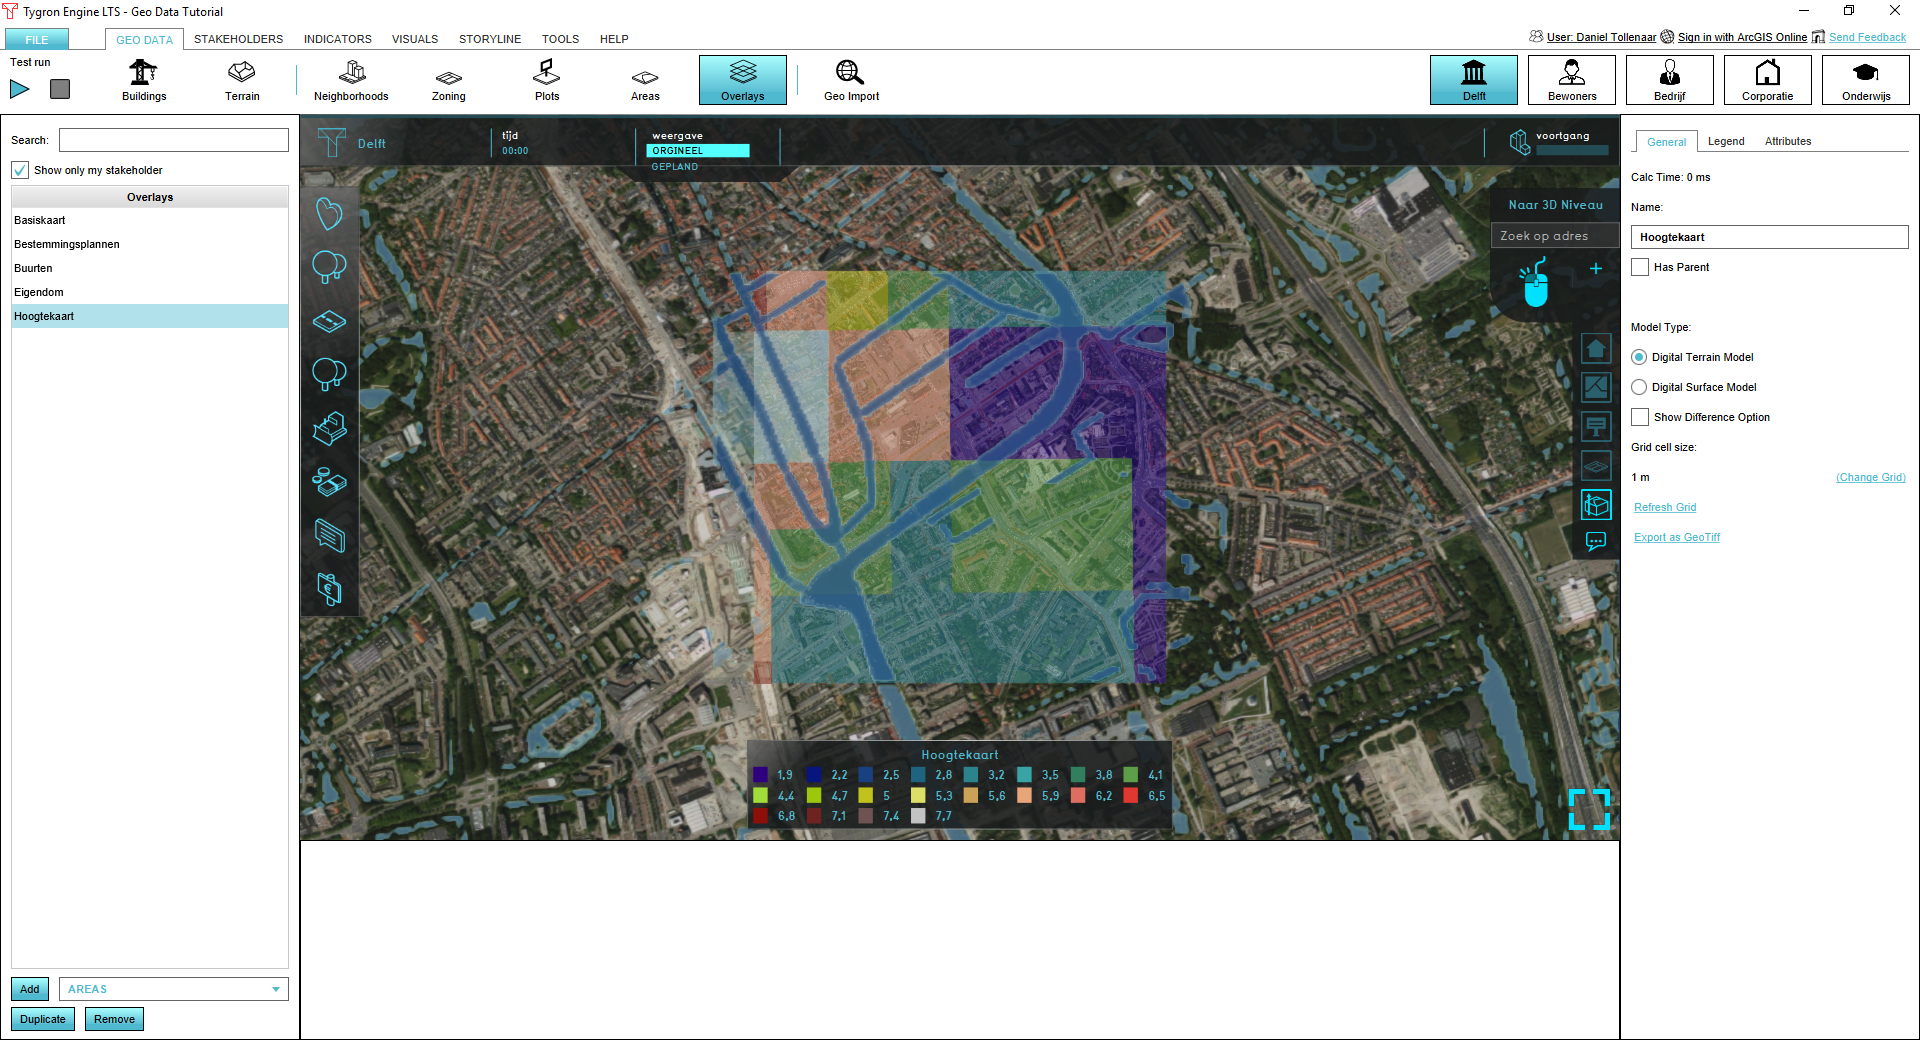
Now:
- revert the DTM to the elevation model to its original state by re-importing the DEM you previously exported
- make a GeoTIFF in QGIS covering a part of the project area, import it via Select elevation GeoTIFF and see how it mergens with the DTM
