MKP (Indicators): Difference between revisions
| Line 9: | Line 9: | ||
The province has developed specific instruments that can help municipalities in Utrecht to support the municipalities with their spatial planning. One of these instruments in recent years was the ‘Leidraad Water en Milieu in Ruimtelijk plannen’ ("Water and Environment Guidelines in Spatial Planning"). The core of this guideline are the Environmental Quality Models, in which the area-specific environmental and sustainability ambitions of the province are laid down. These Environmental Quality Models consist of twenty environmental and sustainability aspects, such as energy consumption, renewable energy generation, water safety, noise nuisance, air quality, but also for example accessibility of public transport. | The province has developed specific instruments that can help municipalities in Utrecht to support the municipalities with their spatial planning. One of these instruments in recent years was the ‘Leidraad Water en Milieu in Ruimtelijk plannen’ ("Water and Environment Guidelines in Spatial Planning"). The core of this guideline are the Environmental Quality Models, in which the area-specific environmental and sustainability ambitions of the province are laid down. These Environmental Quality Models consist of twenty environmental and sustainability aspects, such as energy consumption, renewable energy generation, water safety, noise nuisance, air quality, but also for example accessibility of public transport. | ||
For more information and to download the Guideline | For more information and to download the Guideline see the [https://www.provincie-utrecht.nl/onderwerpen/alle-onderwerpen/samen-werken-milieu/gebiedsgerichte/ webpage of the Provincie Utrecht]. | ||
==Score system== | ==Score system== | ||
Revision as of 17:40, 26 April 2019
General
The MKP stands for MileuKwaliteitsProfielen or in English: Environmental Quality Models. They are created by the Province of Utrecht (Provincie Utrecht), located in the Netherlands. Thy used these models to describe what is meant by a good environmental quality of the environment for different types of areas. This quality is determined by a large number of themes, including the amount of green in the neighborhood, noise pollution and air quality. The themes have been translated to formulas, with which a score is calculated. The score provides insight into the current quality of the environment. Ultimately, the MKP can be used to test area development against a high quality of the environment.
Theory
The province of Utrecht is committed to a healthy environment. That is why the province strives for optimum environmental quality and sustainability when developing spatial plans. To facilitate these spatial developments, the province uses an area-specific approach. Every area has its own characteristics, qualities and wishes. To the different areas belong likewise different environmental qualities. For example, the limit for "noise pollution" in an industrial area is higher than in a residential area.
The province has developed specific instruments that can help municipalities in Utrecht to support the municipalities with their spatial planning. One of these instruments in recent years was the ‘Leidraad Water en Milieu in Ruimtelijk plannen’ ("Water and Environment Guidelines in Spatial Planning"). The core of this guideline are the Environmental Quality Models, in which the area-specific environmental and sustainability ambitions of the province are laid down. These Environmental Quality Models consist of twenty environmental and sustainability aspects, such as energy consumption, renewable energy generation, water safety, noise nuisance, air quality, but also for example accessibility of public transport.
For more information and to download the Guideline see the webpage of the Provincie Utrecht.
Score system
The MKP works with scores: each area and each spatial plan is assessed on the extent to which it meets the various environmental and sustainability aspects. This assessment results in a score between 1 and 10 per aspect and is calculated by specific formulas. In addition, three ambition levels are described for each aspect:
- Minimum quality (score 6); this is the lowest, often legally (in the Netherlands) required quality level that must always be met. This quality does not meet the standards of the World Health Organization.
- Basic quality (score 8); this is the quality level that is considered suitable for the area in question. This is a (substantially) higher quality level than the legal minimum.
- Optimal quality (score 10); this is the quality level that is considered to be attainable for the area concerned.
Overview of indicators and area types
The Environmental Quality Models consist of up to 20 indicators to assess the built environment. The following table shows the different type of areas the Province of Utrecht defined, with their corresponding value for the Tygron Platform to know which area it is:
| Area | Value |
|---|---|
| City center/centrum | 1 |
| Outside center/Buiten-centrum | 2 |
| Green urban/Groen stedelijk | 3 |
| Green urban/Groen stedelijk | 3 |
| Village center/Centrum dorps | 4 |
| Industry/Industrie | 5 |
| Businesses area/Bedrijven | 6 |
| Offices and public-intensive facilities/Kantoren en publieksintensieve voorzieningen | 7 |
| Rural area: urban lead-out area/Landelijk gebied: stedelijk uitloopgebied | 8 |
| Rural area: agricultural/Landelijk gebied: agrarisch | 9 |
| Rural area: interweaving of functions/Landelijk gebied: verweving van functies | 10 |
| Rural area: main function nature/Landelijk gebied: hoofdfunctie natuur | 11 |
Additional configurations
For the indicator to function, the different area types have to be added to the project. Alternatively, the already existing Neighborhoods in the project can be used as area mapping, if the neighborhoods can be clearly distinguished on functions from one another. For example, if in a neighborhood is mostly industry and another neighborhood is mostly residential, the neighborhoods can be used as area types. If a neighborhood contains industry, houses and also agricultural areas, the neighborhood is not easily translated to one area type. In this case it would be better to define new areas. See below for the steps.
Option 1: Add new areas
The indicator looks only at the Areas with the attribute GEBIED_N and the corresponding value for the type of area. See above for the list of area types and the corresponding values. There are two ways to add these areas. One is by creating a file in a GIS and the other option is by manually adding and drawing the areas.
- Create in a GIS a GeoJSON file with the areas and the corresponding attribute: GEBIED_N and the values.
- Import the Area file with the Geo data wizard.
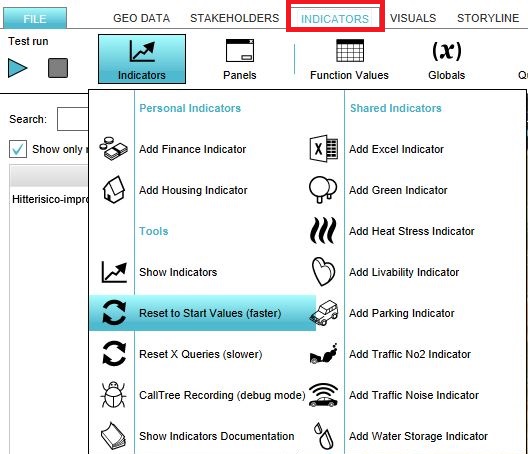
- Click on the tab Indicators and the button Indicators and choose for Reset X Queries (slower) to update your project.
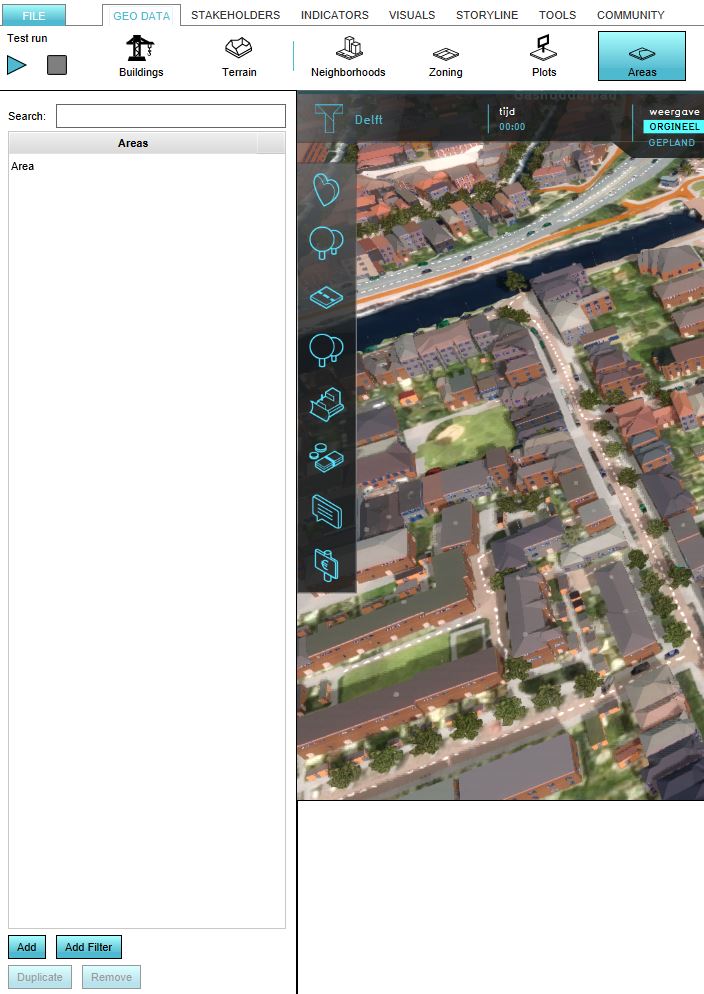
- Select Geo data and then Areas in the ribbon header
- Add a new Area, by clicking on the button Add in the left bottom corner.
- Select the newly created area and in the right panel give it a fitting name
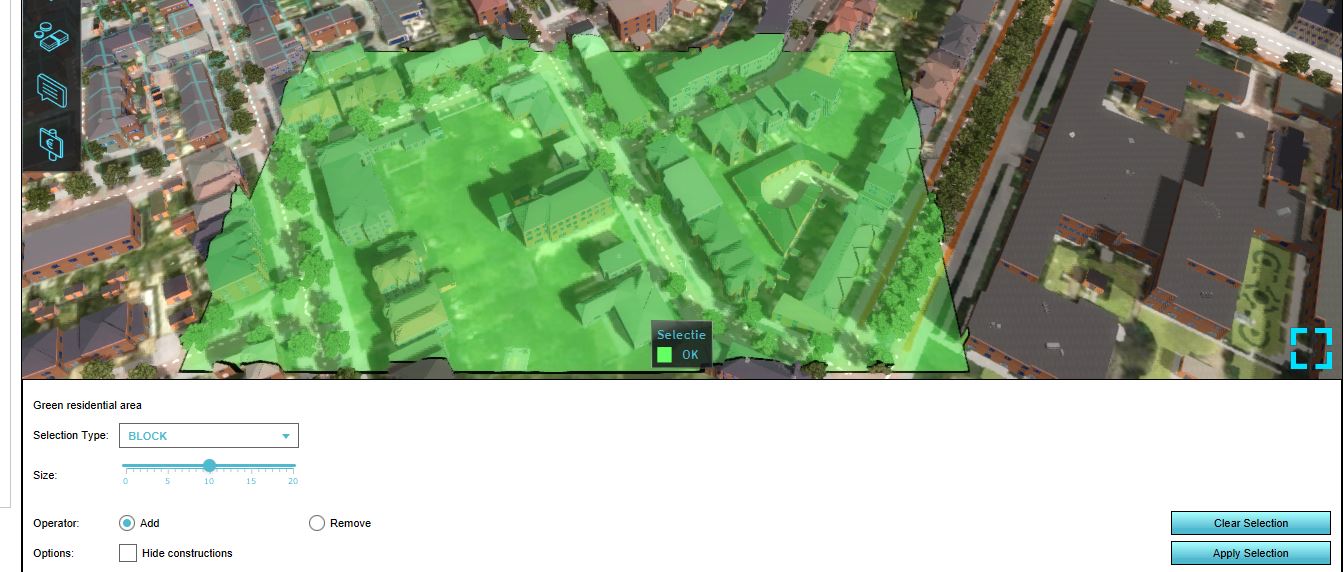
- Click on Adjust Area in the right bottom corner.
- Draw the area in the 3D world and click on Apply Selection
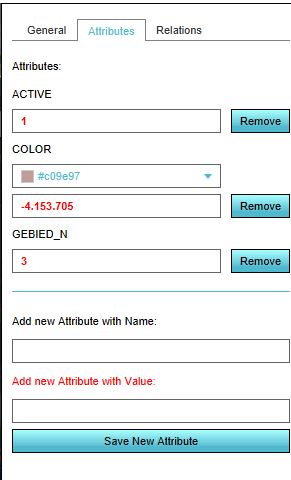
- Click in the right panel on the Attributes tab.
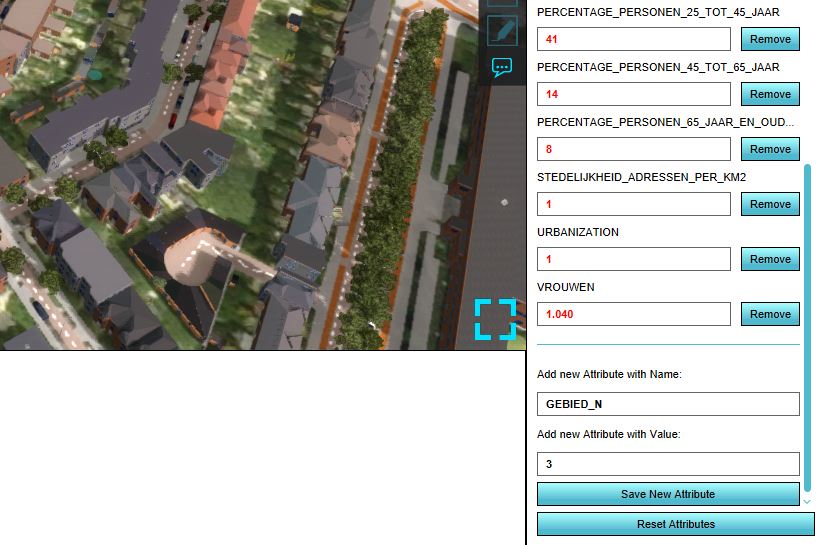
- Scroll down to the bottom and enter the Attribute name GEBIED_N with the value corresponding with the type of area.
- Click on Save new attribute. The attribute is now added to the the other attributes.
- Repeat the steps 1- 8 for other area types.
- Click on the tab Indicators and the button Indicators and choose for Reset X Queries (slower) to update your project.
Option 2: Use the Neighborhoods
If applicable, the Neighborhoods can be used to define the areas. Onlywith the attribute GEBIED_N and the corresponding value for the type of area has to be added to the neighborhoods. See above for the list of area types and the corresponding values.
- Select Geo data and then Neighborhoods in the ribbon header
- Select a Neighborhood in the left panel
- In the right panel, go to the tab Attributes.
- Scroll down to the bottom and enter the Attribute name GEBIED_N with the value corresponding with the type of area it represents.
- Click on Save new attribute. The attribute is now added.
- Click on the tab Indicators and the button Indicators and choose for Reset to Start values (faster) to update your project.
