Data preparation: Difference between revisions
No edit summary |
|||
| Line 12: | Line 12: | ||
See below for the steps: | See below for the steps: | ||
{{editor steps|title=create a mapping from text to numerical attributes| Open the dataset in a GIS| Open the | {{editor steps|title=create a mapping from text to numerical attributes | ||
|Open the vector dataset in a GIS| | |||
|Open the attribute table and click on Edit | |||
|Add a new field, give it a name and choose as data type Integer with length 1 (this can differ depending on the dataset and use case) | |||
|Use the Field Calculator to define the mapping to update the newly created column with numerical values (see image for example) | |||
|Import the data into the {{software}} and notice the new attribute and values are imported | |||
}} | |||
<gallery mode="nolines"> | <gallery mode="nolines"> | ||
File: | File:Add_field.PNG|Add a new field | ||
File: | File:Field_calc.PNG|Use the field calculator to define the mapping | ||
File: | File:Output.PNG|The output of the field calculator | ||
</gallery><br clear=all> | </gallery><br clear=all> | ||
| Line 48: | Line 52: | ||
|Open the vector dataset in a GIS | |Open the vector dataset in a GIS | ||
|Open the attribute table and click on Edit | |Open the attribute table and click on Edit | ||
|Add a new | |Add a new field, named COLOR with datatype Integer and length 10 | ||
|In the {{software}}, Click on the Current tab and then Areas. | |In the {{software}}, Click on the Current tab and then Areas. | ||
|Add a new area and click on the Attributes tab. Change the color of the area to colors you want to use for each category, and copy these numerical color codes to another file | |Add a new area and click on the Attributes tab. Change the color of the area to colors you want to use for each category, and copy these numerical color codes to another file | ||
Revision as of 09:42, 22 August 2019
Why preparing data?
Preparing data is useful when you have datasets available which you always use in your Tygron Platform projects. For example, if you take the MKP Module of the Province of Utrecht, which consists of indicators and panels concerning different environmental topics. For their indicators and panels to work, they need to import into every new project multiple datasets. For such use cases, it can save a lot of time if you prepare these datasets once and then easily import them into every new project. Read below for some considerations on various topics and apply the ones useful for you.
Attributes
Text attributes
Since the Tygron Platform can only import numerical attributes, it might be convenient to already look at the data to see if there are any text values you want to use later on. For example in an indicator or to show the value of different attributes in an overlay. If you would like to use these text attributes, consider a mapping from text to numbers.
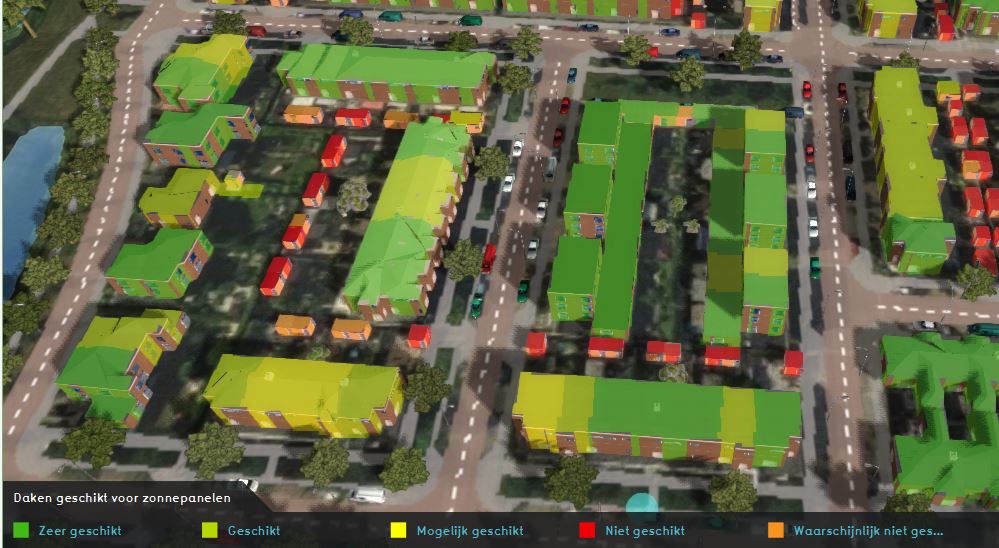
Consider the following example: you have a dataset with the suitability of buildings for solar panels. The suitability is described in a text attribute with values such as: suitable, not suitable, very suitable etc. We would like to create an indicator that calculates some statistics about this dataset per neighborhood. We then need to import this suitability attribute as a numerical value into the Tygron Platform. See below for the steps:
- Open the vector dataset in a GIS
- Open the attribute table and click on Edit
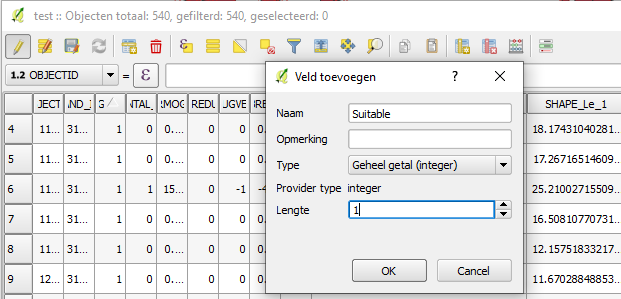
- Add a new field, give it a name and choose as data type Integer with length 1 (this can differ depending on the dataset and use case)
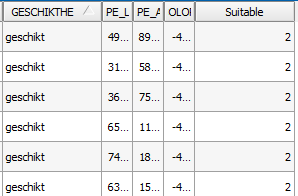
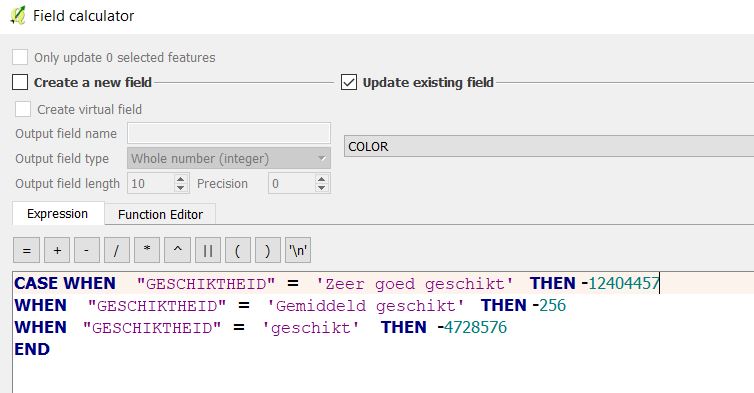
- Use the Field Calculator to define the mapping to update the newly created column with numerical values (see image for example)
- Import the data into the Tygron Platform and notice the new attribute and values are imported
-
Add a new field
-
Use the field calculator to define the mapping
-
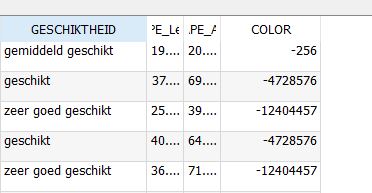
The output of the field calculator
Naming of features
Text attributes in the data can only be used for naming polygons (relate to areas for creating an overlay) in the Tygron Platform. Naming of data is done in step 5 of the Geo data wizard. In this step it is possible to choose an attribute value for naming each polygon. It is important to give each area a fitting name, so if you have a lot of areas imported it is easy to distinguish between them. Also, when creating an overlay of these areas and clicking on them, the name value can provide more information by choosing an informative attribute for the name.
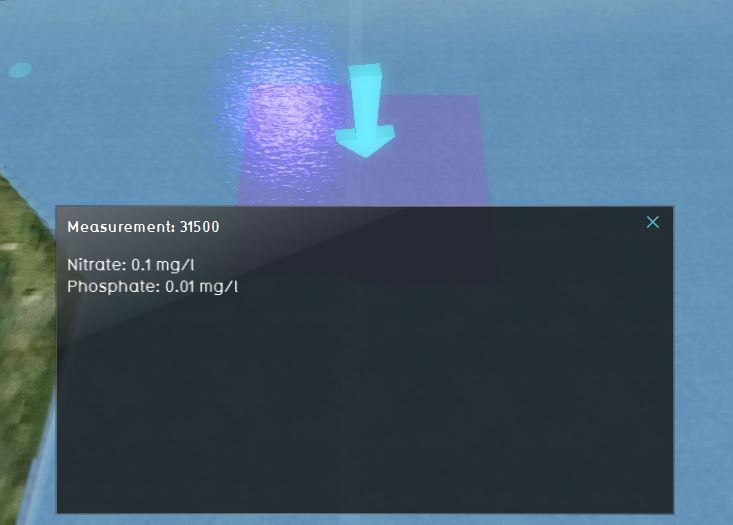
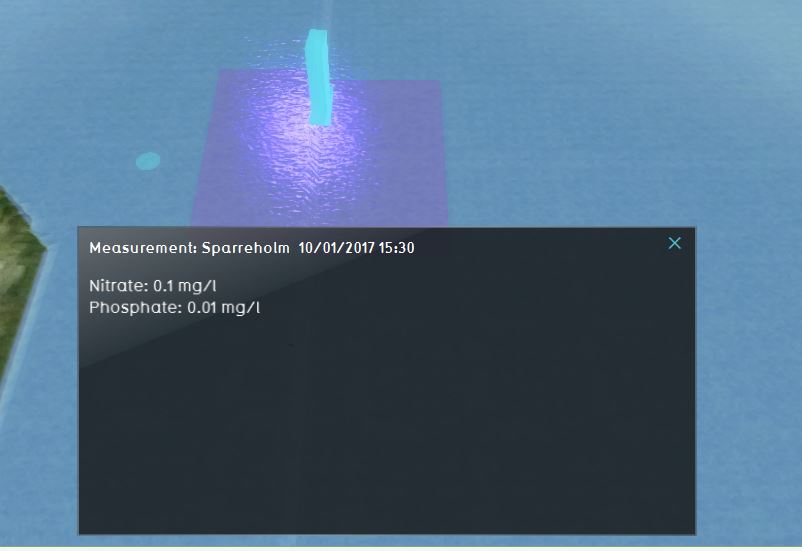
Consider the following example: Suppose you have a dataset with measurement locations and values. A name could be for example the id of the measurements. However more informative would be to have the location and date of the measurements as a name for each measurement area. These are text values and can not be imported in the Tygron Platform as such. By using them as name they can still be used to provide information to the user. Since you can only choose one column for naming, consider (if needed) to concatenate multiple attribute values to one value per feature (in this use case the location and the datetime were concatenated).
-
ID of the measurement as name
-
Location and date time as name
Extra attributes
It also might be convenient to add an extra attribute to your data if you want to create indicators or panels. Consider the following use case: you want to create a panel that pops up when you build a windmill in an area that is not allowed. These areas where a windmill is not allowed are for example Natura2000 areas, quiet areas (stiltegebieden), buffer zones around pipes, residential areas etc. These are all different datasets that can be imported in to the software. In the panel, a TQL query to check if there are any gridcells where there is a windmill that overlaps with one of these areas overlap each other, will look something like this: SELECT_LOTPOLYGONS_WHERE_FUNCTION_IS_880_AND_AREA_WITH_ATTRIBUTE_IS_..... The dots indicate the name of a common attribute the different datasets have. Therefore, adding to each of these dataset a common attribute name, will ensure it to be easier to test the use case. The value of the attribute will not matter, as long as it is not 0, because that would translate in the Tygron Platform to the area not having the attribute. It is only about the attribute name. See the steps below for an example of adding an attribute to a dataset:
Colors
In the Tygron Platform every polygon gets a random color. This will be visible in the legend. It might be desirable for different use cases to have every polygon of the same category have the same color.
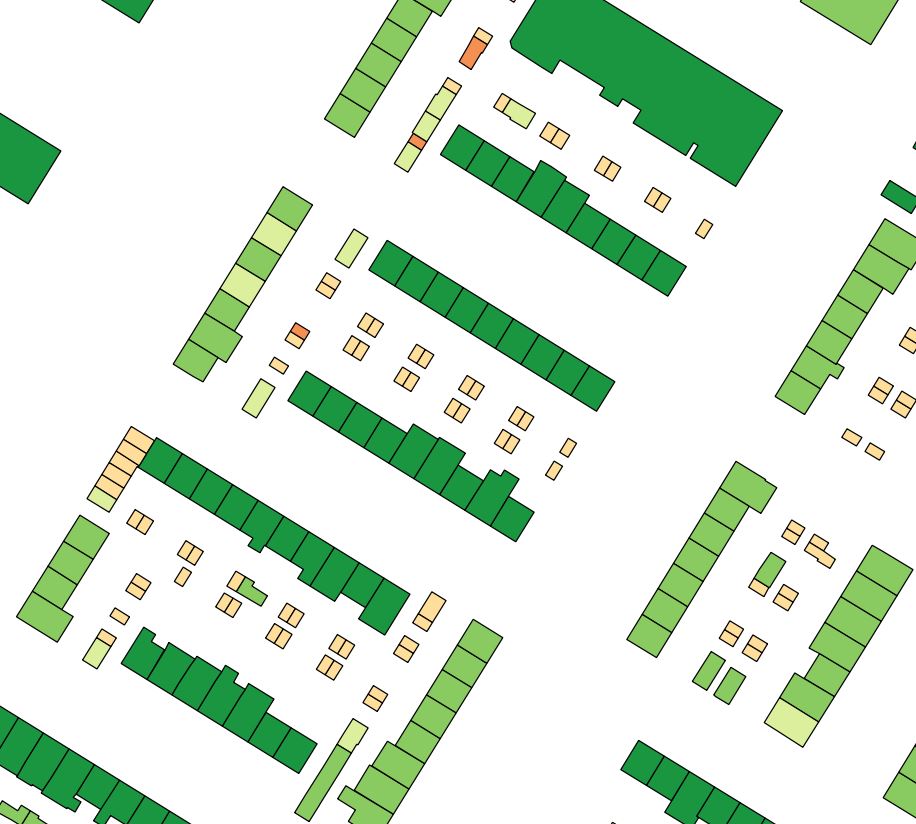
For example, if you have a dataset with which houses are suitable for solar panels in where evere house is a polygon, you might want to have the different suitability classes the same color so the map is better readable. It is possible, after importing the data to manually change the color of one or multiple areas. However, if you use the same dataset for multiple projects, it is more convenient to prepare the data first.
A solution could be to merge the polygons of the same classes so you will end up with one big multi polygon of suitable houses, one big multi polygon of less suitable houses etc. However, you will then not have access anymore to the induivudual attributes of each house polygon, such as the possible amount of solar panels on the house. In this situation (and numerous others), it might be helpful to add a column to the data with the color code to use by the Tygron Platform. Read below for the steps:
- Open the vector dataset in a GIS
- Open the attribute table and click on Edit
- Add a new field, named COLOR with datatype Integer and length 10
- In the Tygron Platform, Click on the Current tab and then Areas.
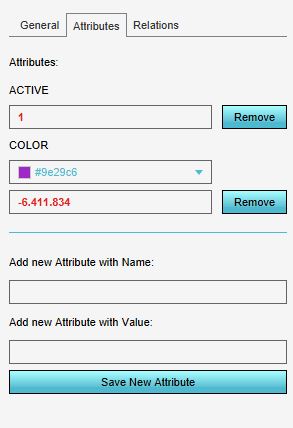
- Add a new area and click on the Attributes tab. Change the color of the area to colors you want to use for each category, and copy these numerical color codes to another file
- Now in a GIS, use the field calculator to update the COLOR attribute with the color codes (without separators) for the corresponding categories
- Save the file and import the data
-
The dataset in a GIS
-
Example of a color code used in the Tygron Platform
-
Example of using the field calculator
-
The updated dataset
-
The dataset imported in the Tygron Platform
Data publishing
If possible, the best way to publish data for use in the Tygron Platform is as a WFS. A WFS is desirable, because you only have to provide an URL in the Geo data wizard to import the data from. This URL can be saved in a Template project and makes it easier for users to import the data, since they only have to select the right URL in the Geo data wizard and import the datasets they want to use. In a WFS, the data provider can publish multiple datasets which are already prepared to use in the Tygron Platform.
If a WFS is not achievable or possible, then consider a shared folder where users of your organization which use the Tygron Platform have access to. In the folder, the different prepared datasets, in GeoJSON format can be saved.
Data representation
Vector Geodata can consists of point, line and polygon features. In the Tygron Platform only polygons can be imported. Therefore, take into consideration to already convert point and lines to polygons. In step 2 of the geo data wizard, there is also the option to buffer the features by chosing a buffer distance. However, for consistency and ease of use it is much easier to already have the data buffered.
