Traffic NO2 Overlay: Difference between revisions
mNo edit summary |
|||
| Line 42: | Line 42: | ||
''Sometimes it can be convenient to duplicate an already existing overlay. To do so, follow the steps for removal, but select 'Duplicate' in stead of 'Remove'.'' | ''Sometimes it can be convenient to duplicate an already existing overlay. To do so, follow the steps for removal, but select 'Duplicate' in stead of 'Remove'.'' | ||
==References== | |||
The overlay calculations are based on Standard Calculation Method 1 (SRM1) as defined by the dutch government: [http://wetten.overheid.nl/BWBR0022817/2013-01-01#Bijlage1 wetten.overheid.nl] | |||
Revision as of 12:05, 19 June 2017
What is the Traffic NO2 overlay?

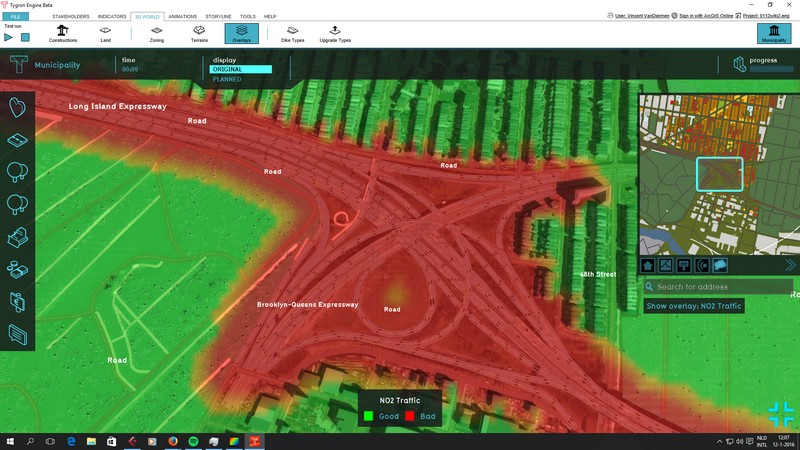
The Traffic NO2 overlay is an Overlay which displays the impact of traffic air polution (in μg/m³ nitrogen dioxide) in different colors for the project area. These colors indicate traffic air polution of a location based on traffic flow and distance.
Traffic NO2 air polution overlay colors
Traffic NO2 air polution is indicated in red (= bad) and green (= good)
Additional information displayed in hover panel
The hover panel gives the actual air polution value (in μg/m³ nitrogen dioxide) for the selected location when the overlay is active.
Adding and removing
Adding and removing overlays is a generic process, however, certain overlays are dependent on other assets being present too, such as indicators, terrains, vacancy, images, etc. For more information please refer to the respective main articles for the specific overlays.
- Select in the editor 'Geo Data' from the ribbon
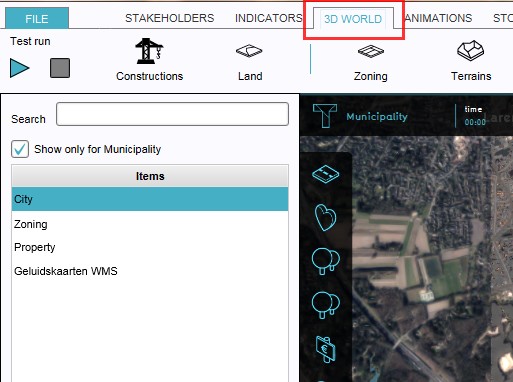
- Select 'Overlays' > 'Edit overlays' from the ribbon bar
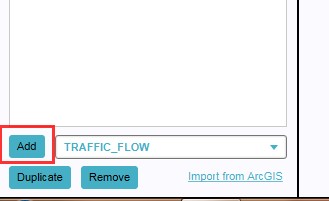
- Select the Traffic NO2 overlay from the drop down menu on the bottom of the left panel
- Select 'Add' from the bottom of the left panel
- The overlay icon will now appear under the mini map
-
1. Select Geo Data
-
2. Select Overlays > Edit overlays
-
3. Select desired overlay from drop down menu on the bottom of the left panel
-
4. Select 'Add' from the bottom of the left panel
-
5. The overlay icon will now appear under the mini map
- Select in the editor 'Geo Data' from the ribbon
- Select 'Overlays' > 'Edit overlays' from the ribbon bar
- Select the desired overlay from the list of active overlays on the left panel
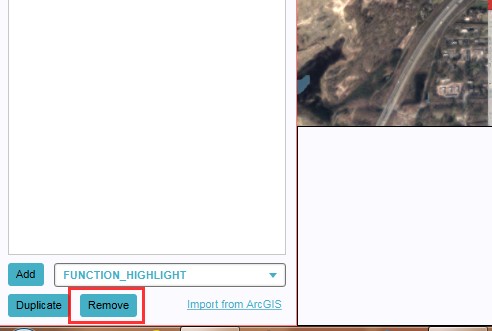
- Select 'remove' from the bottom of the left panel
- Confirm the removal in the pop up confirmation message
-
1. Select Geo Data
-
2. Select Overlays > Edit overlays
-
3. Select desired overlay from the list of active overlays on the left panel
-
4. Select 'Remove' from the bottom of the left panel
-
5. Confirm the removal in the pop up confirmation message
Sometimes it can be convenient to duplicate an already existing overlay. To do so, follow the steps for removal, but select 'Duplicate' in stead of 'Remove'.
References
The overlay calculations are based on Standard Calculation Method 1 (SRM1) as defined by the dutch government: wetten.overheid.nl


