How to configure the Water Overlays: Difference between revisions
Jump to navigation
Jump to search
| Line 36: | Line 36: | ||
</gallery> | </gallery> | ||
==Multi | ==Multi breach simulation== | ||
It is also possible to simulate multiple | It is also possible to simulate a situation in where there is first one dike breach, following by another (or multiple). | ||
Therefore we also make use of the variable Outlet Q as mentioned above in the previous use case. | Therefore we also make use of the variable Outlet Q as mentioned above in the previous use case. In the steps below, two breaches are demonstrated, but the same steps apply to multiple breaches. | ||
{{Editor steps|title= | {{Editor steps|title= set up a multi breach scenario | ||
| | |Either add two breach areas or have your [[GeoJSON]] file with your breach areas ready. The areas should have at least a [[Flooding_(Overlay)#Define_a_Breach_area|breach floor attribute]]. | ||
|In the | |Add a [[Flooding_(Overlay)|Flooding Overlay]]. | ||
| | |Go to the [[Water_Overlays#Configuration_Wizard|Configuration Wizard]] of the Flooding Overlay. | ||
| | |In step 2.1 either select the attribute that specifies your breach floor or import your [[GeoJSON]] file. | ||
|Click on ''Next''. | |||
|In the dropdown menu, select the breach area that breaks second. | |||
|Click on ''Edit'' and import the CSV file. Structure the data in the CSV in a way that at the start of the simulation, the outlet is 0. | |||
|Finish the Wizard and refresh the Overlay. | |||
}} | }} | ||
<gallery mode=nolines> | <gallery mode=nolines> | ||
File: | File:Breach_areas.JPG | ||
File: | File:Breach_two.JPG | ||
File:Breach_2_csv.JPG | |||
</gallery> | </gallery> | ||
==Import data with waterdepths== | ==Import data with waterdepths== | ||
Revision as of 13:19, 24 October 2018
Please note: This page is currently being updated.
This page describes several use cases and examples of configurations in the Flooding Overlay.
Time-controlled flow rate in a Breach area
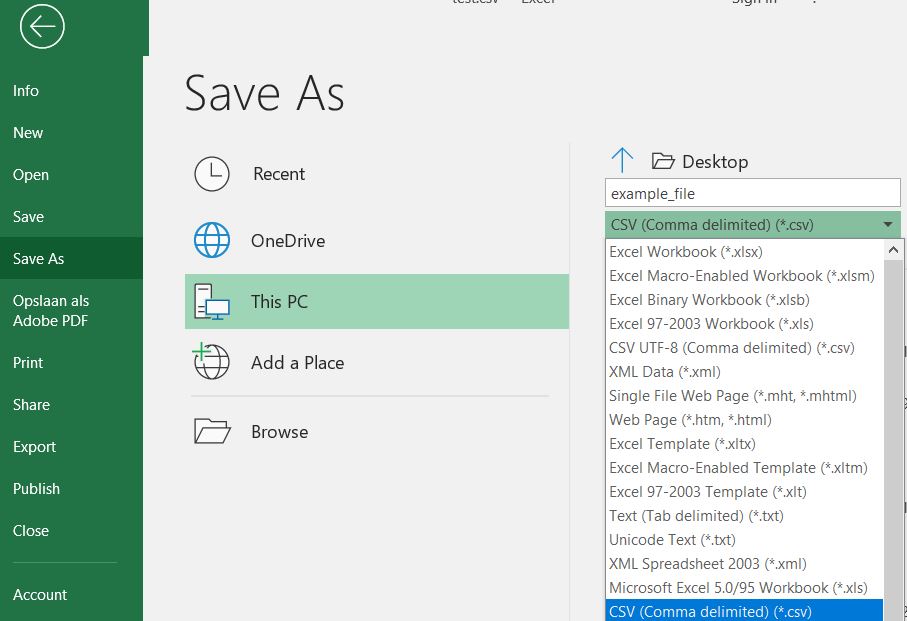
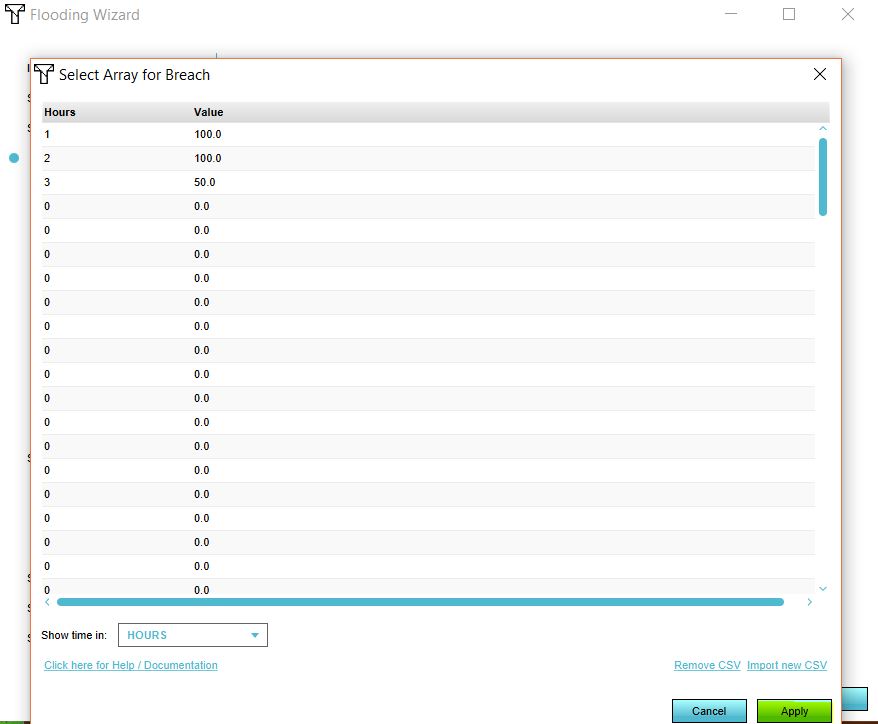
To create a variable Outlet Q in a breach area, a CSV (comma-separated values) file can be imported. Below the steps on how to create such a breach area. For this example we create the CSV in Excel, but you can also use another program to create the CSV.
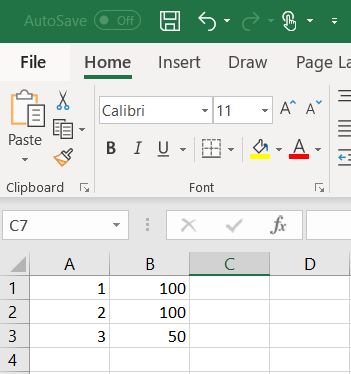
How to set-up your CSV in Excel:
- Open Excel.
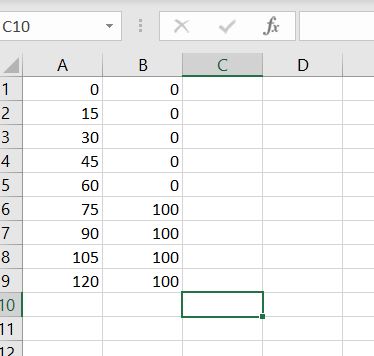
- In the first column, define your time steps. This can be in seconds, minutes, hours or days.
- Add the corresponding flow rates per step in the second column.
- Save the Excel as a CSV.
How to import the CSV as the flow rate:
- Either add a breach area or have your GeoJSON file with your breach area ready. The area should have at least a breach floor attribute.
- Add a Flooding Overlay.
- Go to the Configuration Wizard of the Flooding Overlay.
- In step 2.1 either select the attribute that specifies your breach_floor or import your GeoJSON file.
- Click on Next.
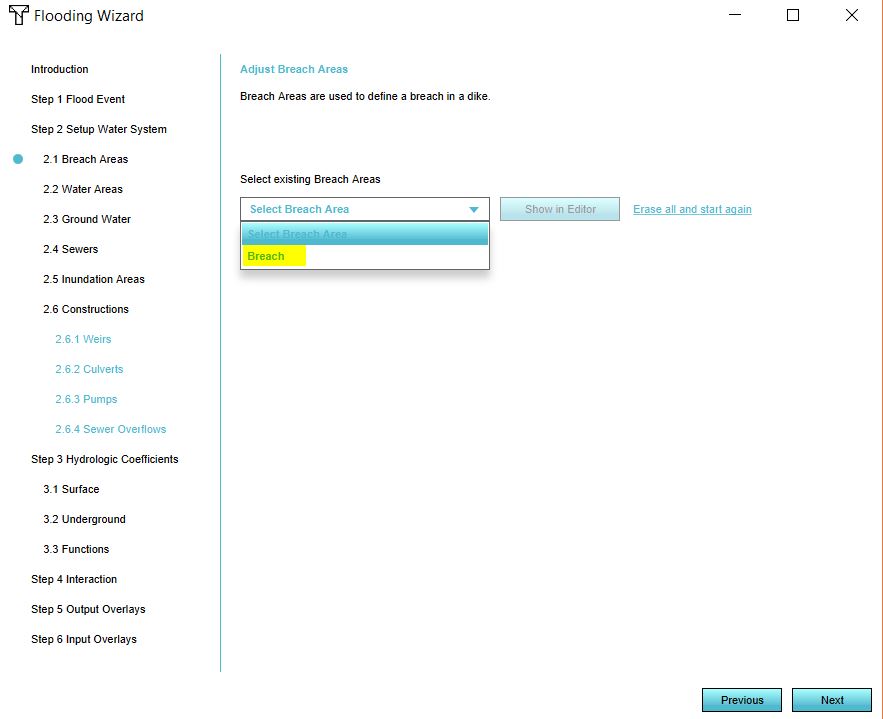
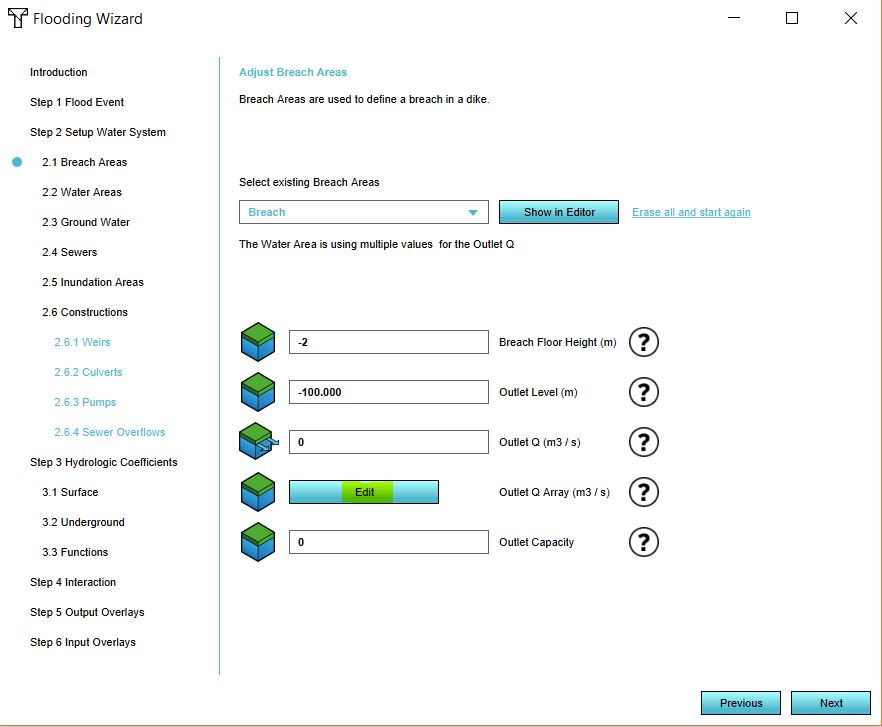
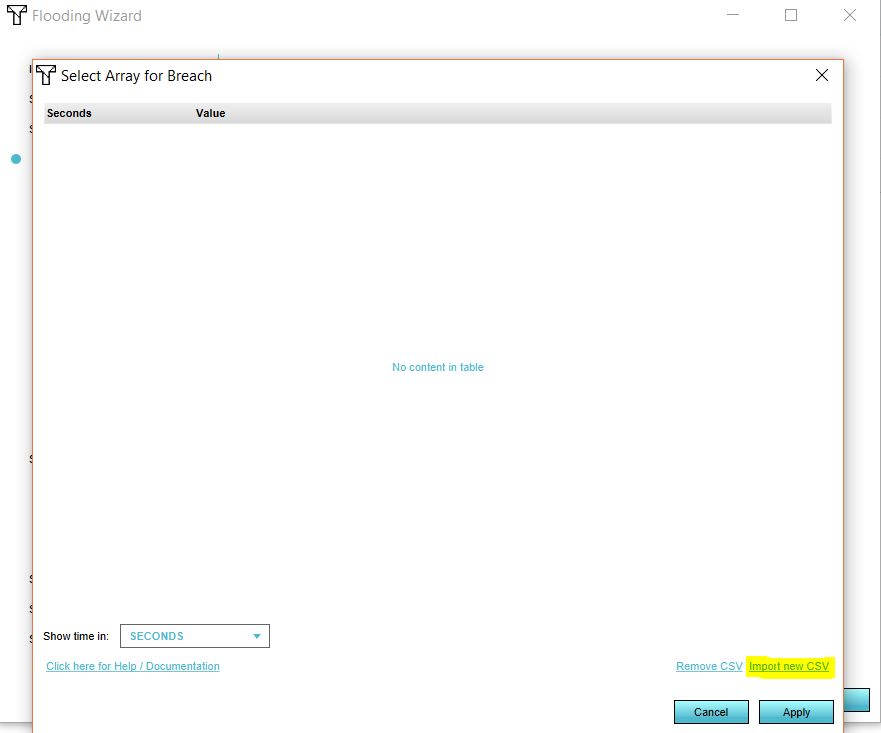
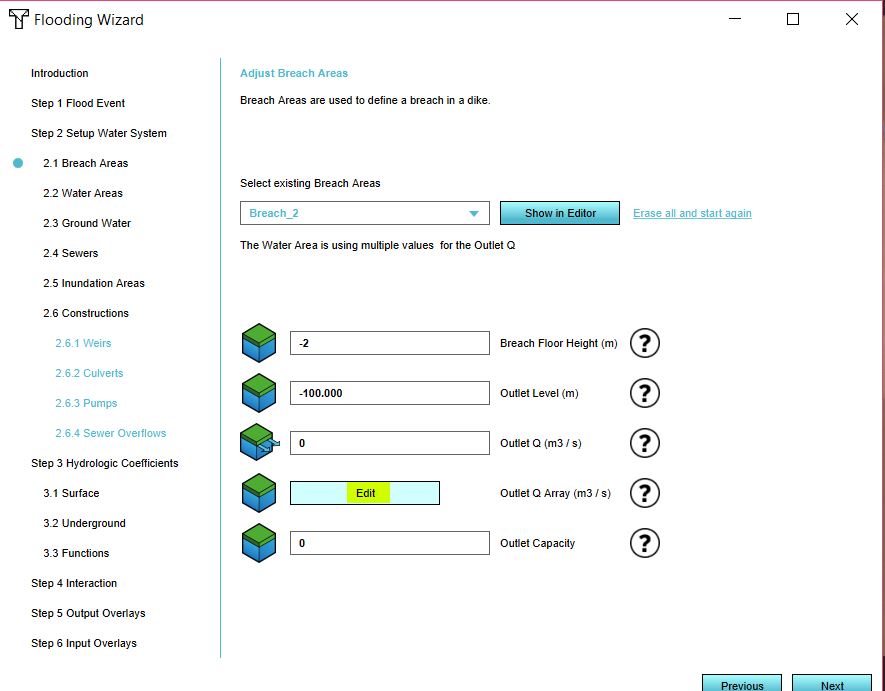
- In the dropdown menu, select your breach area. Now click on Edit.
- Import your CSV file by selecting the CSV file.
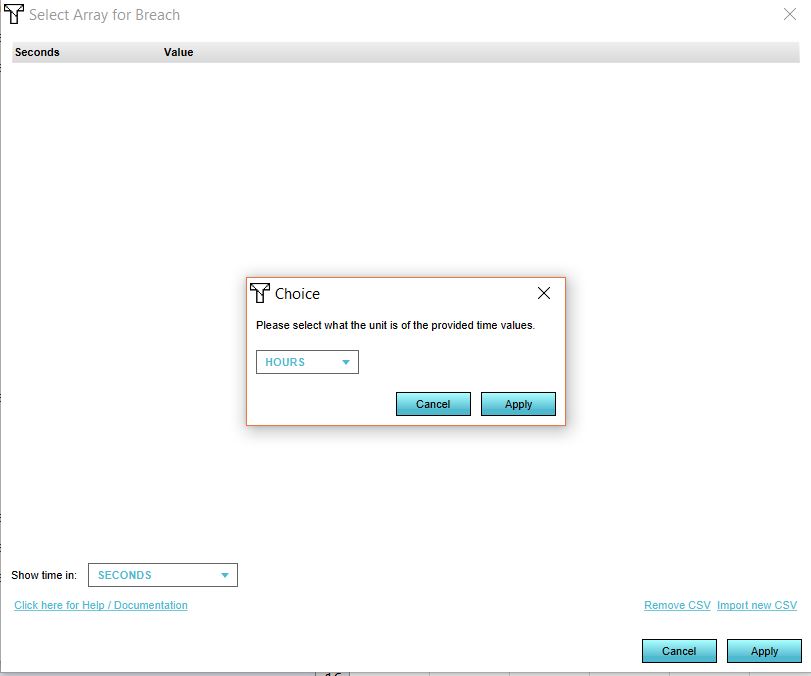
- Select the time units in your file.
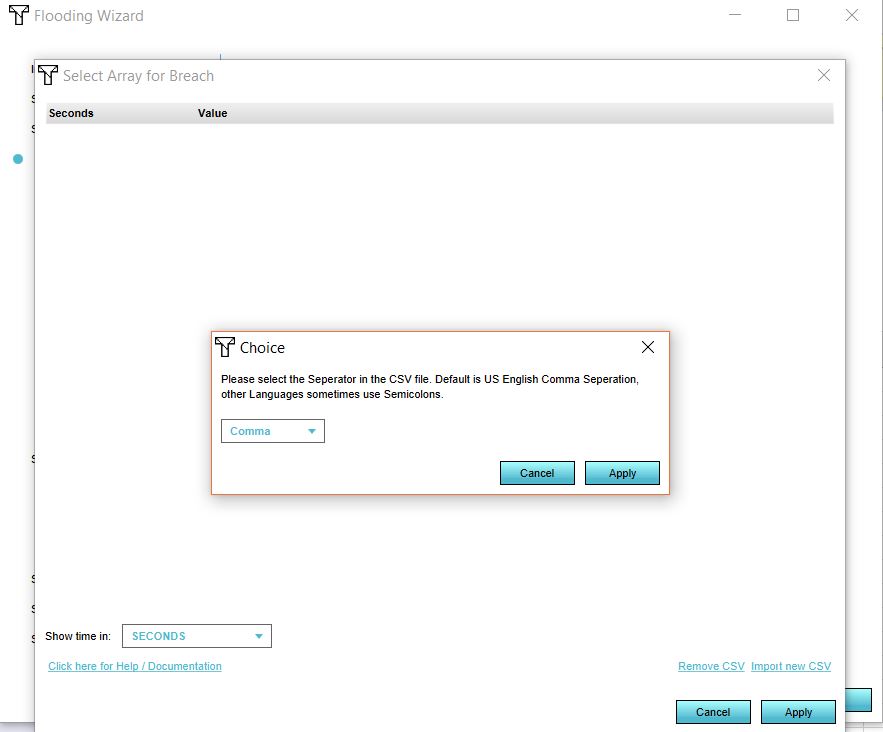
- Select the seperator for your file.
- Click on Apply.
Multi breach simulation
It is also possible to simulate a situation in where there is first one dike breach, following by another (or multiple). Therefore we also make use of the variable Outlet Q as mentioned above in the previous use case. In the steps below, two breaches are demonstrated, but the same steps apply to multiple breaches.
How to set up a multi breach scenario:
- Either add two breach areas or have your GeoJSON file with your breach areas ready. The areas should have at least a breach floor attribute.
- Add a Flooding Overlay.
- Go to the Configuration Wizard of the Flooding Overlay.
- In step 2.1 either select the attribute that specifies your breach floor or import your GeoJSON file.
- Click on Next.
- In the dropdown menu, select the breach area that breaks second.
- Click on Edit and import the CSV file. Structure the data in the CSV in a way that at the start of the simulation, the outlet is 0.
- Finish the Wizard and refresh the Overlay.
