Data preparation
Why preparing data?
Preparing data is useful when you have datasets available which you always use and need in your projects. For example, if you take the MKP of the Province of Utrecht. For their indicators and alerts to work, they need to import into every new project a lot of their datasets. It can save a lot of time if you prepare these datasets once and then easily import them into every new project. Read below for some considerations on various topics and apply the ones useful for you.
Attributes
Text attributes
Since the Tygron Platform can only import numerical attributes, it might be convenient to already look at the data to see if there are any text values you want to use later on in for example a indicator or to show in an overlay. If you would like to use these text attributes, consider a mapping from text to numbers. See below for an example
Naming of the data
Extra attributes
It also might be convenient to add an extra attribute to your data.
Legend and colors
In the Tygron Platform every polygon gets a random color. This will be visible in the legend. It might be desirable for different use cases to have every polygon of the same category have the same color.
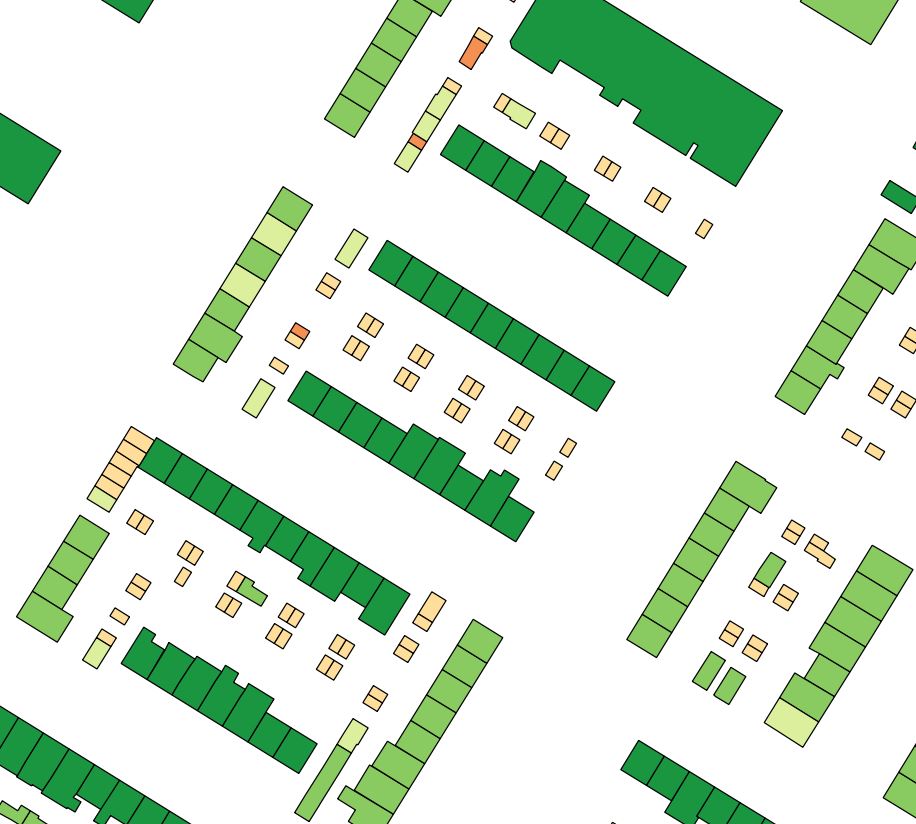
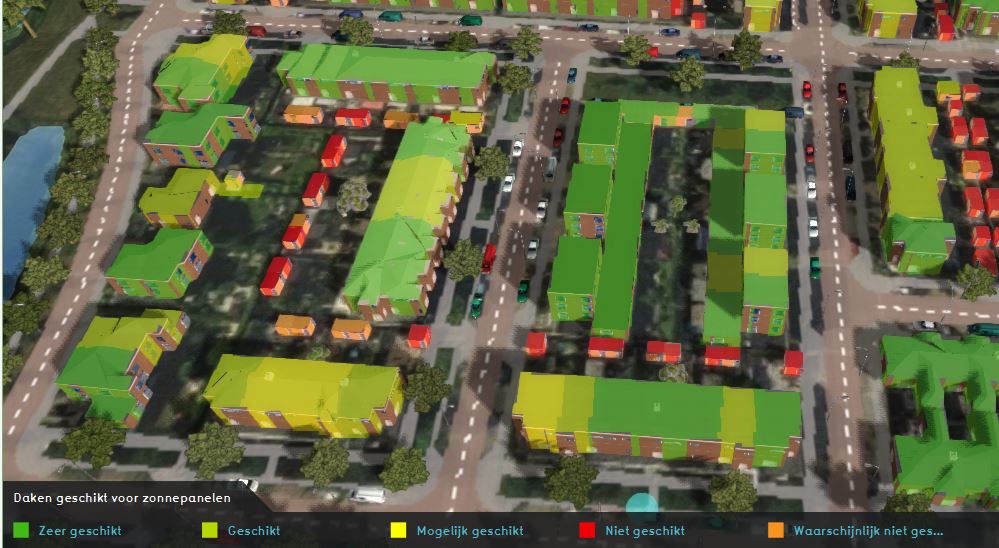
For example, if you have a dataset with which houses are suitable for solar panels in where evere house is a polygon, you might want to have the different suitability classes the same color so the map is better readable. It is possible, after importing the data to manually change the color of one or multiple areas. However, if you use the same dataset for multiple projects, it is more convenient to prepare the data first.
A solution could be to merge the polygons of the same classes so you will end up with one big multi polygon of suitable houses, one big multi polygon of less suitable houses etc. However, you will then not have access anymore to the induivudual attributes of each house polygon, such as the possible amount of solar panels on the house. In this situation (and numerous others), it might be helpful to add a column to the data with the color code to use by the Tygron Platform. Read below for the steps:
- Open the vector dataset in a GIS
- Open the attribute table and click on Edit
- Add a new column, named COLOR with datatype Integer and length 10
- In the Tygron Platform, Click on the Current tab and then Areas.
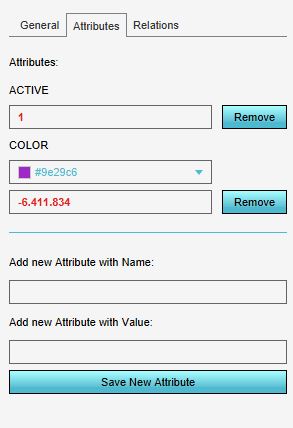
- Add a new area and click on the Attributes tab. Change the color of the area to colors you want to use for each category, and copy these numerical color codes to another file
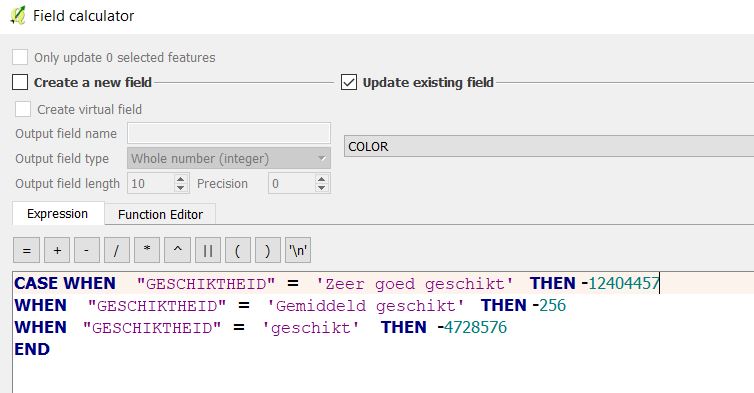
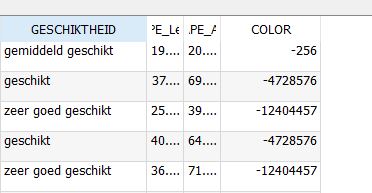
- Now in a GIS, use the field calculator to update the COLOR attribute with the color codes (without separators) for the corresponding categories
- Save the file and import the data
-
The dataset in a GIS
-
Example of a color code used in the Tygron Platform
-
Example of using the field calculator
-
Service or file?
wfs optie - template format
Polygons
polygons/buffer
