UK Benchmark 5 (Water Module)
This page contains the test case 5 of the UK benchmark named Test 5 – Valley flooding as well as its result generated by the Water Module in the Tygron Platform.
This tests a package’s capability to simulate major flood inundation and predict flood hazard arising from dam failure (peak levels, velocities, and travel times).
Description
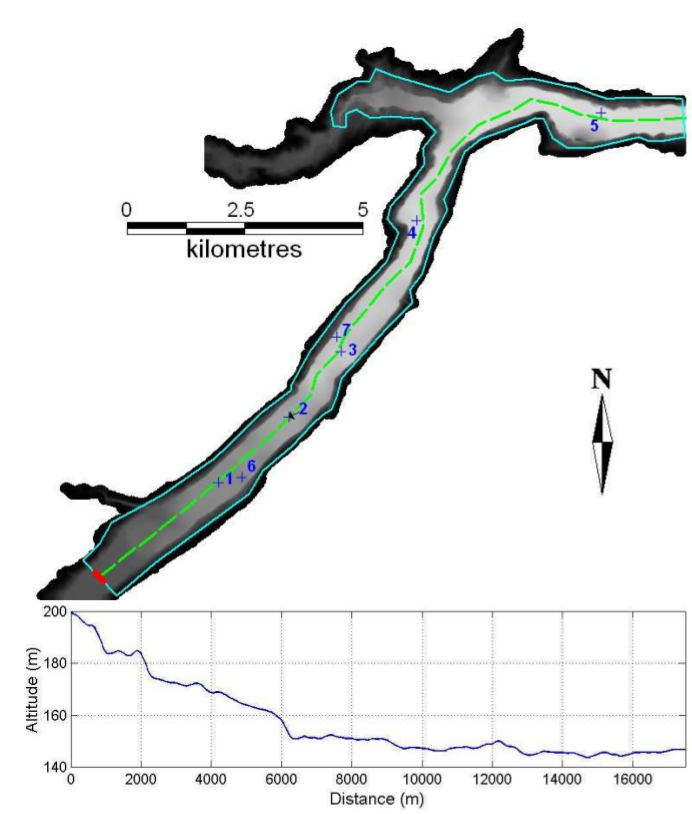
This test is designed to simulate flood wave propagation down a river valley following the failure of a dam. The valley DEM is ~0.8km by ~17km and the valley slopes downstream on a slope of ~0.01 in its upper region, easing to ~0.001 in its lower region. The inflow hydrograph applied as a boundary condition along a ~260m long line at the upstream end is designed to account for a typical failure of a small embankment dam and to ensure that both super-critical and sub-critical flows will occur in different parts of the flow field, see Figure (b). The model is run until time T = 30 hours to allow the flood to settle in the lower parts of the valley.


Boundary and initial condition
- Inflow boundary condition along the dashed red line in Figure (a). Table provided as part of dataset.
- All other boundaries are closed.
- Initial condition: Dry bed.
Parameter values
- Manning’s n: 0.04 (uniform)
- Model grid resolution: 50m (or ~7600 nodes in the 19.02 km 2 area modelled)
- Time of end: the model is to be run until time t = 30 hours (if an alternative end time is used run times must be reported for t=30 hours)