Panels (template panels) tutorial
Prerequisites
The following prerequisites should be met before starting this tutorial:
- This tutorial is a continuation of the panels tutorial. If you have not already done so, please complete that tutorial first. If you have not yet followed the tutorials related to those subjects please do so first.
- This tutorial can be followed with any project of any arbitrary location. Recommended is to create or load a project in the editor with 3 or more neighborhoods at least partially within the project area
- Microsoft Excel is required for completing this tutorial.
Preparations
Take the following steps as preparation for following this tutorial:
- Start your project. This can be a pre-existing project, or a newly created project.
- Start Microsoft Excel. Excel will be required in the later stages of the tutorial.
Adding a Template Excel panel
In the editor, go to:
You can add a Template excel either by selecting the "Add Simple Template" option in the popup menu for Panels in the ribbon, or by selecting TEMPLATE_EXCEL_PANEL in the left panel, followed by "Add". The panel will be added in the Template Panels category.
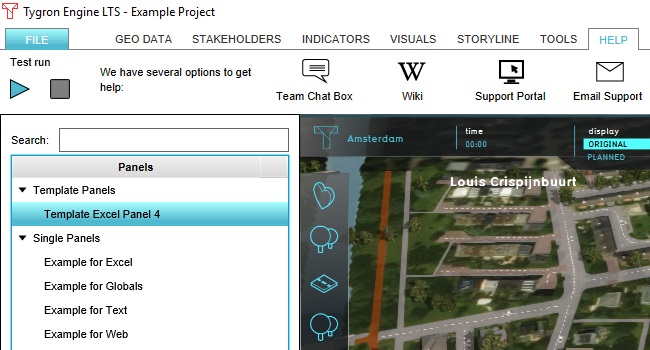
Generally, the configuration options for the Template panel are the same as for the other panels, with 2 important differences. It is not possible to open the panel or to place it in the project area as a popup. Instead, there are options to apply the template on spatial data, such as neighborhoods or areas. This will create an instance of this panel, based on how you configured the Template Excel panel, for every spatial datum which meets your specification.
Create an Excel file
In Excel, create a new Excel File with the following information (note that this is the same excel definition as in the first panels tutorial. You can reuse that file directly.):
- Cell A1 has the content “EXPLANATION: “
- Cell B1 has the name “EXPLANATION”
- Cell B1 has a color, indicating that this cell is named and provides output.
- Cell B1 has the content “=B2&B3”
- Cell A2 has the content “Text:”
- Cell B2 has the content “This is my excel panel. There are this many houses in this location: ”
- Cell A3 has the content “Houses:”
- Cell B3 has the name “SELECT_UNITS_WHERE_MAP_IS_MAQUETTE”
- Cell B3 has the content “1234”. This is a placeholder value.
- Cell B3 has a color, indicating that this cell is named and provides input.

(Note that in the above image, in column C the names of the cells in column B are displayed as well, for a more complete overview of how this Excel should be composed.) (Note that in your file the colors are not required, but help to maintain an overview of how the sheet functions. i.e. Where information comes in, and where it goes out.) Save the Excel file.
Import the excel file and apply it to the Template excel panel.
Creating instances of a Template Excel panel
Make sure “Apply Template on” is set to “NEIGHBORHOODS”, and click on “Apply Template”. You will get a notification of the amount of panels which will be created based on this Template Excel panel. In this case, one for each neighborhood.
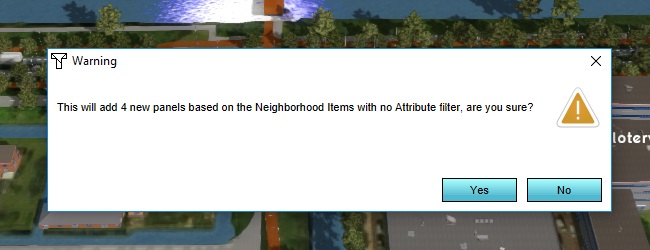
Click “Yes”, and the panels will be created. The panels will be visible in the 3D Visualization, and can be found in the left panel as sub-items of the Template Excel panel.
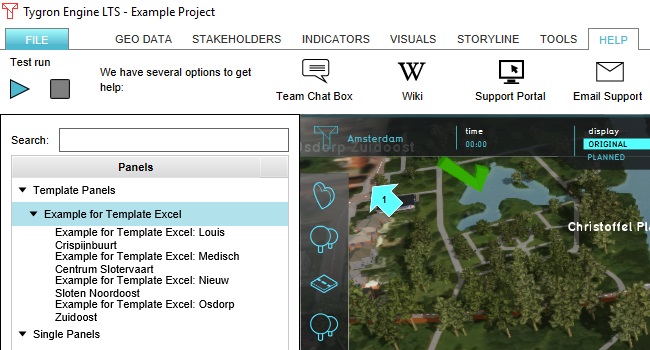
When you select one of the instances of the Template Excel Panel, you will see in the right panel that the configuration options for a panel created based on a Template Excel Panel are effectively the same as those for an Excel Panel. The properties of the instanced panel will be the same as the properties of the Template Excel panel. For example: the model, whether it requests attention or not, to which stakeholder it is assigned, etc. The name is always a composite of the name of the Template Excel panel, and the spatial item this instance relates to.
It is possible to tweak the properties of an instance of a Template Excel Panel, for example change its model or underlying excel sheet, but this is discouraged. When the Template Excel Panel is updated and reapplied, all existing instances of that Template Excel Panel are removed, and new ones are created. Any changes you have made to those instances will be lost. Open any of the instanced panels, either by selecting them in the editor and clicking “Open Panel”, or by clicking on their popup in the 3D Visualization.
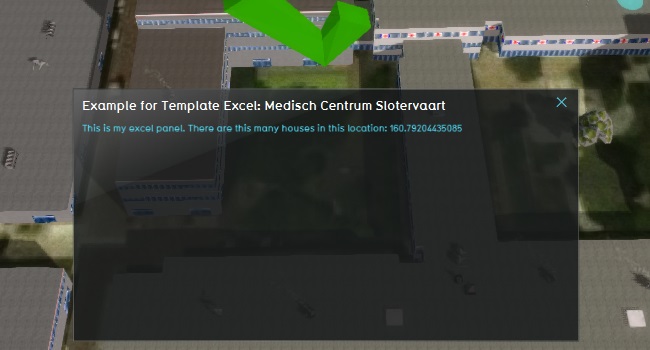
You will see that the content of the instanced panel is exactly the same content as is created by the sheet we selected for the Template Excel Panel.
ID-queries
When creating a panel for every neighborhood, or every area, or every spatial datum of a given type, most use-cases desire that information related to that specific item is displayed or used in determining the content of that panel. For this, a new syntax can be used in TQL called an “ID” query. A specific ID in a query can be replaced by “ID” to mean as much as “(of) the item concerned”. The following will demonstrate its usage and effect.
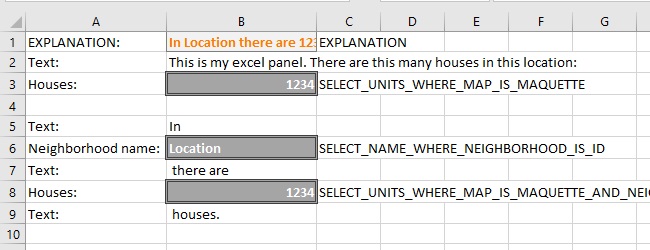
Update your excel sheet, make the following changes:
- Cell B1 has the content "=B5&B6&B7&B8&B9"
- Cells A5, A7 and A9 have the content "Text:"
- Cell B5 has the content "In "
- Cell B7 has the content " there are "
- Cell B9 has the content "houses."
- Cell A6 has the content "Neighborhood name"
- Cell B6 has the name "SELECT_NAME_WHERE_NEIGHBORHOOD_IS_ID"
- Cell B6 has the content "Location". This is a placeholder value.
- Cell A8 has the content "Houses"
- Cell B8 has the name "SELECT_UNITS_WHERE_MAP_IS_MAQUETTE_AND_NEIGHBORHOOD_IS_ID"
- Cell B8 has the content "1234". This is a placeholder value.
- Cells B6 and B8 have a color, indicating that these cells are named and provide input.
Save the Excel file.
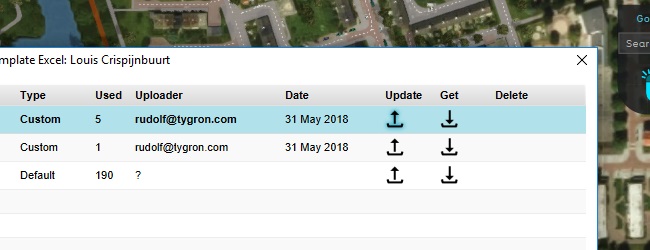
In the editor, select your Template Excel panel (not an instance of the Template Excel Panel, but the original Template Excel Panel) and click “Select Excelsheet”.
Update the Excel file of the Template Excel panel by clicking the “Update” icon.
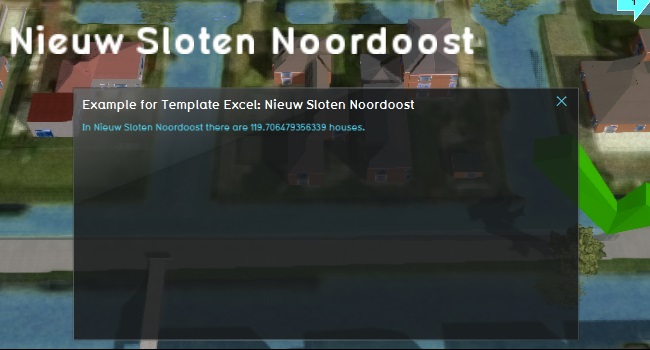
Click on “Apply Template”, to replace the existing instances of the panel with new instances. Open one of the instanced panels. You will see each panel has different information based on their neighborhoods.
Additional uses for ID-queries
ID queries can also be used in non-template Excel panels, provided that the data being requested is related to the panel.
The following clauses with ID queries can be used to refer to certain types of data, given that the following conditions are met:
| Clause | Conditions |
|---|---|
| WHERE_PANEL_IS_ID | This clause can be used in any panel. It will refer to the panel itself. |
| WHERE_STAKEHOLDER_IS_ID | This clause can be used if the panel is assigned to a specific stakeholder. It will refer to the stakeholder the panel is assigned to.
A common misconception is that this query can be used to refer to the stakeholder who is opening/looking at the panel, even when there is no stakeholder assigned. This clause is invalid when there is no stakeholder assigned to it. |
| WHERE_NEIGHBORHOOD_IS_ID WHERE_AREA_IS_ID |
This clause can be used in Template Excel panels, when they are applied on that spatial data type. For example, when the panel is applied on Areas, the AREA_IS_ID clause can be used, but not NEIGHBORHOOD_IS_ID, BUILDING_IS_ID, or ZONE_IS_ID. |
Assignments
These assignments test comprehension of the Template Excel panel functionality, and the ability to design and implement a common use-case. As preparation for these assignments, add a Heat Stress overlay to the project.
- Using Template Excel panels, create information panels for all neighborhoods visible to all stakeholder, providing information on the average effect of heat stress in the neighborhood.
- Add a "RISK_AREA" attribute with value "1" to two or more neighborhoods which you deem interesting to display information for. Use the "With Attribute" field in the Template Excel panel's right panel to apply the template only to neighborhoods with that attribute.
- Expand the information panels to take into account vulnerable demographics in those neighborhoods. This information is available in generated projects as attribute in each neighborhood.
Remove the panels created in these assignments when you are done.
Update statements
For some use-cases, it is useful to change the properties of panels based on information in a project. This can be done using TQL, by adding UPDATE statements to the Excel file of an Excel Panel.
You already have information in our panels on the amount of houses in the neighborhoods. Open a few of the instanced panels and take note of how many houses there are in those neighborhoods. Take an approximate average of those values so that you have a number of houses. Some neighborhoods have more houses than that, other neighborhoods have fewer. This will be a value that the panels will test against.
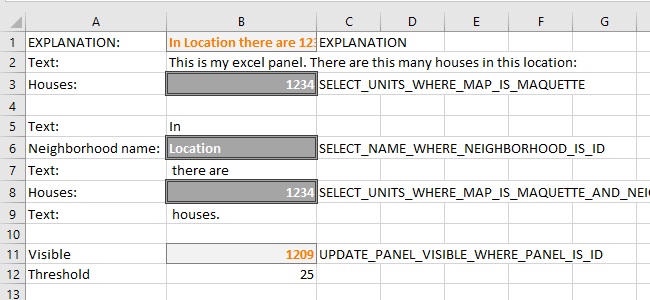
Update your excel sheet, make the following changes:
- Cell A11 has the content "Visible"
- Cell B11 has the content "=B8-B12"
- Cell B11 has the content "=B8-B12"
- Cell B11 has the name "UPDATE_PANEL_VISIBLE_WHERE_PANEL_IS_ID"
- Cell B11 has a color, indicating that this cell is named and provides output.
- Cell A12 has the content "Threshold"
- Cell B12 has as content the approximate average of the values as determined earlier.
Select your Excel file and upload it.
Click on “Apply”.
Click on “Apply Template” to create new instances of the panels.
Notice that the same amount of panels have been created, as can be seen in the left panel. However, not all popups are visible in the 3D Visualization.
In the left panel, select one of the panel instances of which the popup is visible in the 3D Visualization. In the right panel, select the “Attributes” tab, and notice that the “VISIBLE” attribute is a positive value.
In the left panel, select one of the panel instances of which the popup is not visible in the 3D Visualization. In the right panel, select the “Attributes” tab, and notice that the “VISIBLE” attribute is a negative value.
Additional attributes to update
It’s possible to update arbitrary updates for many data types. Those attributes can then be used by other panels, indicators, or other parts of the project. Some attributes hold special meaning in the context of certain data types, such as the "VISIBLE" attribute for panels. The following attributes have special meaning when defined for panels.
| Attribute | Function | Value |
|---|---|---|
| VISIBLE | Whether the popup is visible in the 3D Visualization. If the panels can only be opened via the 3D Visualization, this directly affects whether a stakeholder can access the panel or the information in it. | Any value greater than 0 means that the popup is visible. A value of 0 or less means the popup is invisible. |
| ATTENTION | Whether the popup draws attention to itself. This generally makes the difference between passive information and a call-to-action where action is required. | Any value greater than 0 means that the popup is drawing attention. A value of 0 or less means the popup is not drawing attention. |
| POPUP_TYPE | Which 3D model to use for the popup in the 3D Visualization. This makes it possible to switch between, for example, a green check and a red X. | An easy way to determine which value relates to which popup model is to change the POPUP_TYPE attribute in the right panel for a visible popup, and seeing which model it displays. |
Final assignments
Using the information learned in this tutorial, you are able to create alerts for your project. An alert is a message which will appear in the 3D Visualization of the end-user when something is wrong in the project area. These could be violations of regulations, excessive risks, inappropriate urban planning, and more.
As preparation for this assignment, add a Heat Stress overlay to the project.
- Create an alert using Template Excel panel, which appears to a specific stakeholder when the heat stress exceeds a threshold value.
- Modify the alert, so that it appears when the average heat stress in that neighborhood exceeds either the threshold value or the average heat stress in the entire project area.
- Modify the alert and the data in your project so that the threshold value differs per neighborhood. (Hint: look into creating an attribute for the neighborhoods)
- Modify the alert so that while the threshold value for a neighborhood is not exceeded, the popup of the alert is indicative of being informative, but that when the threshold value is exceeded, the popup of the alert is indicative of there being a problem.
Tutorial completed
Congratulations. You have now completed this tutorial. In it, you have learned how to create and use template panels in your project. The next tutorial in this series is Panels (interaction), which will provide more knowledge about buttons, and how to allow the end-user to interact with the sessions using panels.