Demo Inlet Flooding Project: Difference between revisions
Jump to navigation
Jump to search
No edit summary |
No edit summary |
||
| (5 intermediate revisions by the same user not shown) | |||
| Line 1: | Line 1: | ||
[[File:flooding-inlet.gif|thumb|right|Flooding Inlets]] | [[File:flooding-inlet.gif|thumb|right|Flooding Inlets]] | ||
The demo project show a Flooding Overlay | The demo project show a [[Flooding Overlay]] that simulates a river flooding over-topping a levee using multiple [[Inlet (Water Overlay)|inlet]]s. | ||
The river level increases and decreases over time | The river level increases first and decreases later over time. It is modeled using several [[Inlet (Water Overlay)|Inlet]]s placed in front of a small levee in the [[Elevation (Water Overlay)|elevation]]. | ||
* Note that the inlet is placed in front (at a distance) of the levee with respect to the river, instead of on top of the levee. | * Note that the inlet is placed in front (at a distance) of the levee with respect to the river, instead of on top of the levee. | ||
* Inlet first | * Inlet first increases the lower threshold to simulate a rising water level. After a few days, the rising stops after 250000 seconds and the lower threshold is set to -10000 ({{nodata}}). Furthermore, an upper threshold is used to simulate a lowering water level. This upper thresholds starts with -10000 ({{nodata}}) and only activates after 250001 seconds. | ||
:For example: | :For example: | ||
:[[Inlet lower threshold (Water Overlay)|LOWER_THRESHOLD]] | :[[Inlet lower threshold (Water Overlay)|LOWER_THRESHOLD]] | ||
| Line 13: | Line 13: | ||
:[[Inlet upper threshold (Water Overlay)|UPPER_THRESHOLD]] | :[[Inlet upper threshold (Water Overlay)|UPPER_THRESHOLD]] | ||
:0 -10000 250000 -10000 250001 15,07 275000 15,01 300000 14,92 325000 14,83 350000 14,71 375000 14,58 400000 14,43 425000 14,3 450000 14,18 475000 14,05 500000 13,92 550000 13,66 600000 13,41 625000 13,22 650000 13,03 | :0 -10000 250000 -10000 250001 15,07 275000 15,01 300000 14,92 325000 14,83 350000 14,71 375000 14,58 400000 14,43 425000 14,3 450000 14,18 475000 14,05 500000 13,92 550000 13,66 600000 13,41 625000 13,22 650000 13,03 | ||
{{article end | |||
|seealso= | |||
*[[List of Demo Projects]] | |||
}} | |||
Latest revision as of 15:57, 25 January 2024
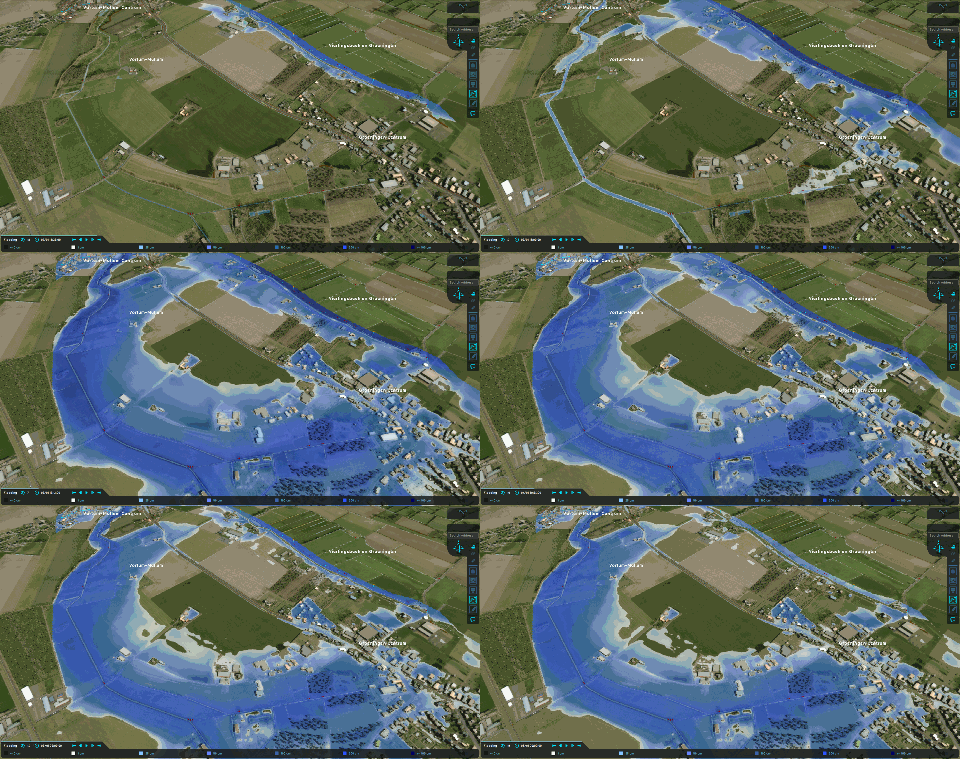
The demo project show a Flooding Overlay that simulates a river flooding over-topping a levee using multiple inlets.
The river level increases first and decreases later over time. It is modeled using several Inlets placed in front of a small levee in the elevation.
- Note that the inlet is placed in front (at a distance) of the levee with respect to the river, instead of on top of the levee.
- Inlet first increases the lower threshold to simulate a rising water level. After a few days, the rising stops after 250000 seconds and the lower threshold is set to -10000 (NO_DATA). Furthermore, an upper threshold is used to simulate a lowering water level. This upper thresholds starts with -10000 (NO_DATA) and only activates after 250001 seconds.
- For example:
- LOWER_THRESHOLD
- 0 13,59 25000 13,86 50000 14,05 75000 14,28 100000 14,48 125000 14,67 150000 14,86 175000 14,96 200000 15,04 225000 15,06 250000 15,07 250001 -10000
- UPPER_THRESHOLD
- 0 -10000 250000 -10000 250001 15,07 275000 15,01 300000 14,92 325000 14,83 350000 14,71 375000 14,58 400000 14,43 425000 14,3 450000 14,18 475000 14,05 500000 13,92 550000 13,66 600000 13,41 625000 13,22 650000 13,03
