Density indicators: Difference between revisions
Jump to navigation
Jump to search
| Line 28: | Line 28: | ||
==Additional configurations== | ==Additional configurations== | ||
For this indicator to function, no additional configurations are needed. | For this indicator to function, no additional configurations are needed. | ||
However, | However, extra Overlays can be made to make the indicator also visual. | ||
Below the steps on how to create the overlay: | Below the steps on how to create the overlay: | ||
{{Editor steps|title=|Select ''Geo Data'" and then ''Overlays'' in the ribbon header|Add the Avg overlay| In the right panel, give the overlay the name FSI| Click on the Configuration Wizard| Choose: gain insight into grid cell values|Click on select and choose the FSI attribute| Choose Specific layer only and then the neighborhood layer| Finish the wizard| Now the overlay is created| Follow the same steps for the GSI and OSR overlay.}} | {{Editor steps|title=|Select ''Geo Data'" and then ''Overlays'' in the ribbon header|Add the Avg overlay| In the right panel, give the overlay the name FSI| Click on the Configuration Wizard| Choose: gain insight into grid cell values|Click on select and choose the FSI attribute| Choose Specific layer only and then the neighborhood layer| Finish the wizard| Now the overlay is created| Follow the same steps for the GSI and OSR overlay.}} | ||
Revision as of 15:48, 15 March 2019
General
What are the Density indicators?
The Density indicators exists of three indices which define density in an area. These are:
- FSI - Floor Space Index; which gives information about the intensity of the buildings in relation to the open space. The higher the index is, the more buildings and/or floors there are.
- GSI - Ground Space Index; which gives information about the relation between built and open space. The lower the index is, the more open space there is in the area.
- OSR - Open Space Ration; which gives information about the spaciousness and pressure on the open space. An high FSI ensures a low OSR. The higher the OSR is, the more open space there is.
This indicator is useful for projects where for example:
- Density analysis is an important aspect of the project
- a new neighborhood is designed
Indicator panel

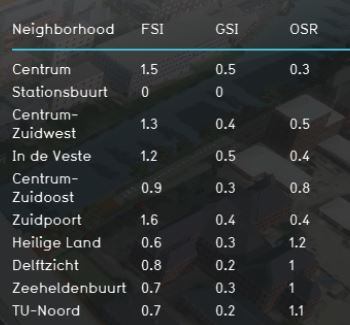
The indicator panel shows per neighborhood:
- the neighborhood name
- FSI score
- GSI score
- OSR score
Calculation
Score
For this indicator no score is being calculated. The progress bar shows always 100% (fixed number).
Additional configurations
For this indicator to function, no additional configurations are needed. However, extra Overlays can be made to make the indicator also visual. Below the steps on how to create the overlay:
Density indicators:
- Select Geo Data'" and then Overlays in the ribbon header
- Add the Avg overlay
- In the right panel, give the overlay the name FSI
- Click on the Configuration Wizard
- Choose: gain insight into grid cell values
- Click on select and choose the FSI attribute
- Choose Specific layer only and then the neighborhood layer
- Finish the wizard
- Now the overlay is created
- Follow the same steps for the GSI and OSR overlay.