Excel Indicator: Difference between revisions
| Line 31: | Line 31: | ||
If the Explanation Text contains more ''n'' ''%s'' variables, <code>VAR_0</code> to <code>VAR_(n-1)</code> should be present as named cells. The first ''%s'' will be replaced by the output of the call named <code>VAR_0</code>, the second ''%s'' with <code>VAR_1</code>, and the ''n %s'' will be replaced with <code>VAR_(n-1)</code>. | If the Explanation Text contains more ''n'' ''%s'' variables, <code>VAR_0</code> to <code>VAR_(n-1)</code> should be present as named cells. The first ''%s'' will be replaced by the output of the call named <code>VAR_0</code>, the second ''%s'' with <code>VAR_1</code>, and the ''n %s'' will be replaced with <code>VAR_(n-1)</code>. | ||
<br clear=all> | <br clear=all> | ||
<gallery mode="nolines"> | <gallery mode="nolines"> | ||
Revision as of 10:41, 11 August 2015
Excel Indicator
The Excel Indicator is an indicator that uses a Microsoft Excel File to perform calculations. Spatial information can be send to an uploaded Excel spread sheet and score and explanation information is retrieved from the file to be displayed in the project main view.
Please note that the full version of Microsoft Excel is required and the file format used is the xlsx-format. Also, we can not guarantee that other (open source and online) packages offer the same functionality as the full version of Microsoft Excel, such as the naming of cells and expandable entry fields for longer cell names.
How is the Excel Indicator implemented in the Tygron Engine?
The Tygron Engine uses spatial data sets from different sources. If this data set contains information that can be retrieved with a query, a dedicated indicator can be created by the user to process this data, in the form of an (xlsx) Excel Spread Sheet. A change in the project state provides input to the indicator, the indicator spread sheet performs calculations based on this input and displays the result as output in the indicator and progress panel on the top bar.

To better understand the implementation of the Excel Indicator, please read the Prerequisites and Quickstart sections below.
Prerequisites
In order for the Excel indicator to work, the spread sheet must contain the following:
- A cell named
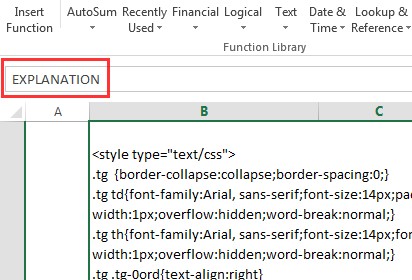
EXPLANATION, containing a text string or (html-) table to display the indicator output.
And either one of these two options:
- A cell named
SCORE
Or
- Cells named
SCORE_MAQUETTEANDSCORE_CURRENT
The Explanation Text in the EXPLANATION cell can contain the variables %s, which will be replaced by cells named:
VAR_0VAR_1VAR_2, and so on...
If the Explanation Text contains more n %s variables, VAR_0 to VAR_(n-1) should be present as named cells. The first %s will be replaced by the output of the call named VAR_0, the second %s with VAR_1, and the n %s will be replaced with VAR_(n-1).
EXPLANATION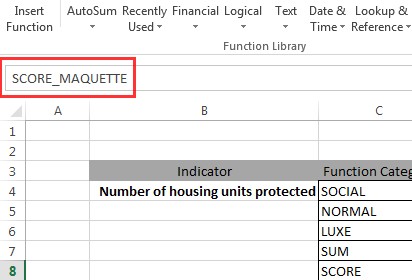
SCORE_MAQUETTE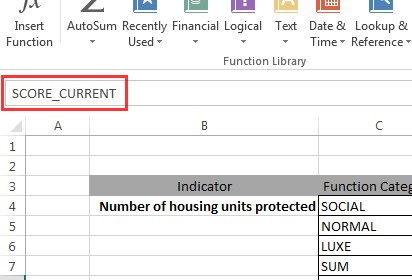
SCORE_CURRENT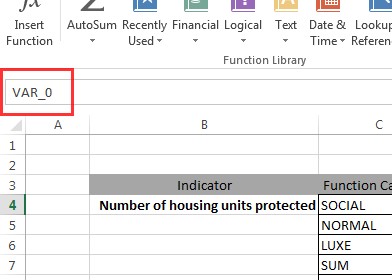
VAR_0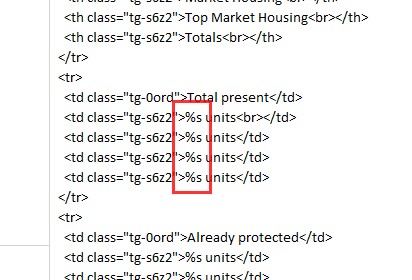
%s variable


Upload an Excel file
To upload an Excel for the Excel Indicator, please click on the upload button and select the Excel file in the file chooser that pops up. A file with the same name can be uploaded over and over again, the file will simply replace the previous one.
Quick Start
This section contains a short quick start on how to create an excel that will be able to perform as an Excel Indicator in the Tygron Engine.
Example Setup
First create a new blank Excel, or use an existing one. In the image below you can see a created Excel with Function Categories. As an example, we are interested in calculating the percentage per construction type that are within a safe zone. In the Tygron Engine, a Terrain with the type Safe Zone has already been created.
Naming Cells
In order to get the amount of Floor Space of constructions within the SafeZone, a Cell can be given a particular Name:
The Name is shown in the upper left text field in the Excel. This Name is actually a query command that can be interpreted by the Tygron Engine, also known as TQL. In this case it says:
SELECT_FLOORSIZE_WHERE_CATEGORY_IS_SOCIAL_AND_MAP_IS_MAQUETTE_AND_TERRAINTYPE_IS_SAFE_ZONE
This query is not hard to read or understand. To retrieve the total amount of Affordable (Social) Housing, the query is as followed:
SELECT_FLOORSIZE_WHERE_CATEGORY_IS_SOCIAL_AND_MAP_IS_MAQUETTE
Also see the image below:
Name Manager
The naming of cells should be done carefully, because making a mistake here will result in an error during the calculation of the Excel Indicator. Also note that, once a cell has been named, the Microsoft Excel Name Manager must be used to edit the name of the cell. This Name Manager can be opened as followed:

Here you can find all defined names in your Excel and to what cells they refer. If you want to edit a cell name, click on the Edit Button. The following panel will appear:
Fixing Name Problems
In this panel you can edit both the name as the cell it refers to. This is the easiest way to correct a label. Note that you can also refer two labels to the same cell, something that happens quite often during renaming. The image below shows a Cell with two references. Both a MAQUETTE as a CURRENT query are referring to the same cell. One will override the other and the order is unpredictable. Make sure you resolve these issues. You can delete the name, or let it refer to another cell.
Generate Scores and Explanations
In order to generate scores and explanations, you need to have either one named cell: SCORE, or two named cells: SCORE_CURRENT and SCORE_MAQUETTE. In Planning games, the SCORE_MAQUETTE is most used, in TimeLine games both are important to indicate the difference between the planned situation and the current situation.
- Excel quick start 7.jpg
- Excel quick start 8.jpg
Last but not least is the explanation. This is the text shown in the lower left corner of the Indicator panel during a game session. The explanation text can be written in html format. The cell should be named EXPLANATION. Note that when using explanation texts, you also want to include numbers and or text calculated by your excel. You can include '%s' values, which will be replaced by VAR_# cells, starting from VAR_0. See also #Prerequisites.
Tips
- Divisions by zero can be solved as followed:
=C2/IF(D2,D2,1). In this example cells C2 and D2 contain number values. - Instead of using the VAR_# method for the explanation text, you can also use the concatenate function of excel:
CONCATENATE("<nowiki>
",A2, ": ", E2, " m2 and in Safe Zone: ", F2, " m2
")