Excel Indicator: Difference between revisions
| Line 193: | Line 193: | ||
[[File:ExcelScorePlanned-Q3-2015.jpg|left]] | [[File:ExcelScorePlanned-Q3-2015.jpg|left]] | ||
<br clear=all> | |||
===Explanation=== | ===Explanation=== | ||
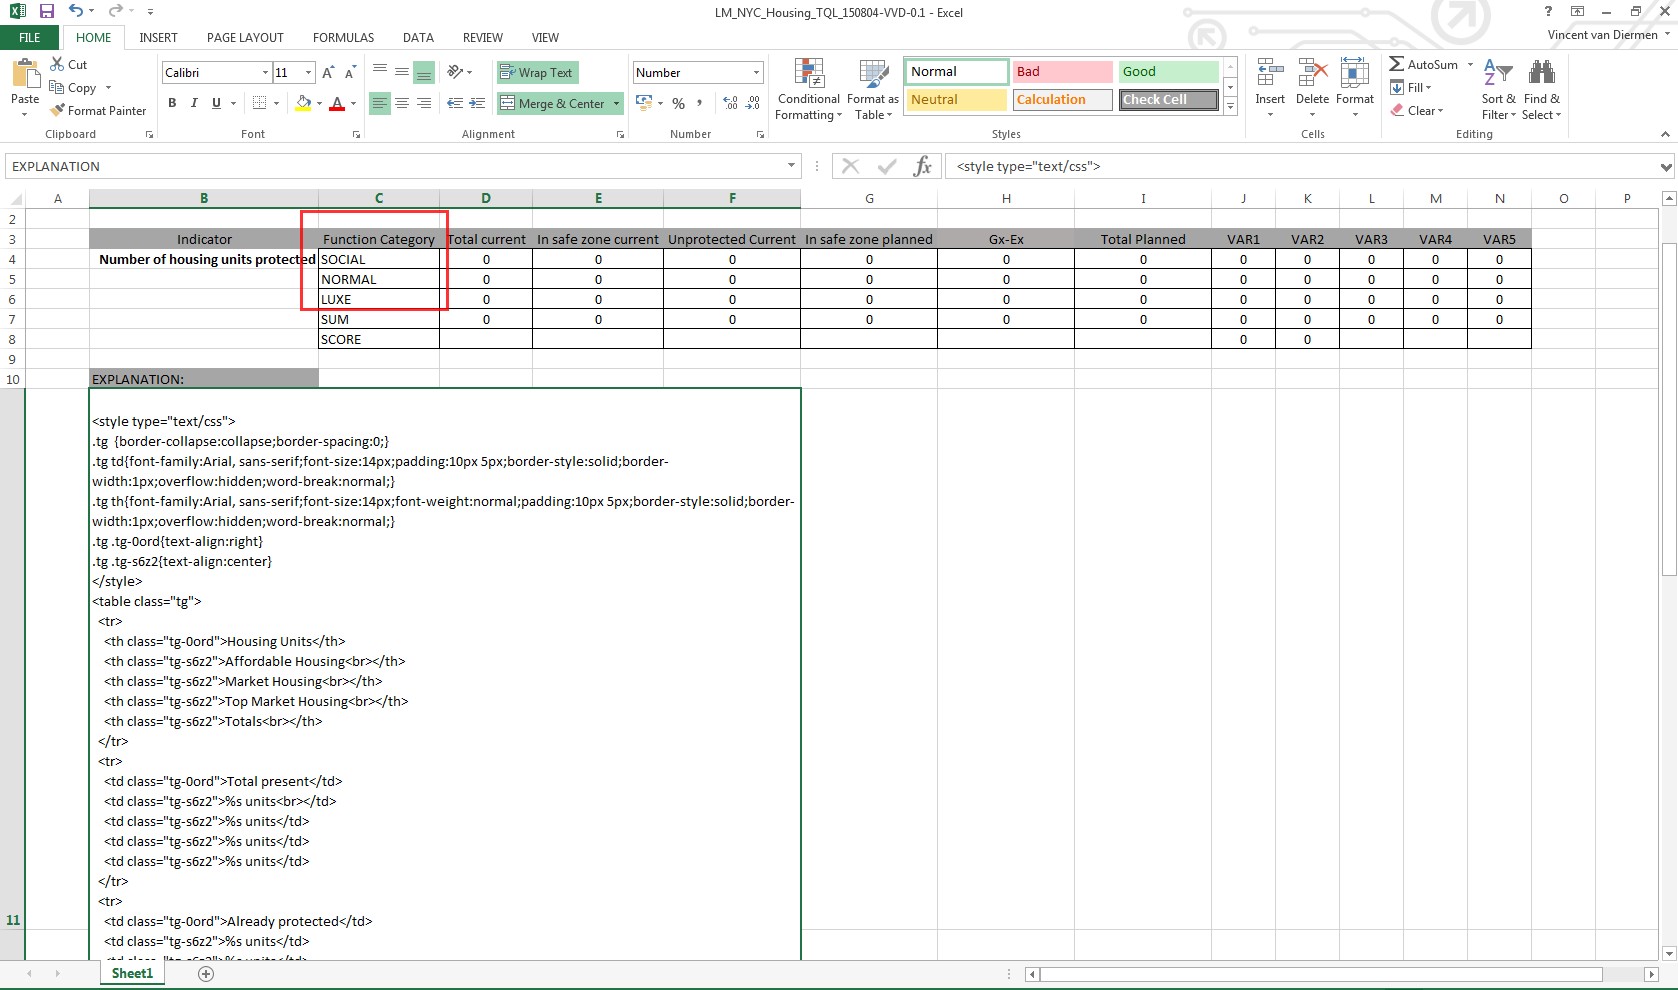
Last but not least is the explanation. This is the text shown in the lower left corner of the Indicator panel during a game session. The explanation text can be written in html format. The cell should be named <code>EXPLANATION</code>. Note that when using explanation texts, you also want to include numbers and or text calculated by your excel. You can include '%s' values, which will be replaced by <code>VAR_#</code> cells, starting from <code>VAR_0</code>. See also [[#Prerequisites]]. | Last but not least is the explanation. This is the text shown in the lower left corner of the Indicator panel during a game session. The explanation text can be written in html format. The cell should be named <code>EXPLANATION</code>. Note that when using explanation texts, you also want to include numbers and or text calculated by your excel. You can include '%s' values, which will be replaced by <code>VAR_#</code> cells, starting from <code>VAR_0</code>. See also [[#Prerequisites]]. | ||
Revision as of 09:24, 12 August 2015
Excel Indicator
The Excel Indicator is an indicator that uses a Microsoft Excel File to perform calculations. Spatial information can be send to an uploaded Excel spreadsheet and score and explanation information is retrieved from the file to be displayed in the project main view.
Please note that the full version of Microsoft Excel is required and the file format used is the xlsx-format. Also, we can not guarantee that other (open source and online) packages offer the same functionality as the full version of Microsoft Excel, such as the naming of cells and expandable entry fields for longer cell names.
How is the Excel Indicator implemented in the Tygron Engine?
The Tygron Engine uses spatial data sets from different sources. If this data set contains information that can be retrieved with a query, a dedicated indicator can be created by the user to process this data, in the form of an (xlsx) Excel spreadsheet. A change in the project state provides input to the indicator, the indicator spreadsheet performs calculations based on this input and displays the result as output in the indicator and progress panel on the top bar.

To better understand the implementation of the Excel Indicator, please read the Prerequisites and Getting Started sections below.
Prerequisites
In order for the Excel indicator to work, the spreadsheet must contain the following:
- A cell named
EXPLANATION, containing a (html-) text string or table to display the indicator output.
And either one of these two options:
- A cell named
SCORE
Or
- Cells named
SCORE_MAQUETTEandSCORE_CURRENT
The Explanation Text in the EXPLANATION cell can contain the variables %s, which will be replaced by cells named:
VAR_0VAR_1VAR_2, and so on...
If the Explanation Text contains a total of n %s variables, VAR_0 to VAR_(n-1) should be present as named cells. The first %s will be replaced by the output of the call named VAR_0, the second %s with VAR_1, and the n %s will be replaced with VAR_(n-1). For instance, an explanation text containing 10 %s variables, will require cells named from VAR_0 to VAR_9.
As a rule of thumb, a cell must contain a name and/ or a value. The name can consist of a text string, such as EXPLANATION or SCORE, a variable designation (VAR_#) or a query (SELECT_UNITS_WHERE_CATEGORY_IS_SOCIAL_AND_MAP_IS_CURRENT) in order to load data from the project. Cell values can consist of actual values or text strings, a reference to the value of another cell, or formulas that return a processed value as output.
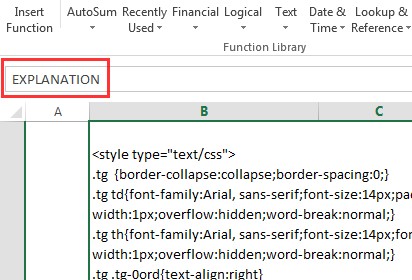
EXPLANATION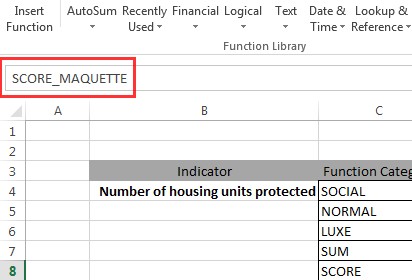
SCORE_MAQUETTE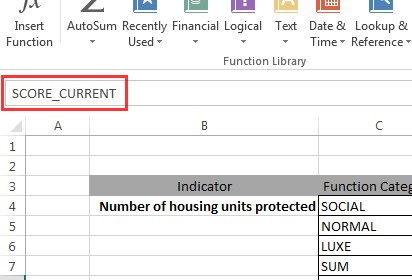
SCORE_CURRENT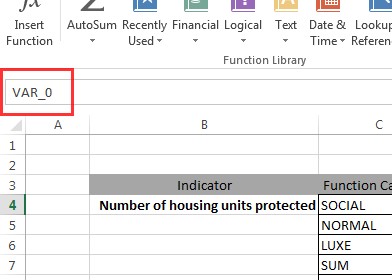
VAR_0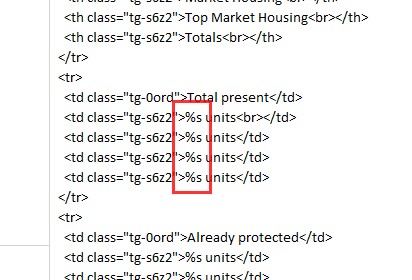
%svariable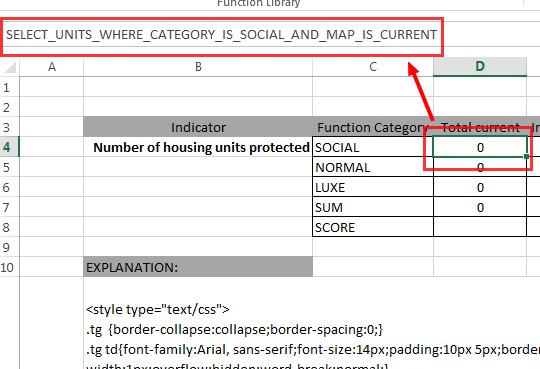
Query as name
String as value
Formula as value


Getting Started
This section contains a tutorial on how to create a spreadsheet that will be able to perform as an Excel Indicator in the Tygron Engine. We will go through this process step-by-step with a use case in Lower Manhattan (New York, USA) dealing with flood hazard and safe zones. The indicator will score on the amount of housing units protected, both before and after implementing flood protection measures, such as levees and barriers.
Example Setup
First create a new blank Excel workbook/ spreadsheet. In the image below you can see a spreadsheet with Function Categories. For the Lower Manhattan use case we are interested in calculating the amount of housing units per construction type, that are protected within a safe zone. In the Tygron Engine, a project, situated around Lower Manhattan, containing a Safe Zone Terrain has already been created. The Safe Zone terrain has been imported from ArcGIS, based on the National Flood Hazard Layer (NFHL) from the Federal Emergency Agency (FEMA).
Spreadsheet with function categories

Lower Manhattan project with Safe Zone terrain


Naming Cells
To let the spreadsheet read the amount of housing units within the Safe Zone from the project, a cell must be given a specific name. The name field is shown in the upper left corner of the spreadsheet. The name given in this example is actually a query command that can be interpreted by the Tygron Engine. Such queries use the Tygron Query Language (TQL).
In this case it says:
SELECT_UNITS_WHERE_CATEGORY_IS_SOCIAL_AND_MAP_IS_MAQUETTE_AND_TERRAINTYPE_IS_SAFE_ZONE
This query is not hard to read or understand;
Select all units > of the social (affordable) housing category > that are planned > in the protected area.
For another example, to retrieve the total amount of both protected and unprotected Affordable Housing in the area, the query reads as follows:
SELECT_UNITS_WHERE_CATEGORY_IS_SOCIAL_AND_MAP_IS_MAQUETTE
To assist in configuring these queries, a Query Tool is available in the Tygron Engine editor. This tool also aids in testing queries.
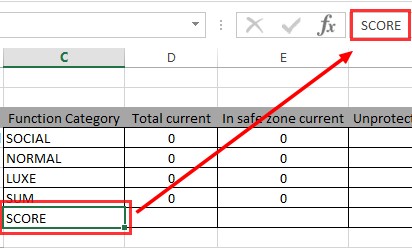
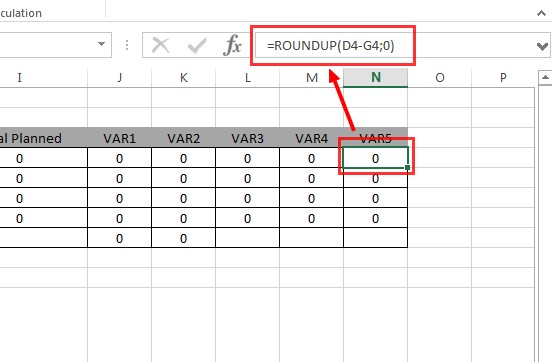
We start in a cell by creating a column of function categories, containing entries for affordable housing (SOCIAL), normal housing (NORMAL), top market housing (LUXE), SUM and SCORE. After this column we add the following columns: Total current, In safe zone current, Unprotected current, In safe zone planned, Gx-Ex, Total planned, VAR1, VAR2, VAR3, VAR4 and VAR5.
| Indicator | Function Category | Total current | In safe zone current | Unprotected Current | In safe zone planned | Gx-Ex | Total Planned | VAR1 | VAR2 | VAR3 | VAR4 | VAR5 |
|---|---|---|---|---|---|---|---|---|---|---|---|---|
| Number of housing units protected | SOCIAL | 0 | 0 | 0 | 0 | 0 | 0 | 0 | 0 | 0 | 0 | 0 |
| NORMAL | 0 | 0 | 0 | 0 | 0 | 0 | 0 | 0 | 0 | 0 | 0 | |
| LUXE | 0 | 0 | 0 | 0 | 0 | 0 | 0 | 0 | 0 | 0 | 0 | |
| SUM | 0 | 0 | 0 | 0 | 0 | 0 | 0 | 0 | 0 | 0 | 0 | |
| SCORE | - | - | - | - | - | - | 0 | 0 | - | - | - |
Please note that all the zeroes refer to the default state. The above example is not uploaded to the project yet.
Editing Named Cells
The naming of cells should be done carefully, because any mistake here will result in an error during the calculation of the Excel Indicator. Once a cell has been named, the Microsoft Excel Name Manager must be used to edit or remove the name of the cell. The Name Manager can be opened as follows; select Formulas > Defined Names > Name Manager.
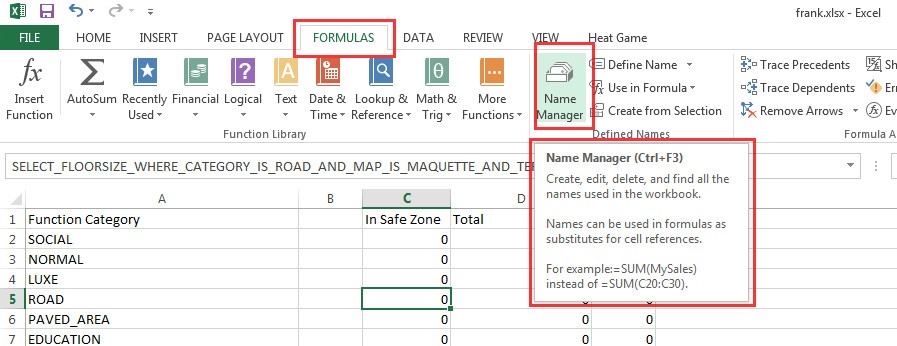
How to open the Excel Name Manager
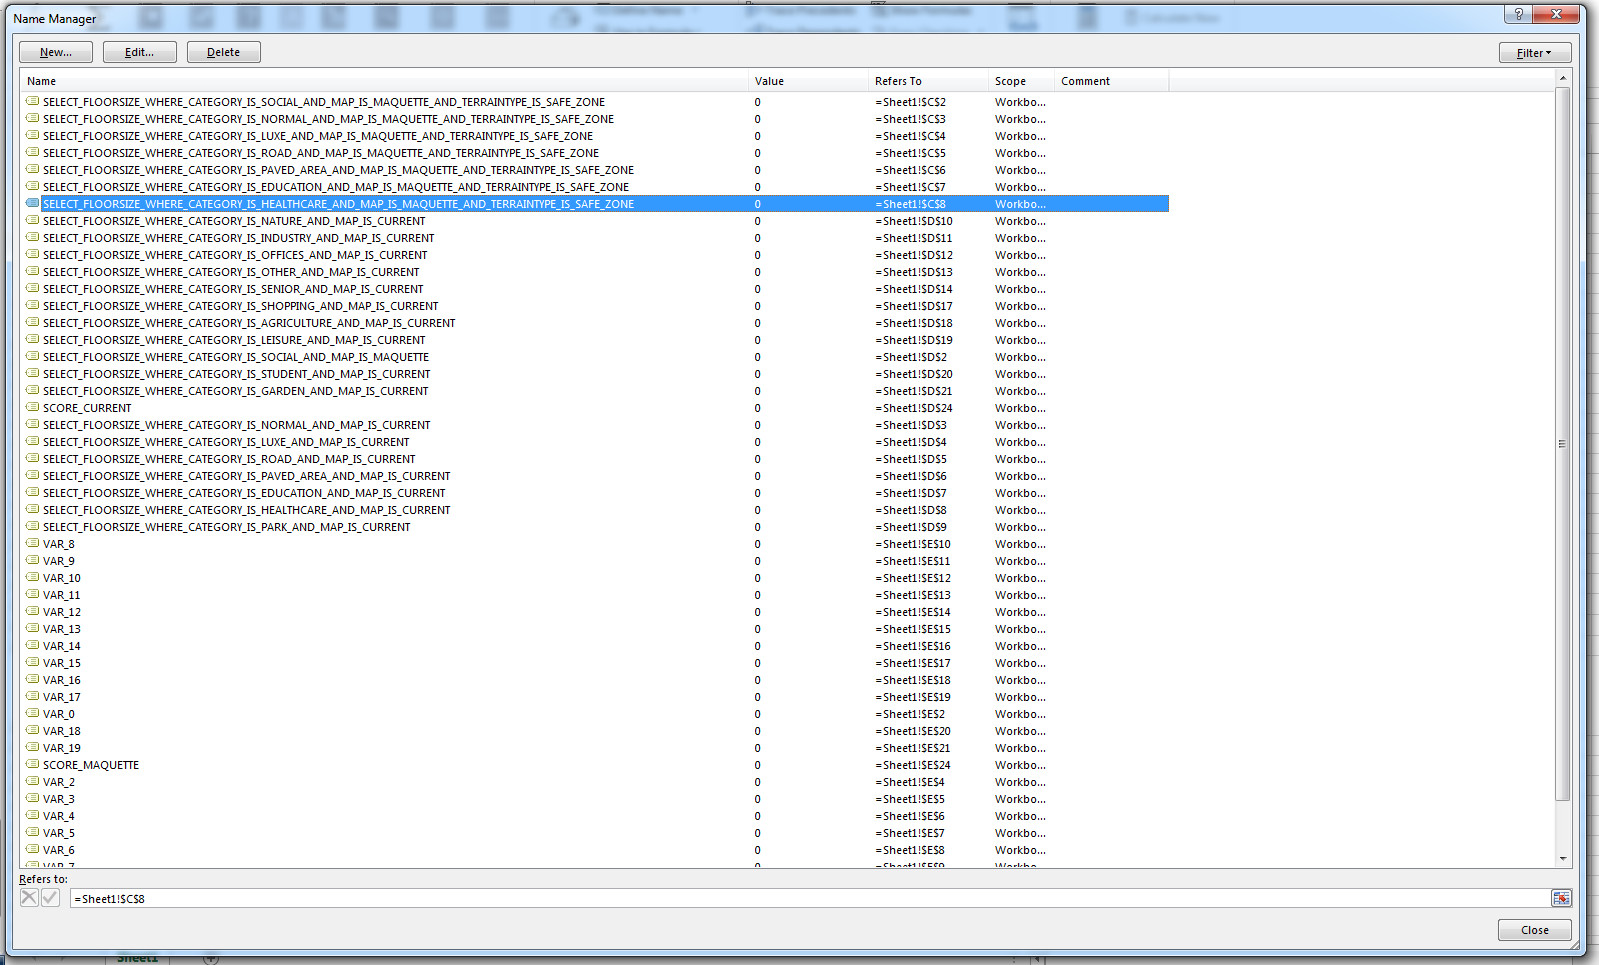
Excel Name Manager panel

On the Excel Name Manager panel you can find all defined names in the workbook and to what cells these names refer. If you want to edit a cell name, highlight it and select the Edit Button. The following panel will then appear:

To delete a cell name, highlight the entry and select Delete. A message will ask for confirmation.

You can even select multiple entries at once, by pressing the Shift key when selecting. This can be very convenient when rearranging all VAR_# entries for instance.

Fixing Name Problems
In the Name Manager panel you can edit both the name as the cell it refers to. This is the easiest way to correct a naming issue. It is possible to (incorrectly) refer two or more labels to the same cell, as the image below shows. Both a MAQUETTE as a CURRENT query are referring to the same cell. One will override the other and the order is unpredictable. Please make sure to resolve these issues. You can delete the name, or let it refer to another cell.

Indicator Scores
To be able to generate scores from the Excel indicator, there needs to be either one cell named SCORE, or two cells named SCORE_CURRENT and SCORE_MAQUETTE. In Planning Games, only SCORE (or SCORE_MAQUETTE) are used. In Time Line games both SCORE_CURRENT and SCORE_MAQUETTE queries are used to indicate the difference between the planned outcome and the current situation.

Explanation
Last but not least is the explanation. This is the text shown in the lower left corner of the Indicator panel during a game session. The explanation text can be written in html format. The cell should be named EXPLANATION. Note that when using explanation texts, you also want to include numbers and or text calculated by your excel. You can include '%s' values, which will be replaced by VAR_# cells, starting from VAR_0. See also #Prerequisites.
Tips
- Divisions by zero can be solved as followed:
=C2/IF(D2,D2,1). In this example cells C2 and D2 contain number values. - Instead of using the VAR_# method for the explanation text, you can also use the concatenate function of excel:
CONCATENATE("<p>",A2, ": ", E2, " m2 and in Safe Zone: ", F2, " m2</p>")
Upload an Excel file
To upload an Excel for the Excel Indicator, please click on the upload button and select the Excel file in the file chooser that pops up. A file with the same name can be uploaded over and over again, the file will simply replace the previous one.