Freatic groundwater levels benchmark (Water Module): Difference between revisions
Jump to navigation
Jump to search
(Created page with "This testcase simulates a situation where a parcel of land is situated between two waterways, each with a stable but different water level. In combination with continuous rain...") |
|||
| Line 27: | Line 27: | ||
===References=== | ===References=== | ||
<references> | <references> | ||
<ref name=" | <ref name="Bear79"> Bear, J., 1979. Hydraulics of Groundwater. McGraw-Hill. (formula on p.180, equation 5-212)</ref> | ||
</references> | </references> | ||
{{Water Module buttons}} | {{Water Module buttons}} | ||
Revision as of 15:39, 14 December 2020
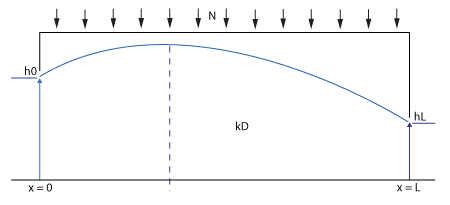
This testcase simulates a situation where a parcel of land is situated between two waterways, each with a stable but different water level. In combination with continuous rainfall, a characteristic curve will form over time, as shown in the image below.
Formulas
Due to continuous rainfall and two stable water levels left and right, a specific ground water table curve will form. Part of the rainwater will flow left and part of the it will flow right. Note that the time at which this balance occurs is dependent on the starting situation.
The following formula [1] describes the curve when the ground water levels have become stable:
where:
- : distance of the left waterway edge (m)
- : water level at x = 0 (m)
- : water level at x = L (m)
- : distance between both waterways (m)
- : horizontal infiltration speed (m / day)
- : additional ground water (m/day). Note that this is the amount of rain divided by the freatic storage capacity.
Setup
The following setup has been taken from grondwaterformules.nl
Results
References
- ↑ Bear, J., 1979. Hydraulics of Groundwater. McGraw-Hill. (formula on p.180, equation 5-212)


