Top bar: Difference between revisions
No edit summary Tag: Reverted |
No edit summary Tag: Reverted |
||
| Line 4: | Line 4: | ||
</gallery>}} | </gallery>}} | ||
The top bar is the large element at the top of the [[User Interface]]. Displayed, in order from left to right, are the [[Domain#Logo|Domain logo]], the [[stakeholders|stakeholder]] name, the time, the display mode, and the [[indicators]]. When the Domain logo is pressed, the credits of the project are displayed. The logo will also start flashing red when the computer has trouble maintaining a connection with the {{software}} server. The stakeholder name indicates which role the user has selected, and thus which party they represent during the session. They can click the name of the stakeholder to view descriptions of other stakeholders. The time indicates how long the simulation has been running so far. The display mode allows you to switch between seeing the project in the 3D Visualization as it currently is and, for planning based projects, how it was at the start of the session. | The top bar is the large element at the top of the [[User Interface]]. Displayed, in order from left to right, are the [[Domain#Logo|Domain logo]], the [[stakeholders|stakeholder]] name, the time, the display mode, and the [[indicators]]. When the Domain logo is pressed, the credits of the project are displayed. The logo will also start flashing red when the computer has trouble maintaining a connection with the {{software}} server. The stakeholder name indicates which role the user has selected, and thus which party they represent during the session. They can click the name of the stakeholder to view descriptions of other stakeholders. The time indicates how long the simulation has been running so far. The display mode allows you to switch between seeing the project in the 3D Visualization as it currently is and, for planning based projects, how it was at the start of the session. | ||
The right section of the top bar is entirely filled with indicators. Each indicator shows the current amount of progress made on that indicator towards the target set for it. By hovering over the indicators, you can see the full name of the indicator and the current score on the indicator. | The right section of the top bar is entirely filled with indicators. Each indicator shows the current amount of progress made on that indicator towards the target set for it. By hovering over the indicators, you can see the full name of the indicator and the current score on the indicator. | ||
{{Editor steps|preamble=|form=:*|title=Interacting with the Top Bar | {{Editor steps|preamble=|form=:*|title=Interacting with the Top Bar | ||
|Set the "Display" to "Original" to see the state of the project in the [[3D Visualization]] at the beginning of the [[session]]. | |||
|Set the "Display" to "Planned" to see the current state of the project in the [[3D Visualization]]. | |||
|Click on an indicator to open the [[indicator panel]]. | |||
{{article end | {{article end | ||
Revision as of 16:44, 30 January 2023
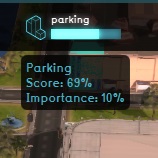
Hover over an indicator
- Interface game top bar - stakeholder description panel.jpg
Stakeholder description panel

The top bar is the large element at the top of the User Interface. Displayed, in order from left to right, are the Domain logo, the stakeholder name, the time, the display mode, and the indicators. When the Domain logo is pressed, the credits of the project are displayed. The logo will also start flashing red when the computer has trouble maintaining a connection with the Tygron Platform server. The stakeholder name indicates which role the user has selected, and thus which party they represent during the session. They can click the name of the stakeholder to view descriptions of other stakeholders. The time indicates how long the simulation has been running so far. The display mode allows you to switch between seeing the project in the 3D Visualization as it currently is and, for planning based projects, how it was at the start of the session.
The right section of the top bar is entirely filled with indicators. Each indicator shows the current amount of progress made on that indicator towards the target set for it. By hovering over the indicators, you can see the full name of the indicator and the current score on the indicator.
{{Editor steps|preamble=|form=:*|title=Interacting with the Top Bar |Set the "Display" to "Original" to see the state of the project in the 3D Visualization at the beginning of the session. |Set the "Display" to "Planned" to see the current state of the project in the 3D Visualization. |Click on an indicator to open the indicator panel.