UK Benchmark 3 (Water Module): Difference between revisions
No edit summary |
|||
| (22 intermediate revisions by 3 users not shown) | |||
| Line 1: | Line 1: | ||
This | This [[Water Module benchmarks|benchmark]] performs test case 3 of the UK benchmark <ref name="Néelz"/> | ||
named ''Test 3 – Momentum conservation over a small obstruction'' as well as its result generated by the [[Water Module]] in the {{software}}.__NOTOC__ | |||
''The objective of the test is to assess the package’s ability to conserve momentum over an obstruction in the topography. This capability is important when simulating sewer or pluvial flooding in urbanised floodplains. The barrier to flow in the channel is designed to differentiate the performance of packages without inertia terms and 2D hydrodynamic packages with inertia terms. With inertia terms some of the flood water will pass over the obstruction.'' | ''The objective of the test is to assess the package’s ability to conserve momentum over an obstruction in the topography. This capability is important when simulating sewer or pluvial flooding in urbanised floodplains. The barrier to flow in the channel is designed to differentiate the performance of packages without inertia terms and 2D hydrodynamic packages with inertia terms. With inertia terms some of the flood water will pass over the obstruction.'' | ||
| Line 5: | Line 6: | ||
==Description== | ==Description== | ||
''This test consists of a sloping topography with two depressions separated by an obstruction as illustrated in Figure (a & b). The dimensions of the domain are 300m longitudinally (X) x 100m transversally (Y). A varying inflow discharge, see Figure (c), is applied as an upstream boundary condition at the left-hand end, causing a flood wave to travel down the 1:200 slope. While the total inflow volume is just sufficient to fill the left-hand side depression at x=150m, some of this volume is expected to overtop the obstruction because of momentum conservation and settle in the depression on the right-hand side at x=250m. The model is run until time T=900s (15 mins) to allow the water to settle.'' | ''This test consists of a sloping topography with two depressions separated by an obstruction as illustrated in Figure (a & b). The dimensions of the domain are 300m longitudinally (X) x 100m transversally (Y). A varying inflow discharge, see Figure (c), is applied as an upstream boundary condition at the left-hand end, causing a flood wave to travel down the 1:200 slope. While the total inflow volume is just sufficient to fill the left-hand side depression at x=150m, some of this volume is expected to overtop the obstruction because of momentum conservation and settle in the depression on the right-hand side at x=250m. The model is run until time T=900s (15 mins) to allow the water to settle.'' | ||
Below is a plan and profile of the DEM used in Test 3. The area modeled is a perfect rectangle extending from X=0 to X=300m and from Y=0 to Y=100m as represented. | |||
[[File:Topdown_3_ukbm.png|left|frame|Fig. a: Top down situation.]] | [[File:Topdown_3_ukbm.png|left|frame|Fig. a: Top down situation.]] | ||
[[File:Side_3_ukbm.png|left|frame|Fig. b: Side view situation.]] | [[File:Side_3_ukbm.png|left|frame|Fig. b: Side view situation.]]<br style="clear:both"> | ||
: | |||
[[File:Influx_hydrograph_3_ukbm.png|left|frame|Fig. c: Inflow hydrograph used as upstream boundary condition.]] | [[File:Influx_hydrograph_3_ukbm.png|left|frame|Fig. c: Inflow hydrograph used as upstream boundary condition.]] | ||
<br style="clear:both"> | <br style="clear:both"> | ||
| Line 22: | Line 24: | ||
==Technical setup== | ==Technical setup== | ||
The provided ascii height file named | The provided ascii height file named test3DEM.asc is first imported. It has a cell size of 2m, while the test is expected to run on atleast a 5m grid. We actually ran it on a 4m grid. Therefore, it will be automatically rescaled by the [[Grid Rasterizer|grid rasterizer]]. The resulting rescaled asc file is packed in the {{anchor|test case zip}} down below. | ||
In order to regulate the water level according to the water level graph, we used the following setup: | In order to regulate the water level according to the water level graph, we used the following setup: | ||
On gridcells with x = 1 | On gridcells with x = 1 Inlet objects were placed. Each inlet had its own grid cell. The inlets were configured as: | ||
* External area (m2): 1 000 000 000; | * External area (m2): 1 000 000 000; | ||
| Line 31: | Line 33: | ||
* Threshold (m): none; | * Threshold (m): none; | ||
* Inlet Q (m): | * Inlet Q (m): | ||
[[File:inletq_case3_ukbm.png|thumb|left|x300px|Inlet influx graph used by the {{software}}]] | [[File:inletq_case3_ukbm.png|thumb|left|x300px|Inlet influx graph used by the {{software}}]]<br style="clear:both"> | ||
<br style="clear:both"> | |||
* Inlet locations: | * Inlet locations: | ||
[[File:inletpositions_case3_ukbm.png|thumb|left|x300px|Inlet positions and the black rectangle indicating the border cells. The heightmap outside the border rectangle is not inside the project area.]] | [[File:inletpositions_case3_ukbm.png|thumb|left|x300px|Inlet positions and the black rectangle indicating the border cells. The heightmap outside the border rectangle is not inside the project area.]] | ||
| Line 46: | Line 47: | ||
** Operating system: Linux 4.13 | ** Operating system: Linux 4.13 | ||
*Time increment used: adaptive: | *Time increment used: adaptive: | ||
*Grid resolution: | *Grid resolution: 4 m. (not 5 m, but it is at least 5 m) | ||
*Simulation time: 4 seconds for 450 timeframes | *Simulation time: 4 seconds for 450 timeframes | ||
*Inlet q M3: 1189 m<sup>3</sup> | *Inlet q M3: 1189.5 m<sup>3</sup> | ||
*Remaining volume water: | *Remaining volume water: 1189.5 m<sup>3</sup> | ||
Measured point graphs are displayed below: | Measured point graphs are displayed below: | ||
| Line 63: | Line 64: | ||
: Water levels for p2 generated by the {{software}} on the left and generated by others on the right. | : Water levels for p2 generated by the {{software}} on the left and generated by others on the right. | ||
</ul> | </ul> | ||
==Notes== | |||
* Issue: Inlet inputs less water with the many 2 second time frames: 1189 m<sup>3</sup> ( instead of 1310 m<sup>3</sup> with 1 timeframe ) | |||
==References== | |||
<references> | |||
<ref name="Néelz">Néelz, S., & Pender, G. (2013). Benchmarking the latest generation of 2D hydraulic modelling packages. Report: SC120002. Environment Agency, Horison House, Deanery Road, Bristol, BS1 9AH. ISBN: 978-1-84911-306-9. Retrieved from: https://www.gov.uk/government/publications/benchmarking-the-latest-generation-of-2d-hydraulicflood-modelling-packages </ref> | |||
</references> | |||
[[Category:Benchmarks]] | [[Category:Benchmarks]] | ||
{{Water Module buttons}} | |||
Latest revision as of 15:10, 5 March 2024
This benchmark performs test case 3 of the UK benchmark [1] named Test 3 – Momentum conservation over a small obstruction as well as its result generated by the Water Module in the Tygron Platform.
The objective of the test is to assess the package’s ability to conserve momentum over an obstruction in the topography. This capability is important when simulating sewer or pluvial flooding in urbanised floodplains. The barrier to flow in the channel is designed to differentiate the performance of packages without inertia terms and 2D hydrodynamic packages with inertia terms. With inertia terms some of the flood water will pass over the obstruction.
Description
This test consists of a sloping topography with two depressions separated by an obstruction as illustrated in Figure (a & b). The dimensions of the domain are 300m longitudinally (X) x 100m transversally (Y). A varying inflow discharge, see Figure (c), is applied as an upstream boundary condition at the left-hand end, causing a flood wave to travel down the 1:200 slope. While the total inflow volume is just sufficient to fill the left-hand side depression at x=150m, some of this volume is expected to overtop the obstruction because of momentum conservation and settle in the depression on the right-hand side at x=250m. The model is run until time T=900s (15 mins) to allow the water to settle.
Below is a plan and profile of the DEM used in Test 3. The area modeled is a perfect rectangle extending from X=0 to X=300m and from Y=0 to Y=100m as represented.


Boundary and initial conditions
- Inflow boundary condition along the dashed red line in Figure (a). Table provided as part of dataset.
- All other boundaries are closed.
- Initial condition: Dry bed.
Parameter values
- Manning’s n: 0.01 (uniform)
- Model grid resolution: 5m (or 1200 nodes in the area modeled)
- Time of end: the model is to be run until time t = 15 min
Technical setup
The provided ascii height file named test3DEM.asc is first imported. It has a cell size of 2m, while the test is expected to run on atleast a 5m grid. We actually ran it on a 4m grid. Therefore, it will be automatically rescaled by the grid rasterizer. The resulting rescaled asc file is packed in the down below.
In order to regulate the water level according to the water level graph, we used the following setup: On gridcells with x = 1 Inlet objects were placed. Each inlet had its own grid cell. The inlets were configured as:
- External area (m2): 1 000 000 000;
- Water level (m): 1;
- Threshold (m): none;
- Inlet Q (m):

- Inlet locations:

Output as required
- Software package used: Tygron Platform
- Numerical scheme: FV (Kurganov, Bollerman, Horvath)*
- Specification of hardware used to undertake the simulation:
- Processor: Intel Xeon @2.10GHz x 8,
- RAM 62.8 GiB,
- GPU: 2x NVidia 1080
- Operating system: Linux 4.13
- Time increment used: adaptive:
- Grid resolution: 4 m. (not 5 m, but it is at least 5 m)
- Simulation time: 4 seconds for 450 timeframes
- Inlet q M3: 1189.5 m3
- Remaining volume water: 1189.5 m3
Measured point graphs are displayed below:
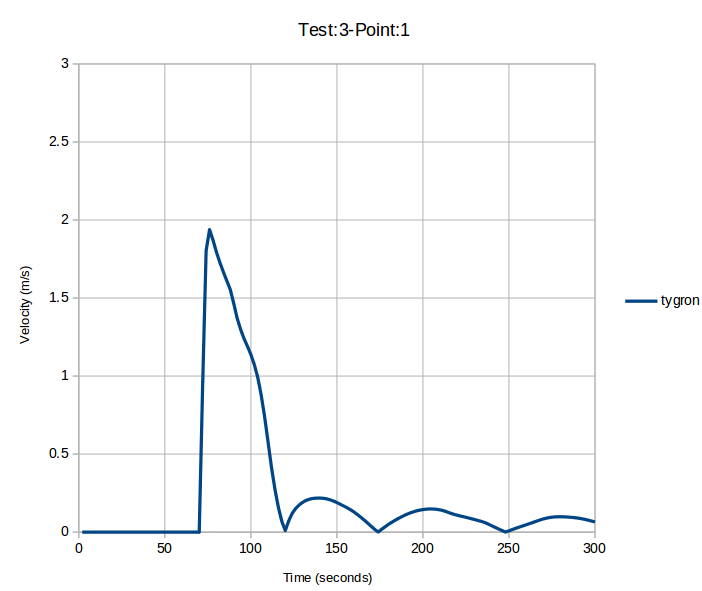
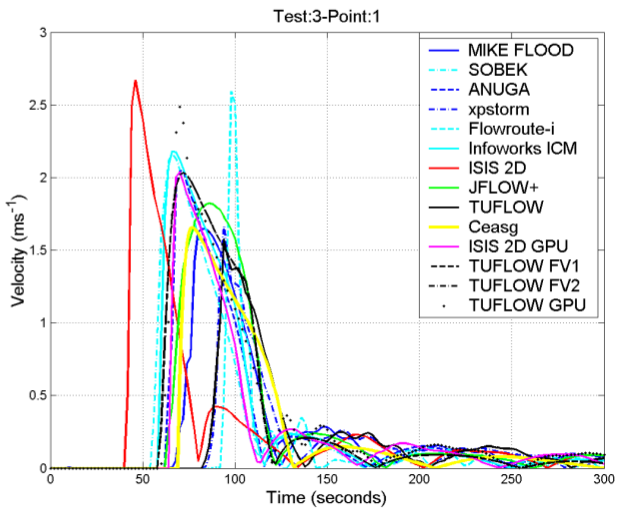
- Velocities at p1 generated by the Tygron Platform on the left and generated by others on the right.
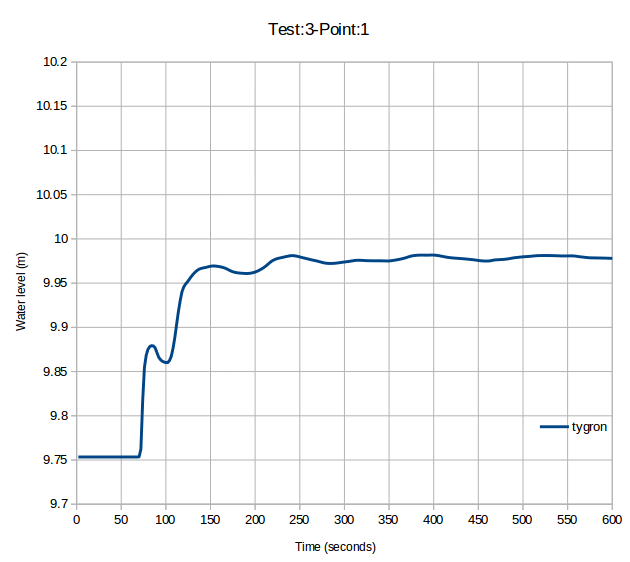
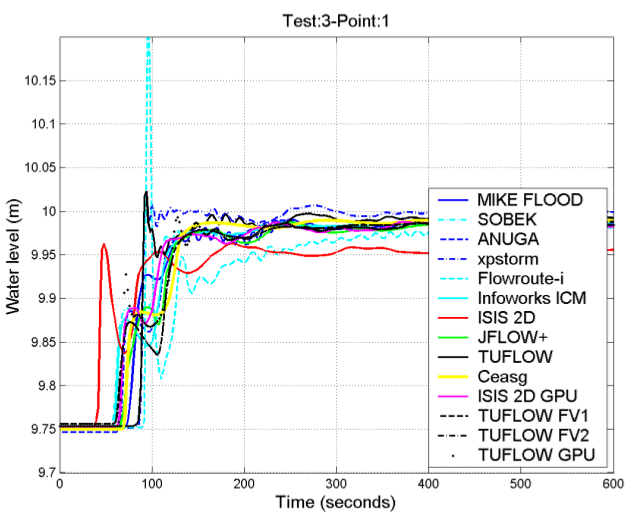
- Water levels for p1 generated by the Tygron Platform on the left and generated by others on the right.
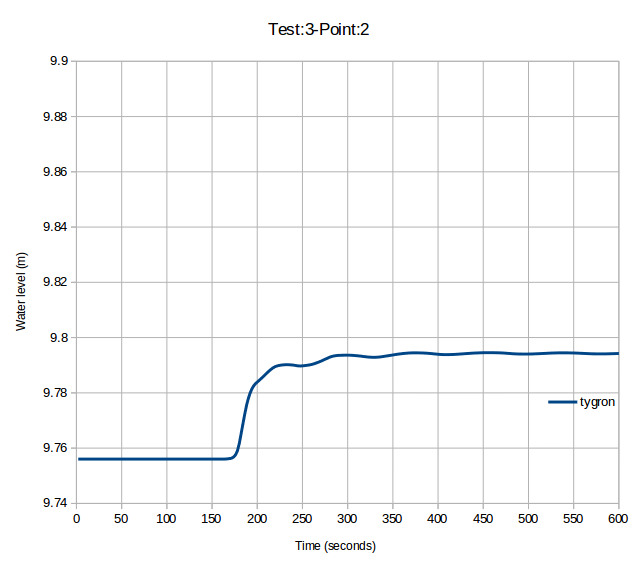
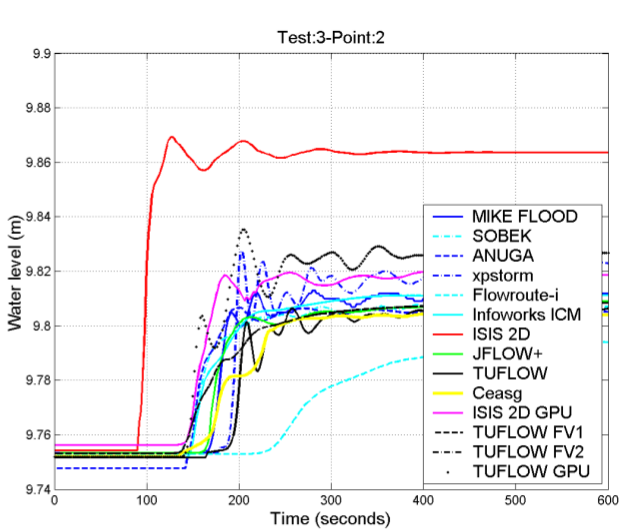
- Water levels for p2 generated by the Tygron Platform on the left and generated by others on the right.


Notes
- Issue: Inlet inputs less water with the many 2 second time frames: 1189 m3 ( instead of 1310 m3 with 1 timeframe )
References
- ↑ Néelz, S., & Pender, G. (2013). Benchmarking the latest generation of 2D hydraulic modelling packages. Report: SC120002. Environment Agency, Horison House, Deanery Road, Bristol, BS1 9AH. ISBN: 978-1-84911-306-9. Retrieved from: https://www.gov.uk/government/publications/benchmarking-the-latest-generation-of-2d-hydraulicflood-modelling-packages


