Neighborhoods Overlay: Difference between revisions
Jump to navigation
Jump to search
| Line 22: | Line 22: | ||
{{Editor steps|title=add the Neighborhood Overlay|Select in the editor 'Geo Data' from the ribbon|Select 'Overlays' from the ribbon bar|Select NEIGHBORHOODS from the option menu at the bottom of the [[left panel]]| Select 'Add' at the bottom of the [[left panel]]| Notice that the new Neighborhood Overlay has been added to the list of active overlays. }} | {{Editor steps|title=add the Neighborhood Overlay|Select in the editor 'Geo Data' from the ribbon|Select 'Overlays' from the ribbon bar|Select NEIGHBORHOODS from the option menu at the bottom of the [[left panel]]| Select 'Add' at the bottom of the [[left panel]]| Notice that the new Neighborhood Overlay has been added to the list of active overlays. }} | ||
<gallery> | |||
File:Geo_data.png|1. Select Geo Data | |||
File:Overlays.jpg|2. Select Overlays | |||
File:Neighborhood_option.jpg|3. Select desired overlay from drop down menu on the bottom of the [[left panel]] | |||
File:Add.jpg|4. Select 'Add' from the bottom of the [[left panel]] | |||
File:Neighborhoods_list.jpg|5. The overlay will now appear in the list of active overlays on the [[left panel]] | |||
</gallery> | |||
<br clear=all> | <br clear=all> | ||
{{Editor steps|title=remove the Neighborhood Overlay|Select in the editor 'Geo Data' from the ribbon|Select 'Overlays' from the ribbon bar|Select the desired overlay from the list of active overlays on the [[left panel]]|Select 'remove' from the bottom of the [[left panel]]|Confirm the removal in the pop up confirmation message}} | {{Editor steps|title=remove the Neighborhood Overlay|Select in the editor 'Geo Data' from the ribbon|Select 'Overlays' from the ribbon bar|Select the desired overlay from the list of active overlays on the [[left panel]]|Select 'remove' from the bottom of the [[left panel]]|Confirm the removal in the pop up confirmation message}} | ||
Revision as of 12:58, 8 October 2018
What the Neighborhoods Overlay is

The Neighborhood Overlay shows the division of the areas in neighborhoods and statistics concerning those areas.
The data used for this overlay is from the CBS Wijk- en Buurtkaart.
Additional information displayed in hover panel

When clicking on a specific location in the map, the hover panel gives additional information about the:
- name of the neighborhood
- the number of households
- the number of inhabitants
- the population density
- the coverage percentage
- the average household
Adding and removing
The Neigborhood overlay is added by default when creating a new project.
How to add the Neighborhood Overlay:
- Select in the editor 'Geo Data' from the ribbon
- Select 'Overlays' from the ribbon bar
- Select NEIGHBORHOODS from the option menu at the bottom of the left panel
- Select 'Add' at the bottom of the left panel
- Notice that the new Neighborhood Overlay has been added to the list of active overlays.
-
1. Select Geo Data
-
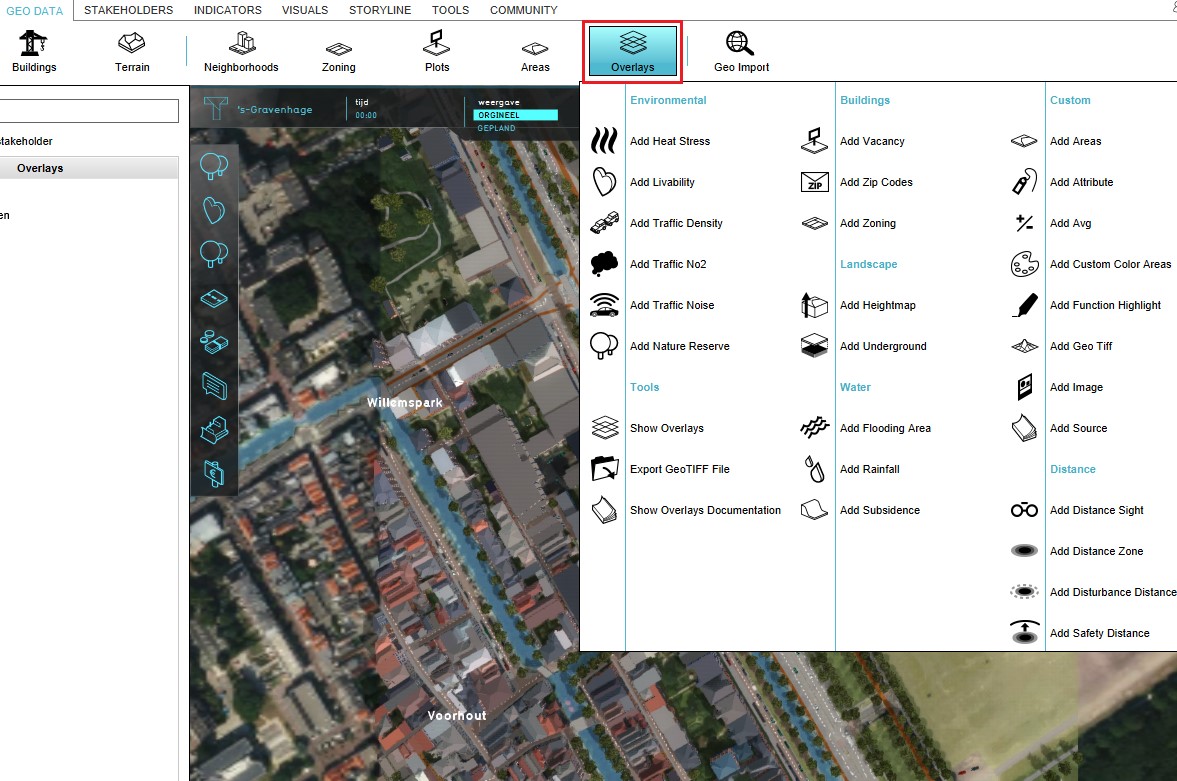 2. Select Overlays
 -
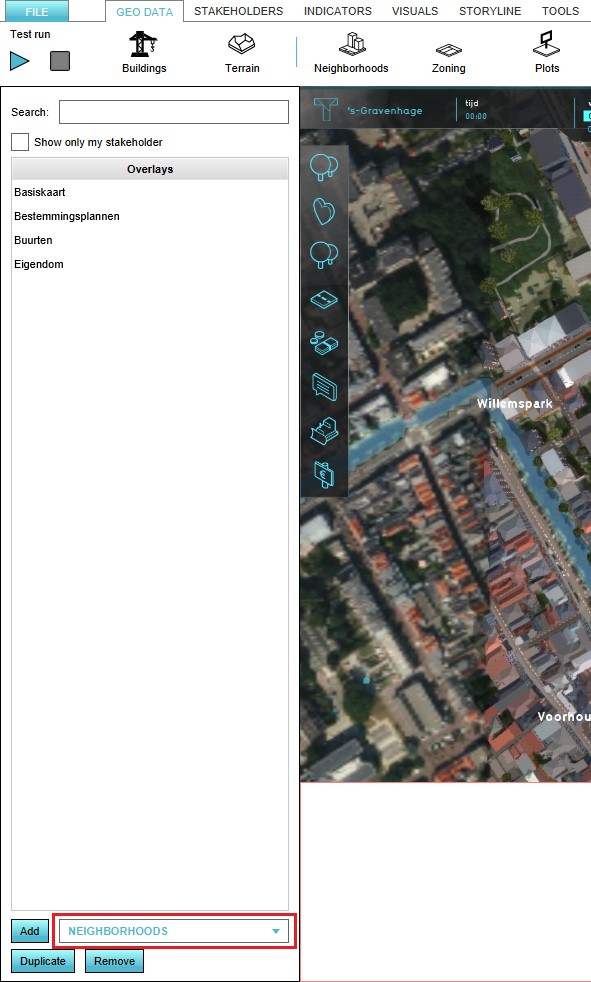 3. Select desired overlay from drop down menu on the bottom of the left panel
 -
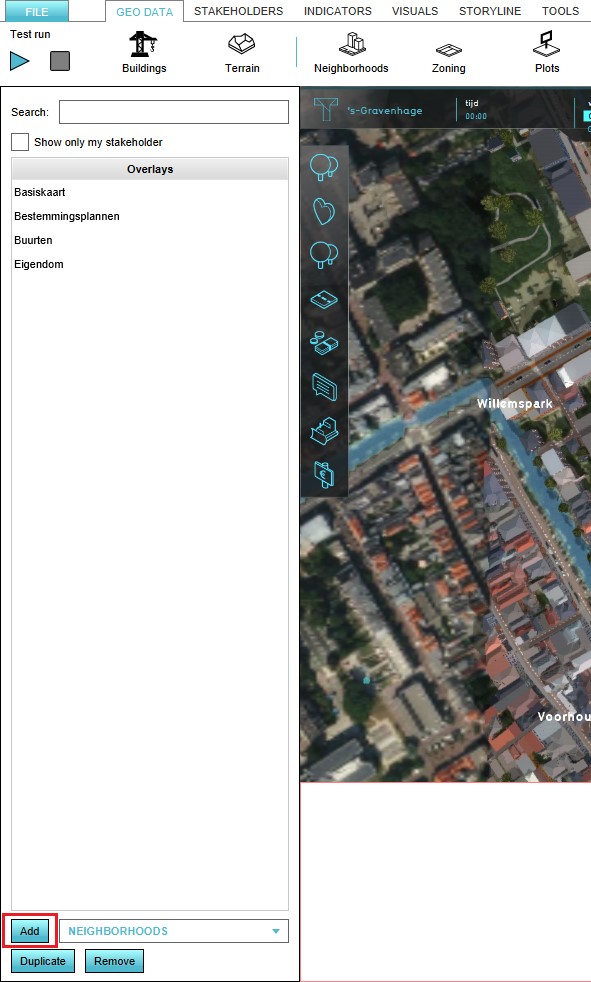 4. Select 'Add' from the bottom of the left panel
 -
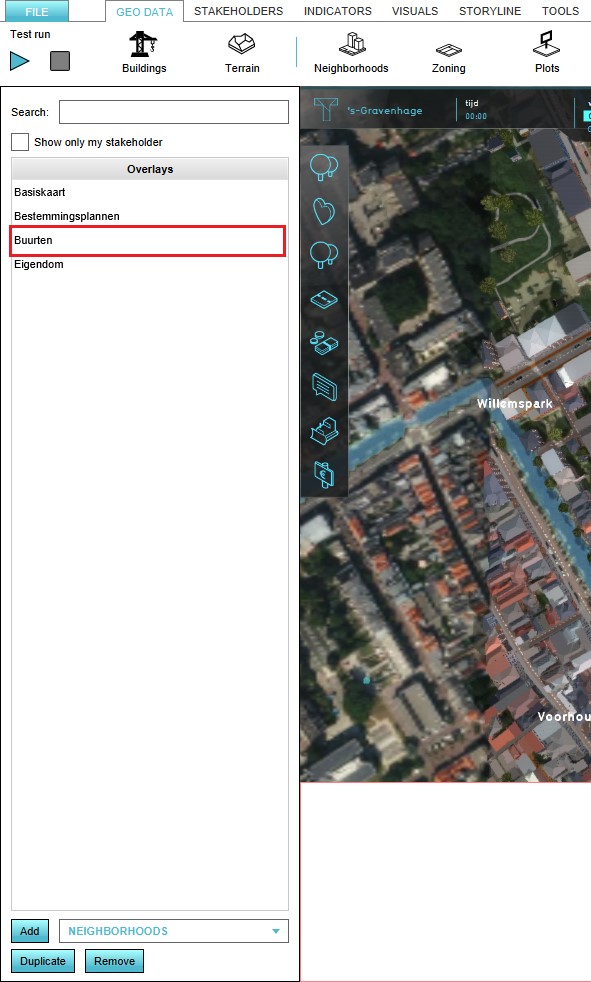 5. The overlay will now appear in the list of active overlays on the left panel


How to remove the Neighborhood Overlay:
- Select in the editor 'Geo Data' from the ribbon
- Select 'Overlays' from the ribbon bar
- Select the desired overlay from the list of active overlays on the left panel
- Select 'remove' from the bottom of the left panel
- Confirm the removal in the pop up confirmation message