Combo Overlay tutorial: Difference between revisions
mNo edit summary |
|||
| (7 intermediate revisions by the same user not shown) | |||
| Line 7: | Line 7: | ||
==Introduction to the Combo Overlay== | ==Introduction to the Combo Overlay== | ||
The [[Combo Overlay]] is a [[Grid Overlay]] which allows for the creation of custom spatial calculation models. It is comparable to raster calculators which can be found in other GIS packages such as | The [[Combo Overlay]] is a [[Grid Overlay]] which allows for the creation of custom spatial calculation models. It is comparable to raster calculators which can be found in other GIS packages such as [[QGIS]]. The principle on which it operates is that for each [[grid cell]], other [[Grid Overlay]]s may provide values, and the [[combo Overlay]] uniformly applies a (simple or complex) formula to compute a new resulting value for that [[grid cell]], and does so for all [[grid cell]]s. | ||
{{page break}} | |||
==Creating a simple masking calculation== | ==Creating a simple masking calculation== | ||
| Line 55: | Line 57: | ||
[[File:combo-overlay-tutorial-combo-2-small.jpg|350px|frame|center|The results of the [[Combo Overlay]] directly outputting the results of the [[Traffic Noise Overlay]].]] | [[File:combo-overlay-tutorial-combo-2-small.jpg|350px|frame|center|The results of the [[Combo Overlay]] directly outputting the results of the [[Traffic Noise Overlay]].]] | ||
Just like with the [[Traffic Noise Overlay]] itself, it is possible to click on any location in the [[ | {{page break}} | ||
Just like with the [[Traffic Noise Overlay]] itself, it is possible to click on any location in the [[3D Visualization]] and see the exact value calculated there. | |||
[[File:combo-overlay-tutorial-combo-2hover.jpg|350px|frame|center|The hover panel will display the name of the [[Combo Overlay]], and the value of that location.]] | [[File:combo-overlay-tutorial-combo-2hover.jpg|350px|frame|center|The hover panel will display the name of the [[Combo Overlay]], and the value of that location.]] | ||
Using the [[Combo Overlay]], it is possible to manipulate those calculated values. One often used principle is to "mask" data, which basically means to explicitly obscure or let through some values. | Using the [[Combo Overlay]], it is possible to manipulate those calculated values. One often used principle is to "mask" data, which basically means to explicitly obscure or let through some values. | ||
| Line 72: | Line 74: | ||
If ( IF ) it is true that A is greater than 55 ( GT ), in that case we use the value A. Otherwise, we return the value of NO_DATA, which is a constant meaning no value exists at that point. | If ( IF ) it is true that A is greater than 55 ( GT ), in that case we use the value A. Otherwise, we return the value of NO_DATA, which is a constant meaning no value exists at that point. | ||
{{page break}} | |||
Click on "Update now" to recalculate the [[Overlay]]s. | Click on "Update now" to recalculate the [[Overlay]]s. | ||
The results of the [[Combo Overlay]] have now changed. Only in the places where the [[Traffic Noise Overlay]] computed a noise level of more than 55dB have results now been retained. In all other locations, the results have been discarded. | The results of the [[Combo Overlay]] have now changed. Only in the places where the [[Traffic Noise Overlay]] computed a noise level of more than 55dB have results now been retained. In all other locations, the results have been discarded. | ||
| Line 92: | Line 95: | ||
[[File:combo-overlay-tutorial-avg-add-small.jpg|350px|frame|center|Adding an [[Average Overlay]] from the ribbon.]] | [[File:combo-overlay-tutorial-avg-add-small.jpg|350px|frame|center|Adding an [[Average Overlay]] from the ribbon.]] | ||
{{page break}} | |||
Set the "Input" to "Attribute: Specific Layer", and the layer to "BUILDINGS". This will ensure the [[Average Overlay]] is specifically geared towards consululting data from [[Building]]s. | Set the "Input" to "Attribute: Specific Layer", and the layer to "BUILDINGS". This will ensure the [[Average Overlay]] is specifically geared towards consululting data from [[Building]]s. | ||
| Line 102: | Line 106: | ||
The "Cell averaging distance", which is set to 100m by default, can be left as-is. | The "Cell averaging distance", which is set to 100m by default, can be left as-is. | ||
{{page break}} | |||
Finally, click on "Update now" to have the [[Average Overlay]] recalculate. | Finally, click on "Update now" to have the [[Average Overlay]] recalculate. | ||
| Line 114: | Line 119: | ||
[[File:combo-overlay-tutorial-select-combo.jpg|350px|frame|center|Re-select the [[Combo Overlay]].]] | [[File:combo-overlay-tutorial-select-combo.jpg|350px|frame|center|Re-select the [[Combo Overlay]].]] | ||
{{page break}} | |||
Add a second input for the calculation. For Grid Overlay B, select the added [[Average Overlay]]. | Add a second input for the calculation. For Grid Overlay B, select the added [[Average Overlay]]. | ||
| Line 126: | Line 132: | ||
Instead of simply resuling in the value of A, instead the calculation will result in the combined values of A and either 5 or 0, depending on whether B has a value greater than 0. Since B will have a value slightly more than 0 when near a train track, this formula will now add an additional 5dB to the total result when near a train track. | Instead of simply resuling in the value of A, instead the calculation will result in the combined values of A and either 5 or 0, depending on whether B has a value greater than 0. Since B will have a value slightly more than 0 when near a train track, this formula will now add an additional 5dB to the total result when near a train track. | ||
{{page break}} | |||
Click on "Update now" to recalculate the [[Overlay]]s. | Click on "Update now" to recalculate the [[Overlay]]s. | ||
| Line 131: | Line 138: | ||
[[File:combo-overlay-tutorial-combo-4-small.jpg|350px|frame|center|The results when adding train noise to the masked results.]] | [[File:combo-overlay-tutorial-combo-4-small.jpg|350px|frame|center|The results when adding train noise to the masked results.]] | ||
{{page break}} | |||
==Improving operations== | ==Improving operations== | ||
| Line 145: | Line 154: | ||
The masking clause has been removed, leaving only the traffic noise and conditional addition of the noise from the trains. | The masking clause has been removed, leaving only the traffic noise and conditional addition of the noise from the trains. | ||
Recalculate, and the results will again cover the entire [[3D | Recalculate, and the results will again cover the entire [[3D Visualization]]. | ||
[[File:combo-overlay-tutorial-combo-5-small.jpg|350px|frame|center|The results of just computing the cumulative noise, rather than masking the results.]] | [[File:combo-overlay-tutorial-combo-5-small.jpg|350px|frame|center|The results of just computing the cumulative noise, rather than masking the results.]] | ||
{{page break}} | |||
Add another [[Combo Overlay]]. | Add another [[Combo Overlay]]. | ||
| Line 164: | Line 174: | ||
[[File:combo-overlay-tutorial-combo-6-small.jpg|350px|frame|center|the results of first combining the noise, and then dropping results which are too low.]] | [[File:combo-overlay-tutorial-combo-6-small.jpg|350px|frame|center|the results of first combining the noise, and then dropping results which are too low.]] | ||
{{page break}} | |||
==Presentation== | ==Presentation== | ||
| Line 180: | Line 192: | ||
[[File:combo-overlay-tutorial-name3.jpg|350px|frame|center|Renamed Overlay for noise if the noise is significant.]] | [[File:combo-overlay-tutorial-name3.jpg|350px|frame|center|Renamed Overlay for noise if the noise is significant.]] | ||
{{page break}} | |||
Select the "Train Track vicinity" Overlay (the created Average Overlay), and in the right panel switch to the "Legend" tab. | Select the "Train Track vicinity" Overlay (the created Average Overlay), and in the right panel switch to the "Legend" tab. | ||
| Line 192: | Line 205: | ||
[[File:combo-overlay-tutorial-legend3.jpg|350px|frame|center|Select the entries, then click remove at the bottom of the [[right panel]].]] | [[File:combo-overlay-tutorial-legend3.jpg|350px|frame|center|Select the entries, then click remove at the bottom of the [[right panel]].]] | ||
{{page break}} | |||
Change the first entry's color to a dark-grey or black, set the name to "No", and ensure the value is 0. | Change the first entry's color to a dark-grey or black, set the name to "No", and ensure the value is 0. | ||
| Line 202: | Line 216: | ||
[[File:combo-overlay-tutorial-legend5.jpg|350px|frame|center|The changed entry, and the fully changed visualization to match.]] | [[File:combo-overlay-tutorial-legend5.jpg|350px|frame|center|The changed entry, and the fully changed visualization to match.]] | ||
{{page break}} | |||
Notice the Overlay now does not show a progressive coloring, but more of a hard-line yes-or-no indication of what is or isn't near the tracks. This is both the only relevant information that can reasonably be read out of the Overlay, and also the way the information is used by the Combo Overlay. This makes the Overlay clearer and more useful to the user who eventually inspects and uses the Overlay or the [[Project]] it is part of. | Notice the Overlay now does not show a progressive coloring, but more of a hard-line yes-or-no indication of what is or isn't near the tracks. This is both the only relevant information that can reasonably be read out of the Overlay, and also the way the information is used by the Combo Overlay. This makes the Overlay clearer and more useful to the user who eventually inspects and uses the Overlay or the [[Project]] it is part of. | ||
The same principles of making the results more interpretable can apply to [[Combo Overlay]]s. However, the neccesity to tweak these is strongly dependent on how closely the results match the intent of legend of the first input Overlay. | The same principles of making the results more interpretable can apply to [[Combo Overlay]]s. However, the neccesity to tweak these is strongly dependent on how closely the results match the intent of legend of the first input Overlay. | ||
{{page break}} | |||
{{header|level=2|color=#c45911|Final assignments}} | {{header|level=2|color=#c45911|Final assignments}} | ||
* Add an additional [[Average Overlay]], which only highlights the location of the train track and not the region around it. | * Add an additional [[Average Overlay]], which only highlights the location of the train track and not the region around it. | ||
Latest revision as of 07:21, 18 October 2023
Prerequisites
The following prerequisites should be met before starting this tutorial:
- This tutorial relies on base knowledge about the editor interface and the creation of Overlays. If you have not yet followed the tutorials related to those subjects please do so first.
- This tutorial can be followed with any project of any arbitrary location, preferably with both roads and traintracks.
Preparations
Take the following steps as preparation for following this tutorial:
- Start your project. This can be a pre-existing project, or a newly created project.
Introduction to the Combo Overlay
The Combo Overlay is a Grid Overlay which allows for the creation of custom spatial calculation models. It is comparable to raster calculators which can be found in other GIS packages such as QGIS. The principle on which it operates is that for each grid cell, other Grid Overlays may provide values, and the combo Overlay uniformly applies a (simple or complex) formula to compute a new resulting value for that grid cell, and does so for all grid cells.
Creating a simple masking calculation
To get started with a Combo Overlay, it is basically always neccesary to have some other Grid Overlay in the same Project to run a calculation on.
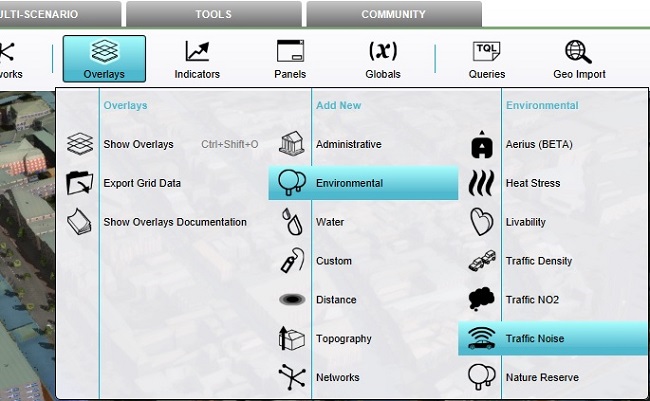
Add a Traffic Noise Overlay.
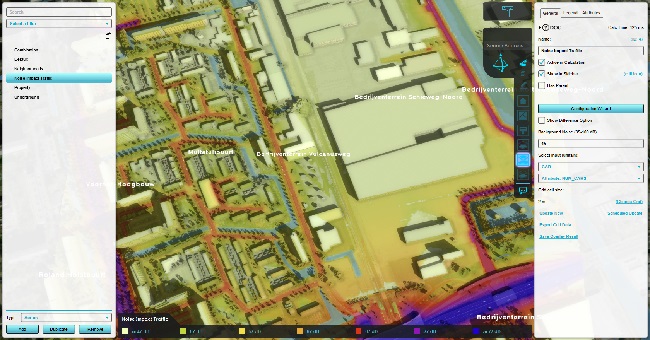
This Traffic Noise Overlay will serve as the primary input to work with. It computes results based on built-in formulas for noise from traffic. Although it's possible to tweak the inputs and the legend of the resulting Overlay, the principles of the calculation and the results thereof are immutable.
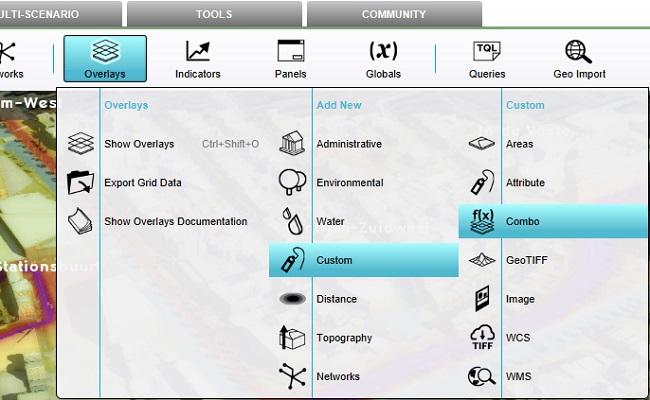
Add a Combo Overlay.
The Combo Overlay will, by itself, not show any significantly relevant results. This is because no inputs have yet been set, nor has a relevant formula been entered.
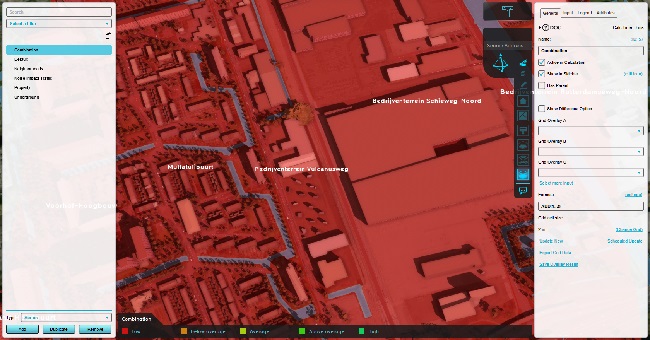
The Combo Overlay accepts a set of inputs, which are Grid Overlays.
Set Grid Overlay A to the added Traffic Noise Overlay.
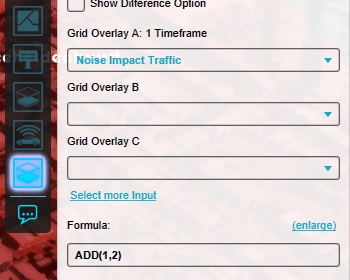
Next, set the formula to:
A
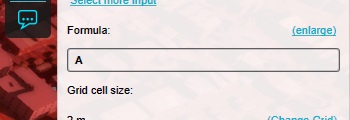
Then, click on ""Update now" to recalculate the Overlays.
The result is that for each Grid Cell, the value of the input Overlay A, which is set to the Traffic Noise Overlay, is used directly as the result.
Notice that the legend of the Traffic Noise Overlay is directly applied as well. this is because the legend of the first input is automatically read out by the Combo Overlay as the default legend for the Combo Overlay itself.
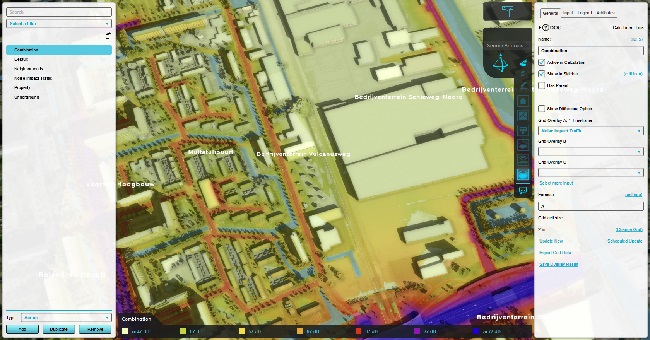
Just like with the Traffic Noise Overlay itself, it is possible to click on any location in the 3D Visualization and see the exact value calculated there.
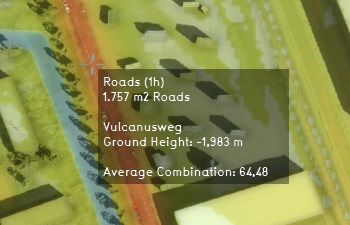
Using the Combo Overlay, it is possible to manipulate those calculated values. One often used principle is to "mask" data, which basically means to explicitly obscure or let through some values.
Modify the formula of the combo Overlay, so that it reads as follows:
IF(GT(A, 55), A, NO_DATA)

The formula now contains two logical operations, as well as a NO_DATA constant. The formula can be read as follows:
If ( IF ) it is true that A is greater than 55 ( GT ), in that case we use the value A. Otherwise, we return the value of NO_DATA, which is a constant meaning no value exists at that point.
Click on "Update now" to recalculate the Overlays.
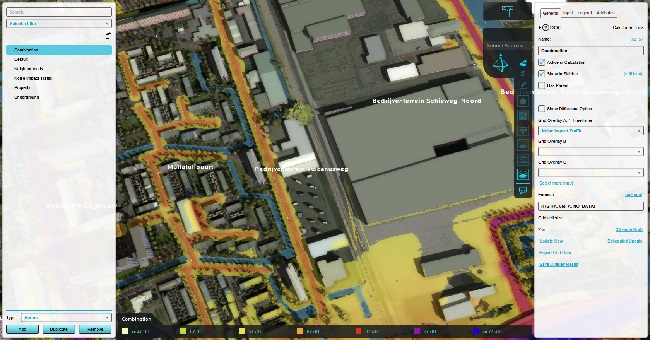
The results of the Combo Overlay have now changed. Only in the places where the Traffic Noise Overlay computed a noise level of more than 55dB have results now been retained. In all other locations, the results have been discarded.
Rasterizing and combining data
Combo Overlays are, in and of themselves, effective tools for manipulating data. However, their effectiveness only goes as far as the input which can be provided to them. Therefor, it is also important to know how to turn other data in the Tygron Platform into Grid Overlays as well.
To try this out, information about train tracks will be added to the Combo Overlay, or more specifically information about the proximity of train tracks.
Train tracks have a number of trains running on them. This can be visualized using an Average Overlay.
Add an Average Overlay.
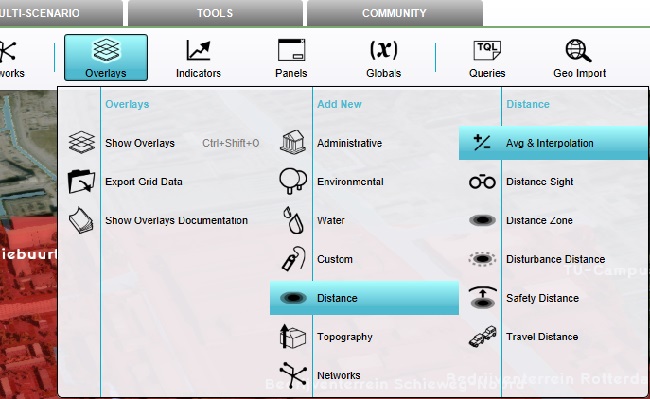
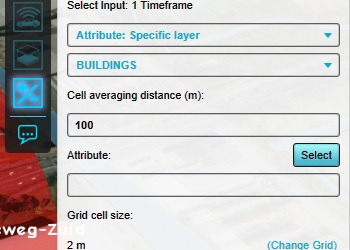
Set the "Input" to "Attribute: Specific Layer", and the layer to "BUILDINGS". This will ensure the Average Overlay is specifically geared towards consululting data from Buildings.
Next, set the "Attribute" to "NUM_TRAINS". NUM_TRAINS is the Attribute signifying the number of trains which travel across any given Building, such as train tracks.
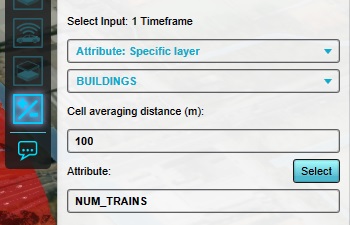
The "Cell averaging distance", which is set to 100m by default, can be left as-is.
Finally, click on "Update now" to have the Average Overlay recalculate.
The result will be an Overlay which highlights train tracks, with a radius of 100m. Or in terms more practical for this setup: for any given grid cell, the Average Overlay indicates whether a train track is within 100m.
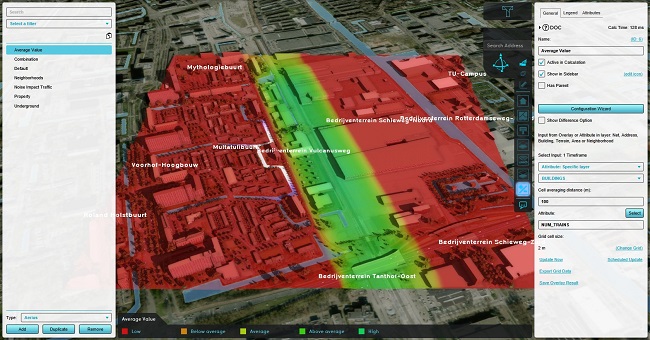
Any cell with a value of 0 only has cells in a 100m radius with 0's. If any cell within that radius would feature a train track, the computed (average) value would be slightly more than 0. This value in and of itself is not significant or useful, but can serve as a filter to know which cells are "near a train track".
Now, switch back to the Combo Overlay by selecting it in the left panel.
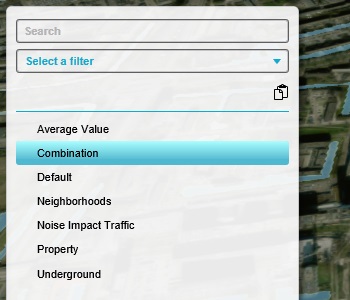
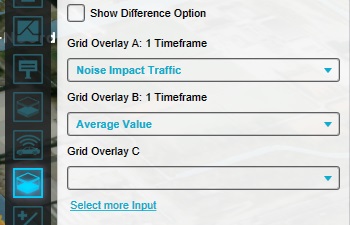
Add a second input for the calculation. For Grid Overlay B, select the added Average Overlay.
Modify the formula of the Combo Overlay, so that it reads as follows:
IF(GT(A, 55), ADD(A, IF(GT(B, 0), 5, 0)), NO_DATA)
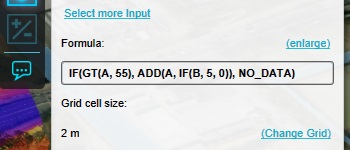
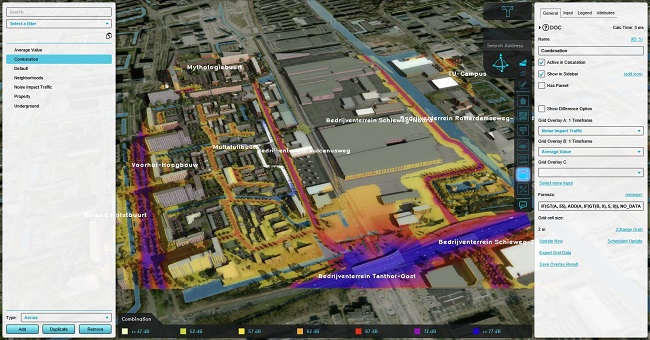
Instead of simply resuling in the value of A, instead the calculation will result in the combined values of A and either 5 or 0, depending on whether B has a value greater than 0. Since B will have a value slightly more than 0 when near a train track, this formula will now add an additional 5dB to the total result when near a train track.
Click on "Update now" to recalculate the Overlays.
The results are now subtly different, in that for all locations within 100m of the train tracks the noise level is computed as 5dB louder than otherwise.
Improving operations
There is now also a subtle error in this formula. The noise is only increased when the traffic noise in-and-of itself was already at a level of 55 dB. If that level was not reached before taking into consideration the train's noise, the results are already discarded. It would make more sense to first add the train's noise assumption to the calculated noise levels, and then test whether it exceeds some threshold.
To facilitate this, first the total noise will be calculated using a single Combo Overlay. Then, a second Combo Overlay will test whether the noise level should be reported or not.
Modify the Combo Overlays formula to read as follows:
ADD(A, IF(GT(B, 0), 5, 0))
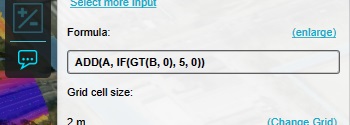
The masking clause has been removed, leaving only the traffic noise and conditional addition of the noise from the trains.
Recalculate, and the results will again cover the entire 3D Visualization.
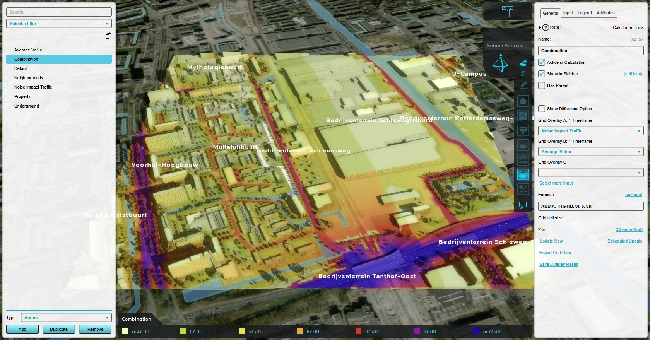
Add another Combo Overlay.
As input A, set the first Combo Overlay.
For the formula, ensure that it reads as follows:
IF(GT(A, 55), A, NO_DATA)
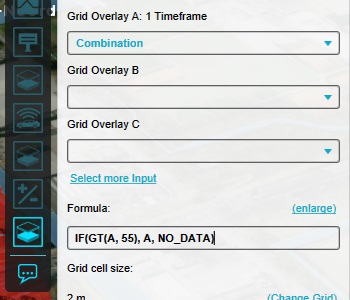
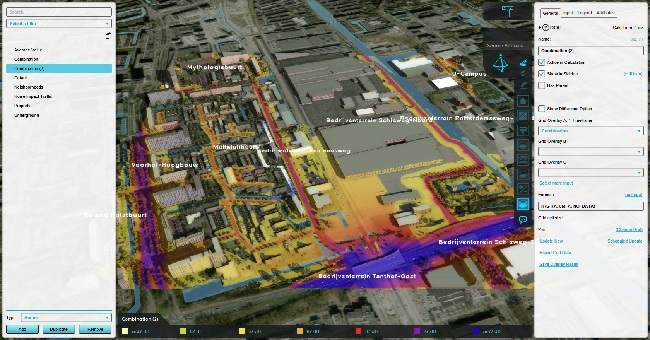
Recalculate, and see the results.
Presentation
When creating custom Overlays, be it with Average Overlays or Combo Overlays, it is very important to provide information on what the user is looking at. Especially for the relevant results but where possible also for intermediate steps.
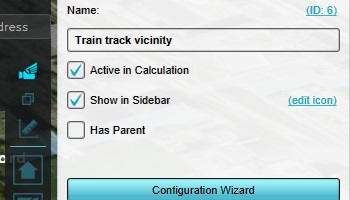
Rename the Average Overlay, highlighting the train tracks, to "Train track vicinity".
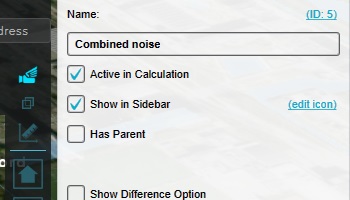
Rename the first Combo Overlay to "Combined Noise".
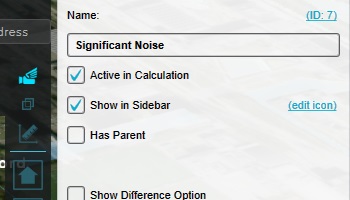
Rename the second Combo Overlay to "Significant Noise".
Select the "Train Track vicinity" Overlay (the created Average Overlay), and in the right panel switch to the "Legend" tab.

Ensure "Has Custom Legend" is checked. This allows setting which values resulting from the Overlay's calculation conform to which results. Modifying these values allow for creating a clearer or more relevant visualization of the data.

Select 3 of the entries, and remove them.
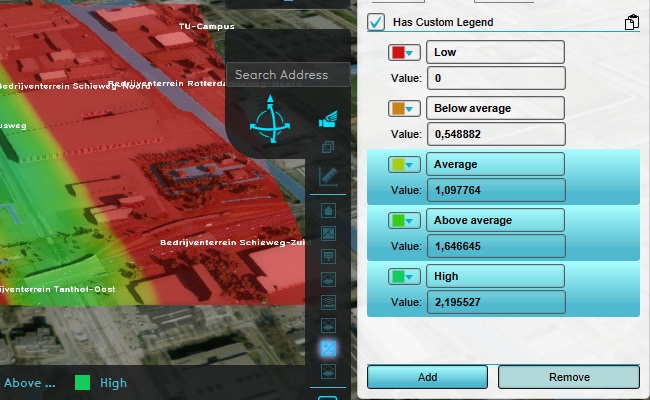
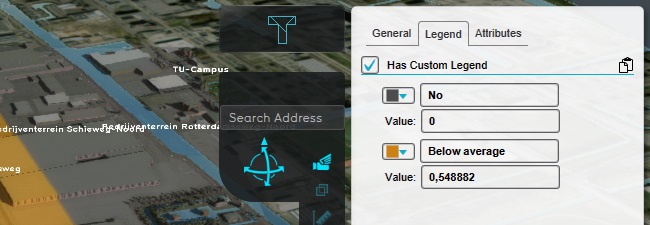
Change the first entry's color to a dark-grey or black, set the name to "No", and ensure the value is 0.
Notice this immediately changes the visualization as well. Although the results of the calculation have not changed, and in fact no new calculation was performed, the way the results are shown are dynamically updated.
Change the second entry's color to light-red, set the name to "Yes", and ensure the value is set to around 0,1 .
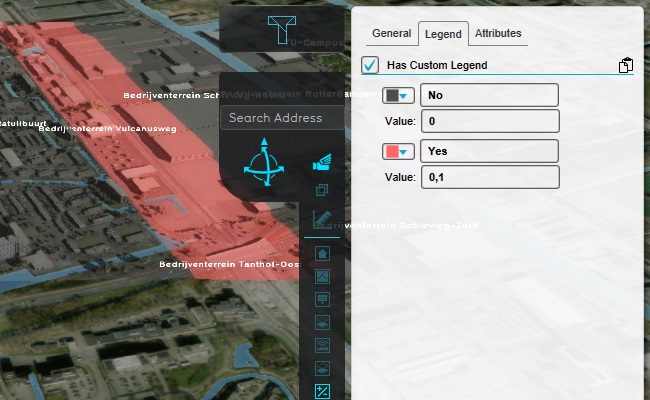
Notice the Overlay now does not show a progressive coloring, but more of a hard-line yes-or-no indication of what is or isn't near the tracks. This is both the only relevant information that can reasonably be read out of the Overlay, and also the way the information is used by the Combo Overlay. This makes the Overlay clearer and more useful to the user who eventually inspects and uses the Overlay or the Project it is part of.
The same principles of making the results more interpretable can apply to Combo Overlays. However, the neccesity to tweak these is strongly dependent on how closely the results match the intent of legend of the first input Overlay.
Final assignments
- Add an additional Average Overlay, which only highlights the location of the train track and not the region around it.
- Add an additional Combo Overlay, which shows a color based on whether an area is away from the train tracks, near the train tracks, or itself train tracks.
Tip: You can add the results of multiple GT() operations together in a Combo Overlay's formula.
Final notes
Although not part of the general explanation provided in this tutorial, the following notes are important to keep in mind:
- The editor interface will generally present the first 3 inputs (A, B, and C) of the Combo Overlay. However, a total of 10 inputs can be added and used, by switching to the "inputs" tab.
Tutorial completed
Congratulations. You have now completed this tutorial. In it, you have learned how to create Combo Overlays, and how to use Average Overlays to rasterize data for use in the Combo Overlay.