Season formula (Water Overlay): Difference between revisions
Jump to navigation
Jump to search
No edit summary |
No edit summary |
||
| (3 intermediate revisions by one other user not shown) | |||
| Line 29: | Line 29: | ||
==Evaporation factor graphs== | ==Evaporation factor graphs== | ||
The evaporation graphs showing the evaporation factor as a percentage per day. These are based on ''Table 2.10 Cropfactors'' | The evaporation graphs showing the evaporation factor as a percentage per day. These are based on ''Table 2.10 Cropfactors'' of the Gwz2016 book{{ref|GWZ2016}}. The approximated graphs use five control points (see the season table above) per type, such that it can be reduced to four values per year. Values between the control points are obtained by interpolation. | ||
<gallery> | <gallery> | ||
File:seasonal_evap_grass.jpg | File:seasonal_evap_grass.jpg | ||
| Line 40: | Line 40: | ||
</gallery> | </gallery> | ||
[[File:function_table_evaporation_factors.png|frame|left|Evaporation factors in the function table in the [[editor]]]] | [[File:function_table_evaporation_factors.png|frame|left|Evaporation factors in the [[function table]] in the [[editor]]]] | ||
{{article end | {{article end | ||
| Line 48: | Line 48: | ||
* [[Ground evaporation formula (Water Overlay)]] | * [[Ground evaporation formula (Water Overlay)]] | ||
* [[Start date ms (Water Overlay)]] | * [[Start date ms (Water Overlay)]] | ||
* [[Water evaporation factor (Water Overlay)]] | |||
|references= | |references= | ||
<references> | <references> | ||
{{ref|GWZ2016 | |||
|name=Grondwaterzakboekje, Gwz2016 (Impressed druk en print) | |||
|author=Makkink, Bram Bot (2016) | |||
|page=Table 2.10 Gewasfactoren, % van referentiegewasverdamping | |||
|source= | |||
|link= | |||
|lastvisit= | |||
}} | |||
</references> | </references> | ||
}} | }} | ||
{{WaterOverlay formula nav}} | {{WaterOverlay formula nav}} | ||
Latest revision as of 13:32, 17 October 2025
The season fraction and index are variables used for calculating the transpiration factor in the Ground evaporation formula. It uses the configured start date of a Water Overlay and selected months and day of months to determine one of the four configured (seasonal) evaporation factors.
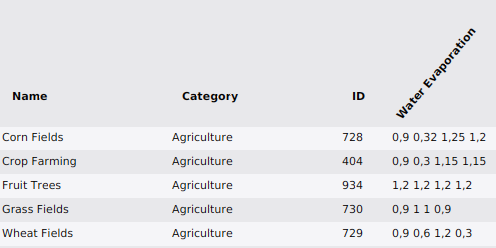
Evaporation month, day of month and corresponding evaporation factor array value:
| Month | Day of Month | Transpiration value |
|---|---|---|
| March | 15 | 1st |
| April | 15 | 2nd |
| July | 15 | 3rth |
| September | 15 | 4th |
| October | 1 | 1st |
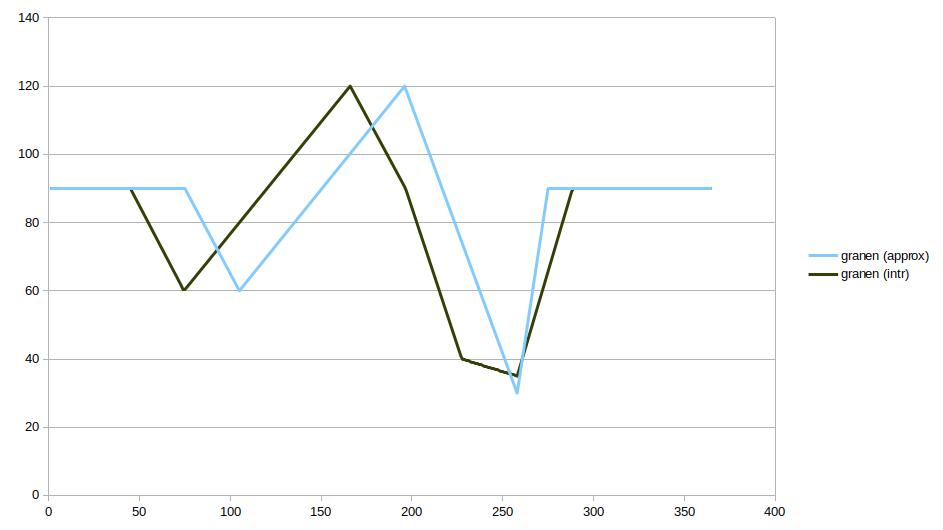
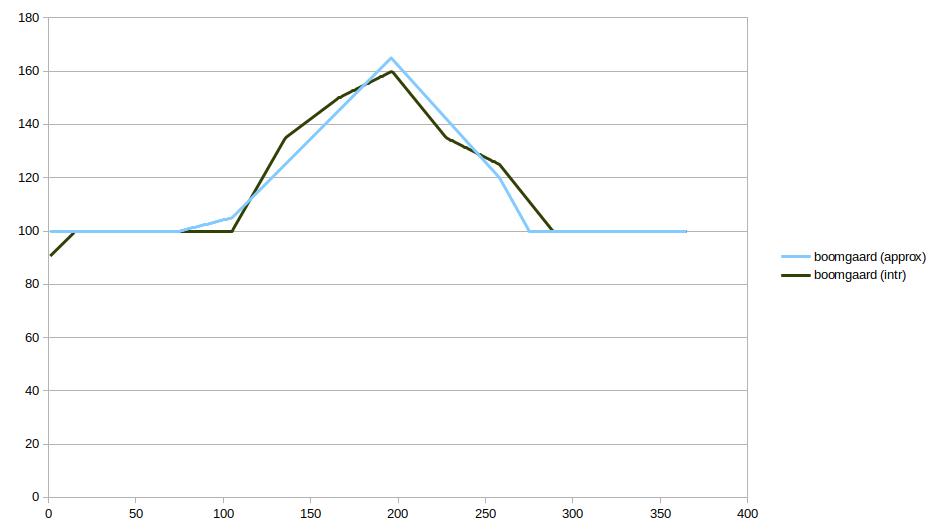
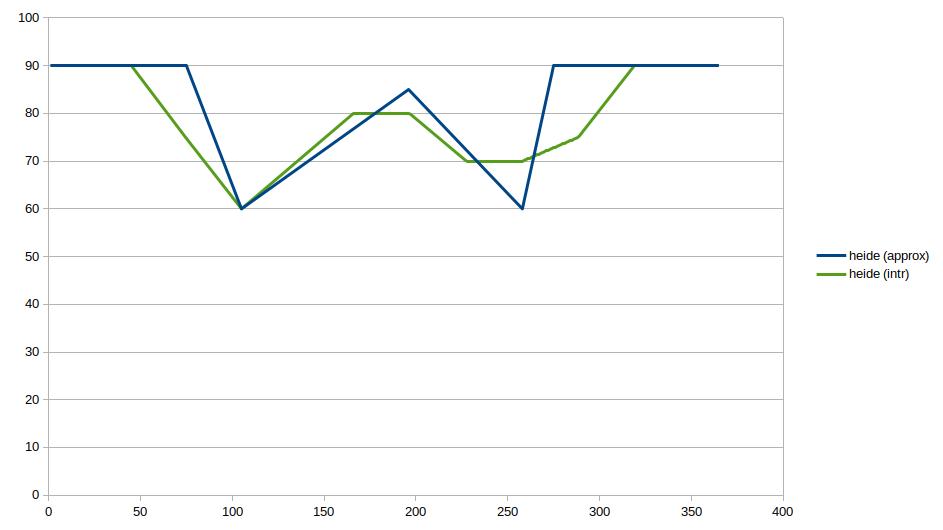
Evaporation factor graphs
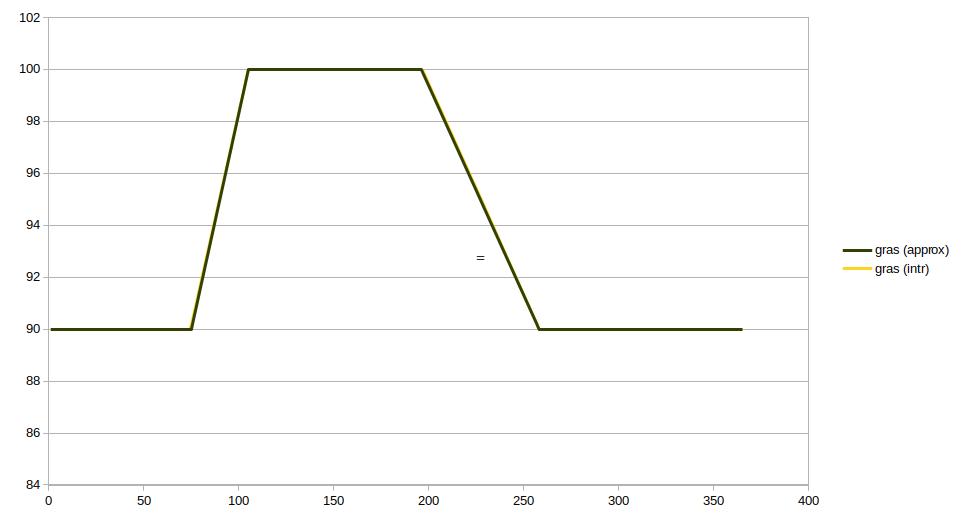
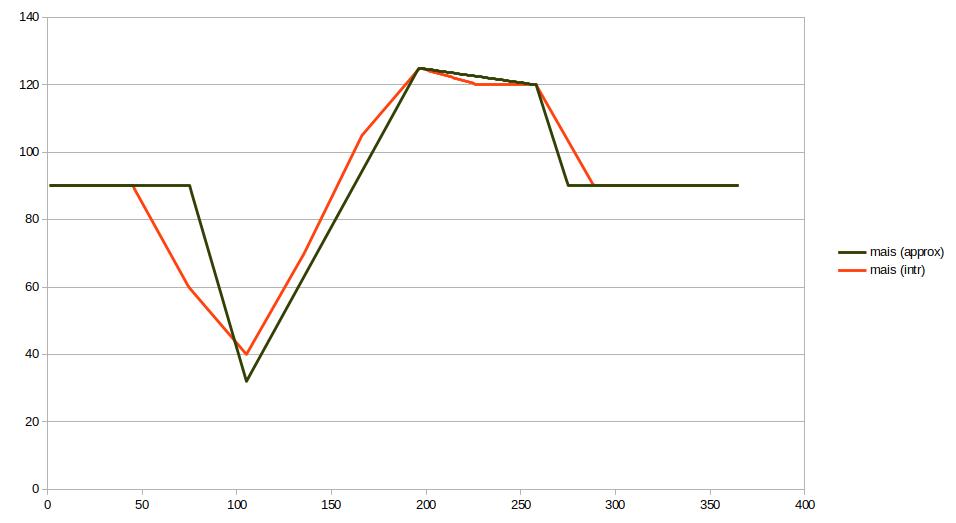
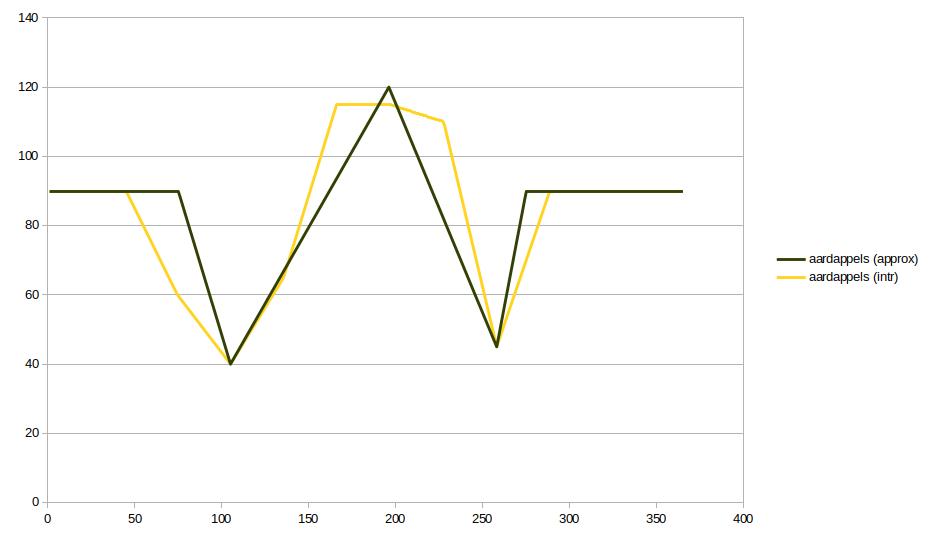
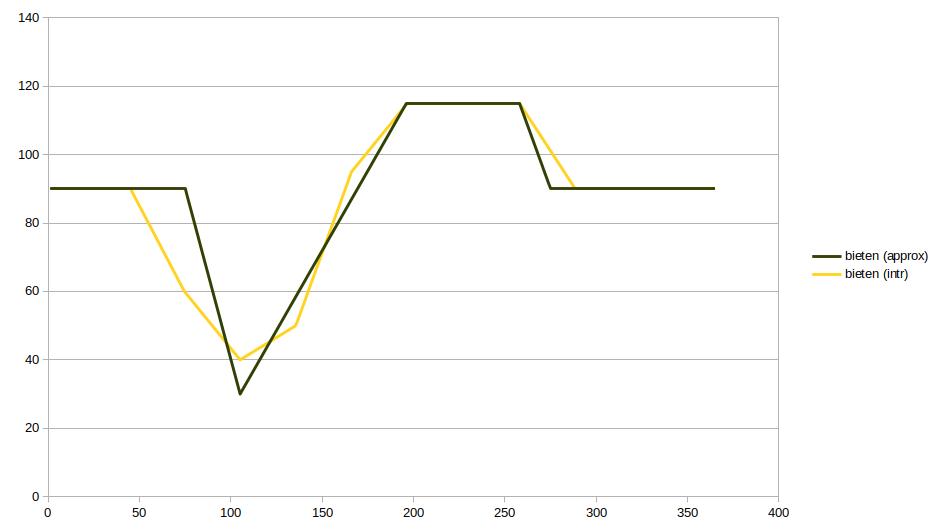
The evaporation graphs showing the evaporation factor as a percentage per day. These are based on Table 2.10 Cropfactors of the Gwz2016 book[1]. The approximated graphs use five control points (see the season table above) per type, such that it can be reduced to four values per year. Values between the control points are obtained by interpolation.
Notes
- The growth season dates are determined based on western european growth and transpiration graphs of the following crops and plants: grass, corn, potato, beet, grain, orchard and heather.
See also
- Ground evaporation formula (Water Overlay)
- Start date ms (Water Overlay)
- Water evaporation factor (Water Overlay)
References
- ↑ Grondwaterzakboekje, Gwz2016 (Impressed druk en print) ∙ Makkink, Bram Bot (2016) ∙ Page(s): Table 2.10 Gewasfactoren, % van referentiegewasverdamping
