Demo Breach Iterate Project: Difference between revisions
No edit summary |
|||
| (11 intermediate revisions by 3 users not shown) | |||
| Line 1: | Line 1: | ||
{{technical|type=section}} | |||
{{demo project summary | {{demo project summary | ||
| title=Demo Iteration Flood | | title=Demo Iteration Flood | ||
| demographic=hydrologists and other water experts | | demographic=hydrologists and other water experts | ||
| showcases=the [[Flooding Overlay]] in | | showcases=the [[Flooding Overlay]] in an iteration mode | ||
| image= | | image=Demo_breach_iterate-iteration_base_typology.gif | ||
| description=The demo show the [[Simulation Core|iteration]] functionality in combination with template excels that can change the width of a breach. It also records the object width and flow output between iterations using additional Template Excel panels, as well as a Text Template panel that plots these values in a chart. | | description=The demo show the [[Simulation Core|iteration]] functionality in combination with template excels that can change the width of a breach. It also records the object width and flow output between iterations using additional Template Excel panels, as well as a Text Template panel that plots these values in a chart. | ||
}} | }} | ||
==What does it do== | |||
Running a water overlay calculation in the {{software}} is done by setting the parameters at the start of your simulation. However, by using the iterative option, you can allow parameters to change during the simulation based on a formula. For example, the breach can grow according to a defined formula. In this demo, the formula is that the breach grows by 2 meters per iteration step, with an initial breach width of 3 meters. This formula is chosen to demonstrate how the method works, not to model a realistic breach growth. | |||
===Setting the breach width for each iteration step=== | |||
With iterative calculation, you essentially split your simulation into a number of steps. In our example, the breach should grow after each step. To model this, we first need to identify where the breach width is defined. | |||
[[File:Steps.png|thumb]] | |||
A breach is modeled as an [[Area]] in the {{software}}. This area has an attribute called BREACH_WIDTH. The value of this attribute needs to be updated after each iteration step. This can be done using an Excel panel. In the demo, this panel is called ''Update Attribute Breach Width (Before): Breach.'' | |||
When you download this panel via the Debug Excel sheet, you can see how this is implemented. In the Excel file, cell B5 contains the formula: | |||
3 + B3 * 2. | |||
This formula states that the breach starts with a width of 3 meters and grows by 2 meters with each iteration step. As mentioned, this is not a realistic formula, but it demonstrates the mechanism. You can replace it with your own formula if needed. | |||
To do this, it is important to understand that the value in cell B3 is retrieved using a Query. This query provides the value used in the calculation. In this case, the SELECT_ITERATION query retrieves the current iteration step. The formula in B5 multiplies this value by two and adds 3 meters. The resulting value is then written to the BREACH_WIDTH attribute. This happens because the cell has the name UPDATE_AREA_BREACH_WIDTH_WHERE_AREA_IS_ID, which is a [[TQL]] query that updates the [[Attribute]]. In the next iteration step, the updated BREACH_WIDTH is used. | |||
===Store results for the iteration steps in combo overlays=== | |||
A requirement for splitting a simulation into steps is that, at the end of each step, the results must be stored so they can be used as input for the next step. In this simulation, the water level is crucial, as well as the flow velocity. | |||
This is achieved using Combo Overlays. The results at the end of a step are stored in a Combo Overlay and then read at the start of the next step. | |||
To effectively copy the water level at the end of a step, the combo overlay contains a formula that takes the result from iteration step x of the flooding overlay, except for the first step. | |||
This is a good moment to mention that numbering starts at 0. So if you have 4 iteration steps, they are numbered from 0 to 3. | |||
To ensure that the combo overlay is used in your simulation, you specify in the wizard that the combo overlay Combo Surface is used as the input value for the initial water level when running the simulation. | |||
In the same way, two additional combo overlays are created: one for flow velocity in the x-direction and one for the y-direction. These are also used as initial values for the simulation. | |||
===Setting the time for your simulation=== | |||
The simulation time settings also require some explanation. The total duration of the simulation is set in the wizard. This total time is divided over the specified number of iteration steps. | |||
This is done using two attributes of the Flooding Overlay: PARTIAL_START and PARTIAL_END. These attributes define which part of the total simulation time is executed. During the simulation, these attributes are updated using another Excel sheet, called the iterator. | |||
In the iterator, the total number of iterations is retrieved, in this case 20. The previous step is also retrieved, here step 19. From this, the progress of the simulation is calculated as a percentage, which is 95 percent in this case. In the wizard, the total simulation time was set to 4 hours, or 14,400 seconds. | |||
This means that the start of this iteration step is at second 13,680, which is 95 percent of 14,400 seconds, and it ends at second 14,400. | |||
These values are written back to the PARTIAL_START and PARTIAL_END attributes of the Flooding overlay: | |||
for cell F9: UPDATE_GRID_PARTIAL_START_SEC_WHERE_GRIDTYPE_IS_FLOODING | |||
for cell G9: UPDATE_GRID_PARTIAL_END_SEC_WHERE_GRIDTYPE_IS_FLOODING | |||
===Visualization of the simulation=== | |||
Finally, the visualization of the simulation. When you inspect the Flooding Overlay, you will see that only the results of the last simulation step are visible. To ensure that the results of all iteration steps can still be viewed, another overlay is needed: the Iteration Collector. This overlay stores the results after each iteration step. | |||
==Calculations using the Iteration option== | ==Calculations using the Iteration option== | ||
| Line 83: | Line 130: | ||
The template excel panel named ''Store Breach Flow (After)'' is also performed at the end of each iteration, indicated by the AFTER timing setting. This template excel obtains the OBJECT_FLOW_OUTPUT attribute from the Breach Area at each iteration, using the query <code>SELECT_ATTRIBUTE_WHERE_AREA_IS_ID_AND_NAME_IS_OBJECT_FLOW_OUTPUT_AND_ITERATION_IS_X</code>. The resulting values can then be concatenated into an array and stored under the attribute '''BREACH_FLOW_AT''' using <code>UPDATE_AREA_BREACH_FLOW_AT_WHERE_AREA_IS_ID</code>. | The template excel panel named ''Store Breach Flow (After)'' is also performed at the end of each iteration, indicated by the AFTER timing setting. This template excel obtains the OBJECT_FLOW_OUTPUT attribute from the Breach Area at each iteration, using the query <code>SELECT_ATTRIBUTE_WHERE_AREA_IS_ID_AND_NAME_IS_OBJECT_FLOW_OUTPUT_AND_ITERATION_IS_X</code>. The resulting values can then be concatenated into an array and stored under the attribute '''BREACH_FLOW_AT''' using <code>UPDATE_AREA_BREACH_FLOW_AT_WHERE_AREA_IS_ID</code>. | ||
Additional a cumulative flow output is calculated and concatenated similarly, and stored under the attribute '''BREACH_FLOW_SUM_AT''' using <code>UPDATE_AREA_BREACH_FLOW_SUM_AT_WHERE_AREA_IS_ID</code> | Additional a cumulative flow output is calculated and concatenated similarly, and stored under the attribute '''BREACH_FLOW_SUM_AT''' using <code>UPDATE_AREA_BREACH_FLOW_SUM_AT_WHERE_AREA_IS_ID</code>. Finally the BREACH_FLOW_SUM attribute is calculated as a single value and stored in the BREACH_FLOW_SUM attribute using <code>UPDATE_AREA_BREACH_FLOW_SUM_WHERE_AREA_IS_ID</code> | ||
The Template Text panel uses a simple HTML div element and javascript to plot a chart of 3 traces: The Breach Area Width at, Flow at and Flow Sum at. This panel obtains these values by simply requesting the respective attributes of the Breach Area that is linked to the Text Panel instance, using <code>$ATTRIBUTE_BREACH_WIDTH_AT</code>. | |||
<gallery> | |||
File:demo_iteration_flood_breach_output_plots.jpg|Breach Output Plots for Breach Width, Breach Flow and Breach Cumulative Flow. | |||
</gallery> | |||
{{article end | {{article end | ||
Latest revision as of 13:04, 26 January 2026

The Demo Iteration Flood project is available for all users and can be found in the main menu under Edit projects. This project does not count towards your license.
This project is intended for hydrologists and other water experts.
This project showcases the Flooding Overlay in an iteration mode.
The demo show the iteration functionality in combination with template excels that can change the width of a breach. It also records the object width and flow output between iterations using additional Template Excel panels, as well as a Text Template panel that plots these values in a chart.
What does it do
Running a water overlay calculation in the Tygron Platform is done by setting the parameters at the start of your simulation. However, by using the iterative option, you can allow parameters to change during the simulation based on a formula. For example, the breach can grow according to a defined formula. In this demo, the formula is that the breach grows by 2 meters per iteration step, with an initial breach width of 3 meters. This formula is chosen to demonstrate how the method works, not to model a realistic breach growth.
Setting the breach width for each iteration step
With iterative calculation, you essentially split your simulation into a number of steps. In our example, the breach should grow after each step. To model this, we first need to identify where the breach width is defined.

A breach is modeled as an Area in the Tygron Platform. This area has an attribute called BREACH_WIDTH. The value of this attribute needs to be updated after each iteration step. This can be done using an Excel panel. In the demo, this panel is called Update Attribute Breach Width (Before): Breach.
When you download this panel via the Debug Excel sheet, you can see how this is implemented. In the Excel file, cell B5 contains the formula: 3 + B3 * 2. This formula states that the breach starts with a width of 3 meters and grows by 2 meters with each iteration step. As mentioned, this is not a realistic formula, but it demonstrates the mechanism. You can replace it with your own formula if needed.
To do this, it is important to understand that the value in cell B3 is retrieved using a Query. This query provides the value used in the calculation. In this case, the SELECT_ITERATION query retrieves the current iteration step. The formula in B5 multiplies this value by two and adds 3 meters. The resulting value is then written to the BREACH_WIDTH attribute. This happens because the cell has the name UPDATE_AREA_BREACH_WIDTH_WHERE_AREA_IS_ID, which is a TQL query that updates the Attribute. In the next iteration step, the updated BREACH_WIDTH is used.
Store results for the iteration steps in combo overlays
A requirement for splitting a simulation into steps is that, at the end of each step, the results must be stored so they can be used as input for the next step. In this simulation, the water level is crucial, as well as the flow velocity.
This is achieved using Combo Overlays. The results at the end of a step are stored in a Combo Overlay and then read at the start of the next step.
To effectively copy the water level at the end of a step, the combo overlay contains a formula that takes the result from iteration step x of the flooding overlay, except for the first step.
This is a good moment to mention that numbering starts at 0. So if you have 4 iteration steps, they are numbered from 0 to 3.
To ensure that the combo overlay is used in your simulation, you specify in the wizard that the combo overlay Combo Surface is used as the input value for the initial water level when running the simulation.
In the same way, two additional combo overlays are created: one for flow velocity in the x-direction and one for the y-direction. These are also used as initial values for the simulation.
Setting the time for your simulation
The simulation time settings also require some explanation. The total duration of the simulation is set in the wizard. This total time is divided over the specified number of iteration steps.
This is done using two attributes of the Flooding Overlay: PARTIAL_START and PARTIAL_END. These attributes define which part of the total simulation time is executed. During the simulation, these attributes are updated using another Excel sheet, called the iterator.
In the iterator, the total number of iterations is retrieved, in this case 20. The previous step is also retrieved, here step 19. From this, the progress of the simulation is calculated as a percentage, which is 95 percent in this case. In the wizard, the total simulation time was set to 4 hours, or 14,400 seconds.
This means that the start of this iteration step is at second 13,680, which is 95 percent of 14,400 seconds, and it ends at second 14,400.
These values are written back to the PARTIAL_START and PARTIAL_END attributes of the Flooding overlay: for cell F9: UPDATE_GRID_PARTIAL_START_SEC_WHERE_GRIDTYPE_IS_FLOODING for cell G9: UPDATE_GRID_PARTIAL_END_SEC_WHERE_GRIDTYPE_IS_FLOODING
Visualization of the simulation
Finally, the visualization of the simulation. When you inspect the Flooding Overlay, you will see that only the results of the last simulation step are visible. To ensure that the results of all iteration steps can still be viewed, another overlay is needed: the Iteration Collector. This overlay stores the results after each iteration step.
Calculations using the Iteration option
The demo project simulates a Dutch polder to demonstrate how a breach can be adjusted while using the iteration option.
There are situations in which we want more control over what width of a breach each iteration according to some condition. By dividing the flooding event into several iteration steps, we can adjust the breach width for each iteration step based on the degree of saturation of the soil. In this way, infiltration can be calculated in a more realistic way.
The purpose of this demo project is to clarify how an iterative calculation can be made. In this case, the infiltration of water during and after a precipitation event was chosen. However, on the basis of this demo project, it should also be possible to calculate other calculations iteratively.
Setup of the Demo Project
The demo project consists of a number of components that are essential for this calculation.
- Combo Overlay
- Flooding Overlay
- Iteration Collector
- Indicator
- Number of Simulation Iterations
- Template Excel Panels
- Template Text Panels
Combo Overlays
Before we create the Flooding event, a number of overlays are created that serve as input for the various iteration steps. At the end of each iteration the combo overlay is updated an serves as the input for the next iteration step. We'll go through the different combo overlays.
Combo Surface U and Combo Surface V
These overlays say something about the initial velocity of the surface water in x and y directions. When water flows down a slope, we want to use the speed at which the water flows at the end of an iteration step as the initial speed at the next iteration step. The input grid is the result of the last calculation. In the formula of this combo overlay, you can see that the formula is aimed at making sure that it computes with the data from the previous time step, unless the previous iteration step was step 0. In that case, 0 is used.
Make sure to check the box "previous" to make sure the Combo Overlay uses the U and V of the previous itertationstep.
The formula in the combo overlay should in this case read: IF(EQ(ITERATION, 0), 0, A)
Combo Surface
The combo Surface gives the last value of the waterlevel on the surface and is input for the next iteration step. If there is no previous iteration step, the value should be 0. Make sure to check the box "previous" to make sure the Combo Overlay uses the values of the previous itertation step.
The formula in the combo overlay Combo Fraction should in this case read:
IF(EQ(ITERATION, 0), 0, A)
Flooding Overlay
When configurating the flooding overlay, the default settings can be used. The exceptions are described below.
Rain Event Duration: Here the the total duration of the calculation is specified. Later this is divided into different iteration steps.
Water System – Water Level: Here the initial water level and the U and V flow are set. Use the option "Advanced: Select Grid Overlay to set initial water level and also flow UV".
The water level is set based on a specific overlay, which is the combo overlay Surface. Similarly, the y and x speed from the combo overlay is used as initial input.
Generated Output Overlays:
- Surface Last Value
- Surface Last U
- Surface Last V
- The number of timeframes is set to 1.
Iteration Collector
The Iteration Collector is a type of overlay. It shows the results of each iteration step. An iteration collector needs an input overlay, in this case it is the Rainfall overlay. Of each iteration step one timeframes will be saved.
An attribute of the Iteration Collector is the Modulus. The Modulus determines how many iterations you store. By default, this is set to 1. This means that only one (the last) result of each iteration step is saved and used as a timeframe in the iteration collector. When the modulus is set to 1, every iteration is stored. When you set the modulus to 2, half of the iteration values are stored.
Indicator
The purpose of the indicator is to set the start and end time of each iteration step of the flooding overlay. To accomplish this, a set of queries is performed. First and foremost, the amount of iteration steps and the total duration of the simulation obtained. This is obtained by using the query SELECT_ITERATIONS_WHERE and SELECT_ATTRIBUTE_WHERE_NAME_IS_RAIN_M_AND_OVERLAY_IS_10_AND_RELATION_IS_WEATHER_AND_INDEX_IS_2.
In this simple situation, the total simulation time will be subdivided into n equal steps, where n is the amount of iterations. The current iteration can be obtained using the query SELECT_ITERATION_WHERE_
The start and end time can then be calculated by multiplying the simulation time by the iteration fractions simulationTime * iteration / iterations and simulationTime * (iteration +1) / iterations. The simulation time for the iteration is then updated by using the update queries UPDATE_OVERLAY_PARTIAL_START_SEC_WHERE_OVERLAY_IS_3 and UPDATE_OVERLAY_PARTIAL_END_SEC_WHERE_OVERLAY_IS_3.
Number of Iterations
The number of iterations can be set via the calculation panel. Here you find the option iteration where you can set the number of iterations. This is set to 1 by default.
Exploring the results
To view the results of the calculation, the Iteration can be played everywhere. The following results can be seen here:
- Water on surface level in meters
- Iteration U and V: The speed of the surface water in either the x or y direction.
Template Excel Panels
The project contains several template panels, three of which are excel panels and one is a text panel. These template panels are all performed on breach areas, of which only one is present in this project.
The template excel panel named Update Attribute Breach Width (Before) is performed at the start of each iteration, indicated by the BEFORE setting, which can be seen in its Template Excel Detail Panel. This Template Excel obtains the current iteration using SELECT_ITERATION_WHERE_, and updates the BREACH_WIDTH area to 3 + iteration using UPDATE_AREA_BREACH_WIDTH_WHERE_NAME_IS_BREACH_WIDTH_AND_AREA_IS_ID
The template excel panel named Store Breach Width in Width At (After) is performed at the end of each iteration, indicated by the AFTER timing setting. This template excel obtains the OBJECT_WIDTH_OUTPUT attribute from the Breach Area at each iteration, using the query SELECT_ATTRIBUTE_WHERE_AREA_IS_ID_AND_NAME_IS_OBJECT_WIDTH_OUTPUT_AND_ITERATION_IS_X. Queries with iterations clauses are cached and only executed when a particular iteration is active. The resulting values can then be concatenated into an array and stored under the attribute BREACH_WIDTH_AT using UPDATE_AREA_BREACH_WIDTH_AT_WHERE_AREA_IS_ID
The template excel panel named Store Breach Flow (After) is also performed at the end of each iteration, indicated by the AFTER timing setting. This template excel obtains the OBJECT_FLOW_OUTPUT attribute from the Breach Area at each iteration, using the query SELECT_ATTRIBUTE_WHERE_AREA_IS_ID_AND_NAME_IS_OBJECT_FLOW_OUTPUT_AND_ITERATION_IS_X. The resulting values can then be concatenated into an array and stored under the attribute BREACH_FLOW_AT using UPDATE_AREA_BREACH_FLOW_AT_WHERE_AREA_IS_ID.
Additional a cumulative flow output is calculated and concatenated similarly, and stored under the attribute BREACH_FLOW_SUM_AT using UPDATE_AREA_BREACH_FLOW_SUM_AT_WHERE_AREA_IS_ID. Finally the BREACH_FLOW_SUM attribute is calculated as a single value and stored in the BREACH_FLOW_SUM attribute using UPDATE_AREA_BREACH_FLOW_SUM_WHERE_AREA_IS_ID
The Template Text panel uses a simple HTML div element and javascript to plot a chart of 3 traces: The Breach Area Width at, Flow at and Flow Sum at. This panel obtains these values by simply requesting the respective attributes of the Breach Area that is linked to the Text Panel instance, using $ATTRIBUTE_BREACH_WIDTH_AT.
-
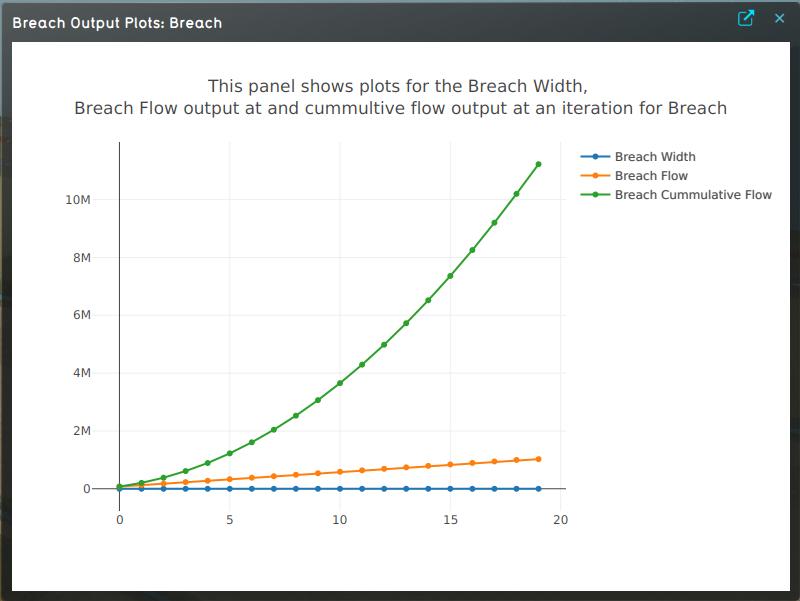 Breach Output Plots for Breach Width, Breach Flow and Breach Cumulative Flow.
