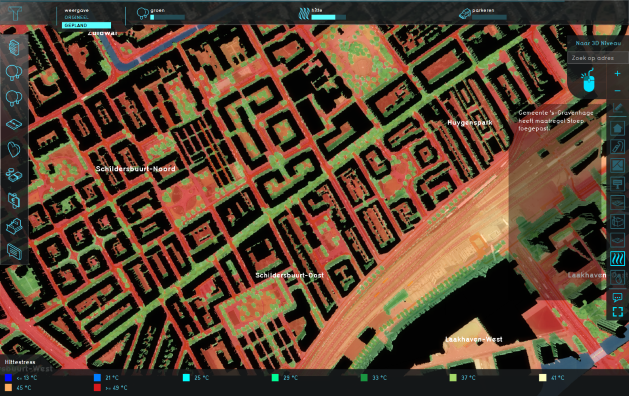
Tygron for Spatial Planning: Difference between revisions
No edit summary |
No edit summary |
||
| Line 1: | Line 1: | ||
=Use-case 3: ''“Proposals for a Greener Hoefkade”'' = | =Use-case 3: ''“Proposals for a Greener Hoefkade”'' = | ||
For their sustainable development minor, a group of 4 students of different backgrounds were assigned to use Tygron last year (2020) in order to develop a consultancy plan for the municipality of the Hague. This assignment was for an area study course the University of Leiden. Their research question was "How can more greenery and other climate adaptation measures be incorporated into the Hoefkade to mitigate heat stress and flooding while taking into account the opinions of residents and local employees?". In 4 weeks only, and without any prior knowledge of Tygron, the team learned how to use Tygron and created a full advisory plan for a greener Hoefkade neighborhood in collaboration with the Municipality of the Hague. They focused on the effects of greening on heat and water. | |||
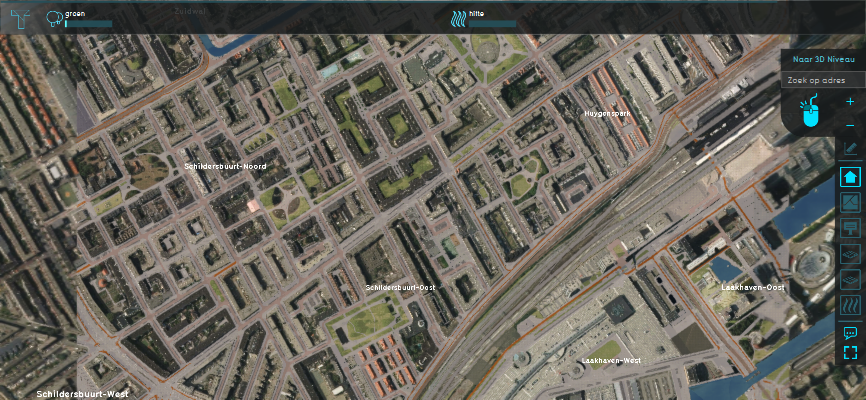
<gallery caption="Tygron Model showing the current situation in Hoefkade (scenario 0)" mode="packed-overlay" heights=200px> | <gallery caption="Tygron Model showing the current situation in Hoefkade (scenario 0)" mode="packed-overlay" heights=200px> | ||
| Line 9: | Line 9: | ||
[https://www.tygron.com/en/2020/04/03/student-use-case-leiden-university-students-for-a-greener-hoefkade/ Last year, students used Tygron for the first time in their course] | [https://www.tygron.com/en/2020/04/03/student-use-case-leiden-university-students-for-a-greener-hoefkade/ Last year, students used Tygron for the first time in their course] | ||
==Content of the course== | ==Content of the course== | ||
===General information=== | ===General information=== | ||
*'''Name of the course:''' "[https://studiegids.universiteitleiden.nl/courses/90161/area-study-sustainability-netherlands Area Study Sustainability Netherlands]" | *'''Name of the course:''' "[https://studiegids.universiteitleiden.nl/courses/90161/area-study-sustainability-netherlands Area Study Sustainability Netherlands]" | ||
| Line 18: | Line 17: | ||
===Target students=== | ===Target students=== | ||
*This course is designed for students who have already followed the Big Issues New Answers and Resilient Cities courses. | |||
*The students have limited prior experience with ArcGIS, but are not required to know the platform. | |||
*Students had no prior knowledge or accessibility to Tygron | |||
*This course is delivered every year for around 30 students | |||
*Students come from very different backgrounds | |||
*Students are expected to work alongside a representative from the municipality | |||
*Students can choose qualitative or quantitative approaches | |||
The students who were chosen to work with Tygron have the following backgrounds: | |||
#Annemiek de Looze: International Studies | |||
#Jos van der Sterre: Molecular Science & Technology / chemistry | |||
#Veerle Cannemeijer: International Relations & Organisations | |||
#Max van Beek: Molecular Science & Technology / chemical engineering | |||
===Objectives and desired outcome=== | ===Objectives and desired outcome=== | ||
This course aims at: | |||
*exploring a real-world and current sustainability challenge in a local city. | |||
*putting into practice the acquired theories and methods | |||
*analyzing the area challenges, solutions and the factors that obstruct these solutions. | |||
The main objective is for students to act as sustainability experts to provide sustainability advise to the City Councils of either Leiden or The Hague, based on their sustainability goals. | |||
The expected outcome of this course is: | |||
#a consultancy report that provides recommendations for a better implementation of the goals set by the city councils. | |||
#a contribution to a blog | |||
#a final presentation of the findings | |||
==Design of the Course== | ==Design of the Course== | ||
| Line 41: | Line 48: | ||
4 weeks | 4 weeks | ||
7 credits | 7 credits | ||
4-5 per group | |||
===Guidance and Resources=== | ===Guidance and Resources=== | ||
1 instructor - course coordinator | |||
Students are assigned a specific location | |||
Students working with the hague were chosen to try Tygron | |||
2=allowed to use tygron , downloaded Tygron on the laptop | |||
4th day: students went to Tygron headquarters to receive a demo, lecture, example | |||
Later students started working with Tygron. | |||
watched the video tutorials | |||
2 did interviews and 2 were focusing on the indicators and the scenarios. | |||
Students used their own laptops. One group member used his computer. | |||
Everything went very quickly in the third week after the configuration of the location and indicators. | |||
Last few days = report making and presentations | |||
made changes to the objects: added objects to the base map | |||
client = municipality | |||
Adding the municipality plan (trees, other objects) into tygron was challenging. | |||
Took the students around 1.5 weeks to get used to the platform | |||
Later, no direct support from Tygron. | |||
Used the forum to ask many questions. | |||
overlays | |||
measures | |||
Greenery indicator | |||
Heat stress | |||
Water stress | |||
Parking spaces | |||
Modifying indicators in one area | |||
Besides the excursion and the lectures, it was self-monitored | |||
Another group also was working on the same street (hoefkade) focusing on the effect of greening on the social cohesion | |||
This section is taken from the perspective of students who used Tygron for their report. | This section is taken from the perspective of students who used Tygron for their report. | ||
The main component of the course is the interdisciplinary group work, which is crucial to resolving sustainability challenges. There will also be lectures to provide additional content regarding the themes under study, field trips to provide context and opportunities for discussion. | The main component of the course is the interdisciplinary group work, which is crucial to resolving sustainability challenges. | ||
There will also be lectures to provide additional content regarding the themes under study, field trips to provide context and opportunities for discussion. | |||
Excursion to Tata Steel and an excursion to a waste incineration plant (related to sustainability) | |||
| Line 58: | Line 100: | ||
In order to do that, the students developed five different scenarios: the current situation, the all green scenario, the current redevelopment plan and two greener alternatives. For all of these scenarios, the group has used the Tygron Geodesign Platform in order to test the effects that the incorporation of greenery would have on flooding and heat. In the performed tests of the scenarios, the students used | In order to do that, the students developed five different scenarios: the current situation, the all green scenario, the current redevelopment plan and two greener alternatives. For all of these scenarios, the group has used the Tygron Geodesign Platform in order to test the effects that the incorporation of greenery would have on flooding and heat. In the performed tests of the scenarios, the students used | ||
the heat stress overlay and the water overlay integrated into the Platform. In order to measure how the situation has changed in the played scenarios a number of indicators such a modified version of the heat stress indicator, water indicator and the parking space indicator were used. | the heat stress overlay and the water overlay integrated into the Platform. In order to measure how the situation has changed in the played scenarios a number of indicators such a modified version of the heat stress indicator, water indicator and the parking space indicator were used. | ||
==Outcome and Assessment== | ==Outcome and Assessment== | ||
[[File:results_hoefkade.png|thumb|250px | [[File:results_hoefkade.png|thumb|right|heights=250px|Overview of the results of the different scenarios.]] | ||
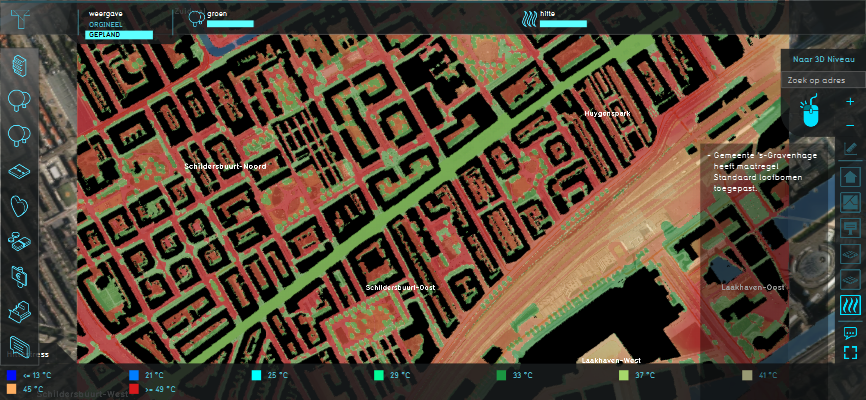
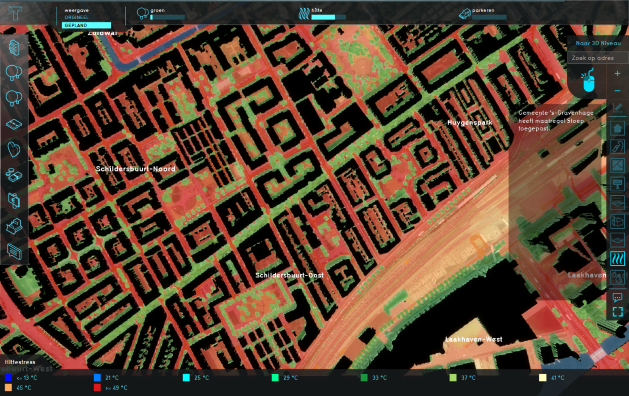
The tests performed in the Tygron software the students were able to conclude that the current plans for the Hoefkade will already prove to be effective and will reduce the heat up to 5,2oC. By simulating the green scenarios, they found out that adding even more greenery will only reduce the heat with an extra 0,10C. The tests with the Tygron Platform have shown that out of all green measures, trees are the most effective in reducing the temperature. While greenery proved to be the perfect solution in decreasing heat, it did not sufficiently reduce the problem of flooding. The tests in the Platform helped the students to find out that an effective solution for flooding could be water storage tanks and permeable bricks. | The tests performed in the Tygron software the students were able to conclude that the current plans for the Hoefkade will already prove to be effective and will reduce the heat up to 5,2oC. | ||
By simulating the green scenarios, they found out that adding even more greenery will only reduce the heat with an extra 0,10C. | |||
The tests with the Tygron Platform have shown that out of all green measures, trees are the most effective in reducing the temperature. While greenery proved to be the perfect solution in decreasing heat, it did not sufficiently reduce the problem of flooding. | |||
The tests in the Platform helped the students to find out that an effective solution for flooding could be water storage tanks and permeable bricks. | |||
The performance of the working group was very good. | |||
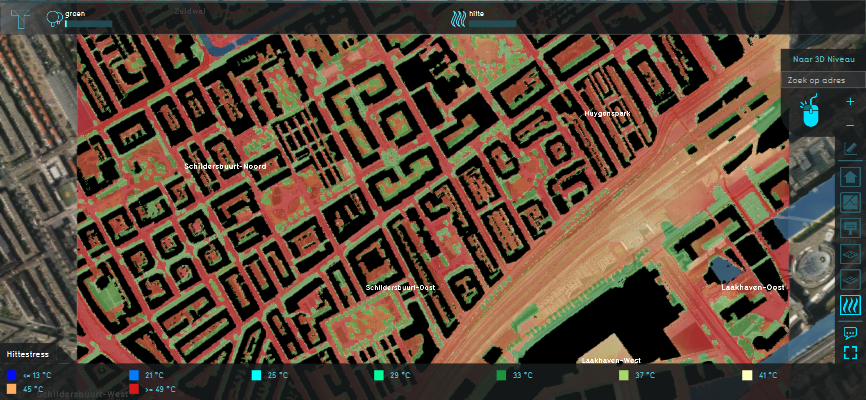
<gallery caption="Tygron model showing the absolute PET heat stress levels for different scenarios" mode="packed-overlay" heights=200px> | <gallery caption="Tygron model showing the absolute PET heat stress levels for different scenarios" mode="packed-overlay" heights=200px> | ||
| Line 68: | Line 119: | ||
File:heatstreeshoefkade2.png|Scenario 2 (municipality plan) | File:heatstreeshoefkade2.png|Scenario 2 (municipality plan) | ||
File:heatstreeshoefkade3.png|Scenario 3 | File:heatstreeshoefkade3.png|Scenario 3 | ||
</gallery> | </gallery> | ||
[[File:A-Greener-Hoefkade.pdf]] | [[File:A-Greener-Hoefkade.pdf]] | ||
==Feedback and recommendations== | ==Feedback and recommendations== | ||
Really tough learning curve, not recommended for a 4 week course. | |||
For a research project it is fine. | |||
| Line 90: | Line 143: | ||
include tree size, locations of facade gardens, and the location of parking spots we | include tree size, locations of facade gardens, and the location of parking spots we | ||
chose to delete. This is something for the municipality to look into more precisely. | chose to delete. This is something for the municipality to look into more precisely. | ||
Not all groups should do the same level. In this course, some groups were focused on neighborhoods and some were area level | |||
Lecture about tips and tricks with Tygron, this would make it smoother. | |||
Picking a smaller area so that it's not heavy for the laptop. | |||
Better to work with Tygron offline in a classroom setting. | |||
Recommend real stakeholders, because of the possibility of it really being implemented. | |||
<pre> | <pre> | ||
Revision as of 14:55, 4 March 2021
Use-case 3: “Proposals for a Greener Hoefkade”
For their sustainable development minor, a group of 4 students of different backgrounds were assigned to use Tygron last year (2020) in order to develop a consultancy plan for the municipality of the Hague. This assignment was for an area study course the University of Leiden. Their research question was "How can more greenery and other climate adaptation measures be incorporated into the Hoefkade to mitigate heat stress and flooding while taking into account the opinions of residents and local employees?". In 4 weeks only, and without any prior knowledge of Tygron, the team learned how to use Tygron and created a full advisory plan for a greener Hoefkade neighborhood in collaboration with the Municipality of the Hague. They focused on the effects of greening on heat and water.
Last year, students used Tygron for the first time in their course
Content of the course
General information
- Name of the course: "Area Study Sustainability Netherlands"
- Study Programme: Sustainable development (interdisciplinary minor)
- Educational Institute: Faculty of Science of Leiden University
Target students
- This course is designed for students who have already followed the Big Issues New Answers and Resilient Cities courses.
- The students have limited prior experience with ArcGIS, but are not required to know the platform.
- Students had no prior knowledge or accessibility to Tygron
- This course is delivered every year for around 30 students
- Students come from very different backgrounds
- Students are expected to work alongside a representative from the municipality
- Students can choose qualitative or quantitative approaches
The students who were chosen to work with Tygron have the following backgrounds:
- Annemiek de Looze: International Studies
- Jos van der Sterre: Molecular Science & Technology / chemistry
- Veerle Cannemeijer: International Relations & Organisations
- Max van Beek: Molecular Science & Technology / chemical engineering
Objectives and desired outcome
This course aims at:
- exploring a real-world and current sustainability challenge in a local city.
- putting into practice the acquired theories and methods
- analyzing the area challenges, solutions and the factors that obstruct these solutions.
The main objective is for students to act as sustainability experts to provide sustainability advise to the City Councils of either Leiden or The Hague, based on their sustainability goals.
The expected outcome of this course is:
- a consultancy report that provides recommendations for a better implementation of the goals set by the city councils.
- a contribution to a blog
- a final presentation of the findings
Design of the Course
Syllabus and time distribution
4 weeks 7 credits 4-5 per group
Guidance and Resources
1 instructor - course coordinator Students are assigned a specific location Students working with the hague were chosen to try Tygron 2=allowed to use tygron , downloaded Tygron on the laptop 4th day: students went to Tygron headquarters to receive a demo, lecture, example Later students started working with Tygron. watched the video tutorials 2 did interviews and 2 were focusing on the indicators and the scenarios.
Students used their own laptops. One group member used his computer. Everything went very quickly in the third week after the configuration of the location and indicators. Last few days = report making and presentations
made changes to the objects: added objects to the base map client = municipality
Adding the municipality plan (trees, other objects) into tygron was challenging. Took the students around 1.5 weeks to get used to the platform
Later, no direct support from Tygron. Used the forum to ask many questions. overlays measures Greenery indicator Heat stress Water stress Parking spaces Modifying indicators in one area
Besides the excursion and the lectures, it was self-monitored
Another group also was working on the same street (hoefkade) focusing on the effect of greening on the social cohesion
This section is taken from the perspective of students who used Tygron for their report.
The main component of the course is the interdisciplinary group work, which is crucial to resolving sustainability challenges. There will also be lectures to provide additional content regarding the themes under study, field trips to provide context and opportunities for discussion. Excursion to Tata Steel and an excursion to a waste incineration plant (related to sustainability)
In their project, the students investigated how the incorporation of greenery and climate adaptation measures could decrease the heat and flooding of Hoefkade.
How can more greenery and other climate adaptation measures be incorporated into the Hoefkade to mitigate heat stress and flooding while taking into account the opinions of residents and local employees?
In order to do that, the students developed five different scenarios: the current situation, the all green scenario, the current redevelopment plan and two greener alternatives. For all of these scenarios, the group has used the Tygron Geodesign Platform in order to test the effects that the incorporation of greenery would have on flooding and heat. In the performed tests of the scenarios, the students used
the heat stress overlay and the water overlay integrated into the Platform. In order to measure how the situation has changed in the played scenarios a number of indicators such a modified version of the heat stress indicator, water indicator and the parking space indicator were used.
Outcome and Assessment
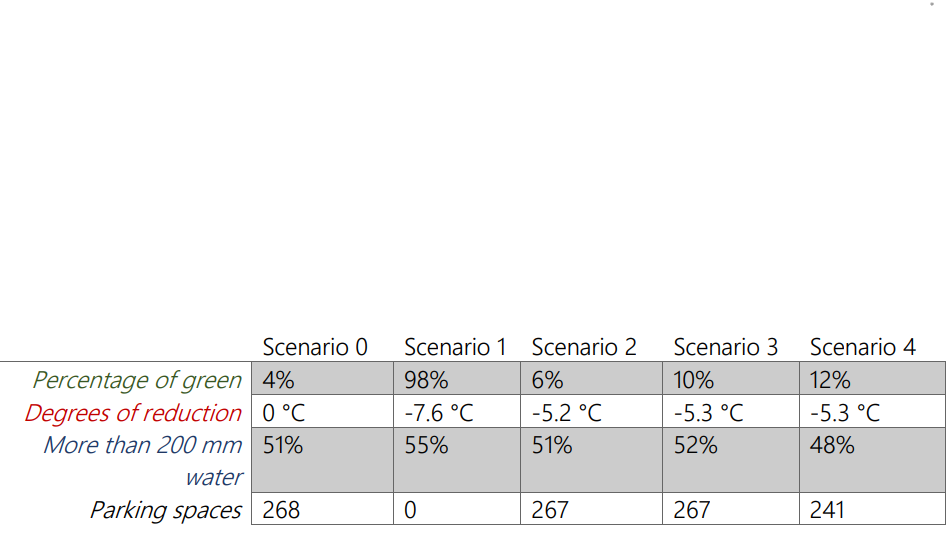
The tests performed in the Tygron software the students were able to conclude that the current plans for the Hoefkade will already prove to be effective and will reduce the heat up to 5,2oC.
By simulating the green scenarios, they found out that adding even more greenery will only reduce the heat with an extra 0,10C.
The tests with the Tygron Platform have shown that out of all green measures, trees are the most effective in reducing the temperature. While greenery proved to be the perfect solution in decreasing heat, it did not sufficiently reduce the problem of flooding.
The tests in the Platform helped the students to find out that an effective solution for flooding could be water storage tanks and permeable bricks.
The performance of the working group was very good.
Feedback and recommendations
Really tough learning curve, not recommended for a 4 week course. For a research project it is fine.
One of the biggest limitations for us was the different grid sizes
in Tygron. Some objects possess great precision, such as buildings loaded in from the plan of the municipality, while the heat and water overlays were limited to 0.5 m x 0.5 m. This made it difficult to accurately draw other objects into the programme, such as facade gardens or trees. The way Tygron calculates and uses different terrain types also caused some problems, forcing us to treat grass and fallow land as the same. Moreover, the biggest limitation with regards to calculating water stress was the automatically generated sewer system, as Tygron did not load in any sewer data. More research into the sewer of the Hoefkade is certainly recommended to find out if our water stress calculations are accurate. Moreover, the limited time we had to conduct this research led to us making certain assumptions in Tygron without having researched them thoroughly. Examples of this include tree size, locations of facade gardens, and the location of parking spots we chose to delete. This is something for the municipality to look into more precisely.
Not all groups should do the same level. In this course, some groups were focused on neighborhoods and some were area level Lecture about tips and tricks with Tygron, this would make it smoother. Picking a smaller area so that it's not heavy for the laptop. Better to work with Tygron offline in a classroom setting. Recommend real stakeholders, because of the possibility of it really being implemented.
"It’s is really nice to see how Tygron makes a conceptual thing like a scenario a lot more concrete, making it come alive in front of the students."

Dr. Benjamin Sprecher – Leiden University
"Tygron really brought our project to life. It was very interesting to be able to directly see the consequences of our ideas in the program. With Tygron we were able to make very concrete scenarios and that gave our project a lot of added value. We therefore hope that the municipality can do something with our findings to make the Hoefkade a bit more beautiful and sustainable."

Annemiek de Looze & Veerle Cannemeijer – the authors of the project
Contact
For more information about this course, you can contact us at: info@Tygron.com
You can also reach Max van Beek, a member of the working-group that used Tygron for this course: mcvanbeek@live.nl
Course Lecturer: Benjamin Sprecher
| <<Previous page | Next page>> |
