Tygron for GIS Data
Use-case 2: “Planting Trees to Reduce Heat Stress”
Bachelor student Max Brink (International Land and Water Management, WUR) decided to use the Tygron Geodesign Platform for his GIS research project. Despite having no prior knowledge of the platform, and despite having the option to use other tools, within 4 weeks, the student was able to produce interesting results using real Data and valid processing models. He wanted to find out the Most Effective Way of Planting Trees to Reduce Heat Stress and used the Rivierenwijk neighbourhood in Utrecht as a case study. This use-case highlights the added value of using the Tygron platform for courses that focus on processing geo-data.

Content of the course
General information
- Name of the course:"Geo-information Science BSc research project"
- Study-major: Geo-information for Environment and Society
- Study programme: Bachelor's International Land and Water Management
- Educational Institute: Wageningen University & Research
Target students
- The course is designed for GRS-minor students
- The course targets third-year Bachelor students
- The course requires students to have GIS skills
- Students are not required to have any prior knowledge of the Tygron platform
- Around 15 students attend this course
Objectives and desired outcome
The main objective of this course is to apply GIS and remote sensing knowledge to real-life projects.
To do that students are expected to conduct a limited spatial research project and present it at the end of the course.
The research must include:
- A research objective and research questions
- A brief report on current research related to the project
- The methodology that is used to process geo-data (spatial data processing or remote sensing)
- The use of a GIS or remote sensing application for analysis
- Results and conclusions to answer the research question
The expected outcome of this course:
- A research paper focusing on a real case-study, to prepare students for their theses later on.
- A presentation of the findings
Design of the Course
Syllabus and time distribution
- The course is full time and spread over 4 weeks
- It is self-monitored
- There are 6 credits assigned for this course
- It is delivered in English
- It starts with an introductory lecture
- Students choose their own subjects.
- Any topic is allowed as long as it is related to GIS or remote sensing, such as deforestation, agriculture, landscape, forestation, etc.
- They work individually throughout the course with minor supervision.
- At the end of the course:
- students submit their research papers
- they showcase their results through individual presentations during a final lecture.
Using the Tygron platform
- For this year's course (2021), Student Max Brink decided to use the Tygron platform.
- He wanted to find out the Most Effective Way of Planting Trees to Reduce Heat Stress
- He used the Rivierenwijk neighbourhood in Utrecht as a case-study.
- His research question was:
What is the most effective way to place trees to reduce the PET* during a heat wave in Utrecht?
- To do that, he compared the effect of trees planted in rows along roads to that of trees planted in groups.
(*) Physiological Equivalent Temperature'
Guidance and resources

This section is taken from the perspective of Max because he used Tygron for his research.
Because the course is self-monitored and spread over 4 weeks, the following process explains how Max was able to use Tygron for his individual research:
- At the beginning of the course, it took around one week to:
- decide on a research topic
- receive the Tygron credentials from the university to start using the platform.
- It took the student around 1 day to get to know the Tygron platform.
- He used the heat stress demo to explore the overlay functions, but he did not use a template for his research.
- It took around 1 week to know what to do with the platform(for example: exporting results, recording, etc.)
- He started with a blank project.
- To self-tutor himself, the student mainly used the following wiki tutorials:
- The student also used Tygron's heat overlay wizard to import data manually.
- He used the weather data from the Royal Netherlands Meteorological Institute (KNMI)
- The student did not require any direct support from Tygron.
- The student was using his own laptop and did not face any technical difficulties working with the platform.
The outcome of the course
As mentioned earlier, the students are required to produce a research paper and a presentation as part of this course.
During this year's course, while other students used different software, Max was able to answer his research question.
That is because the Tygron platform makes it easy to place the trees and to calculate their effects in real contexts and based on real modules (such as the DPRA Heat Module).
Using the Tygron platform, the student was able to:
- compare the effect of placing trees on lanes and in groups
- Compare the effect at different times of the day (14:00 and 17:00)
- He also unexpectedly found out that trees could have a negative effect on the heat stress because they can decrease the wind speed.
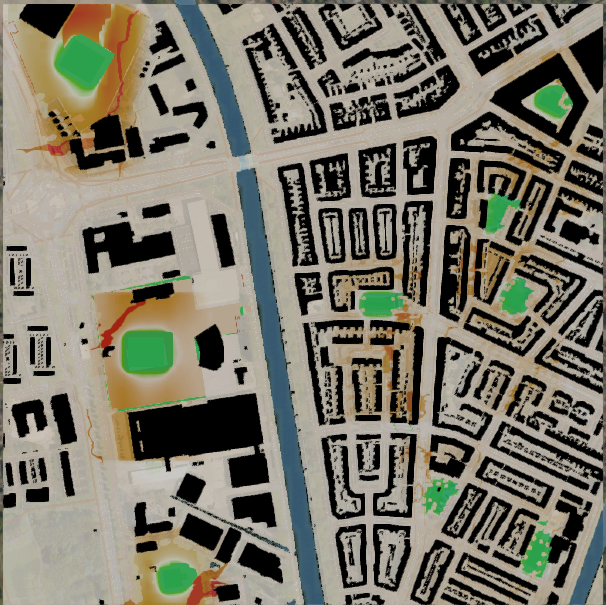
- Tygron Model showing the heat stress in the Rivierenwijk at 14:00 using the DPRA Heat Module
-
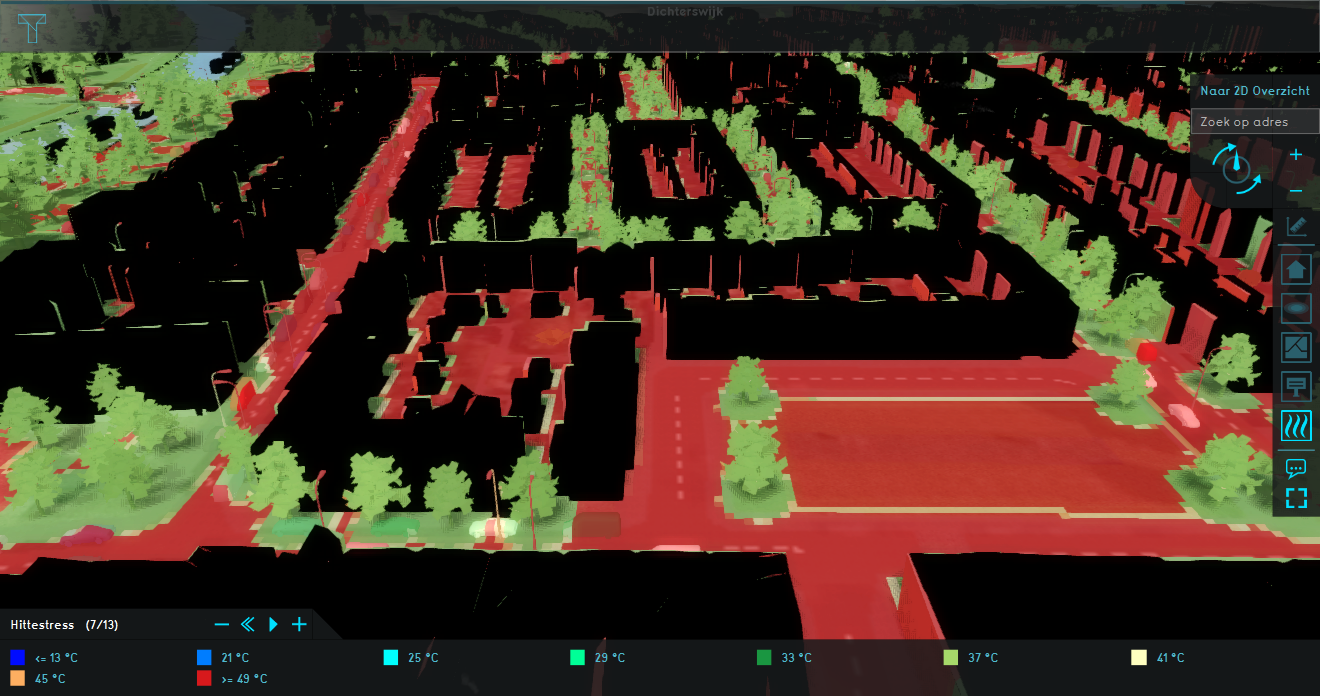 Current situation
 -
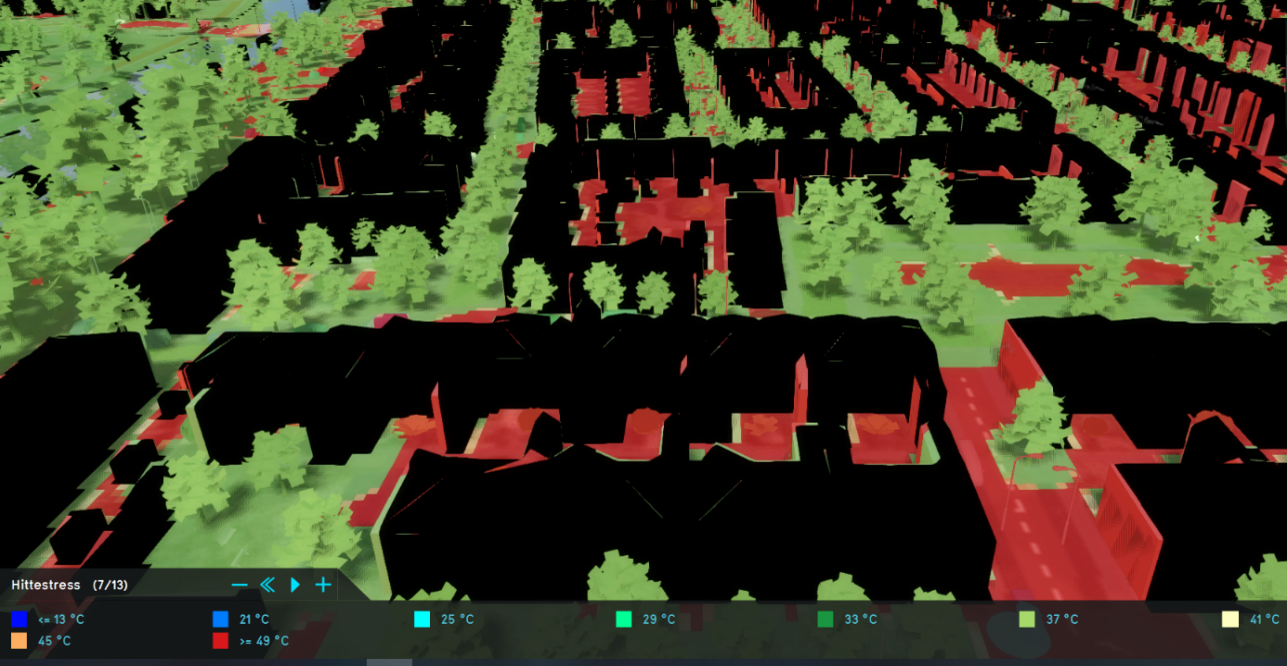 The situation with trees placed in lanes
 -
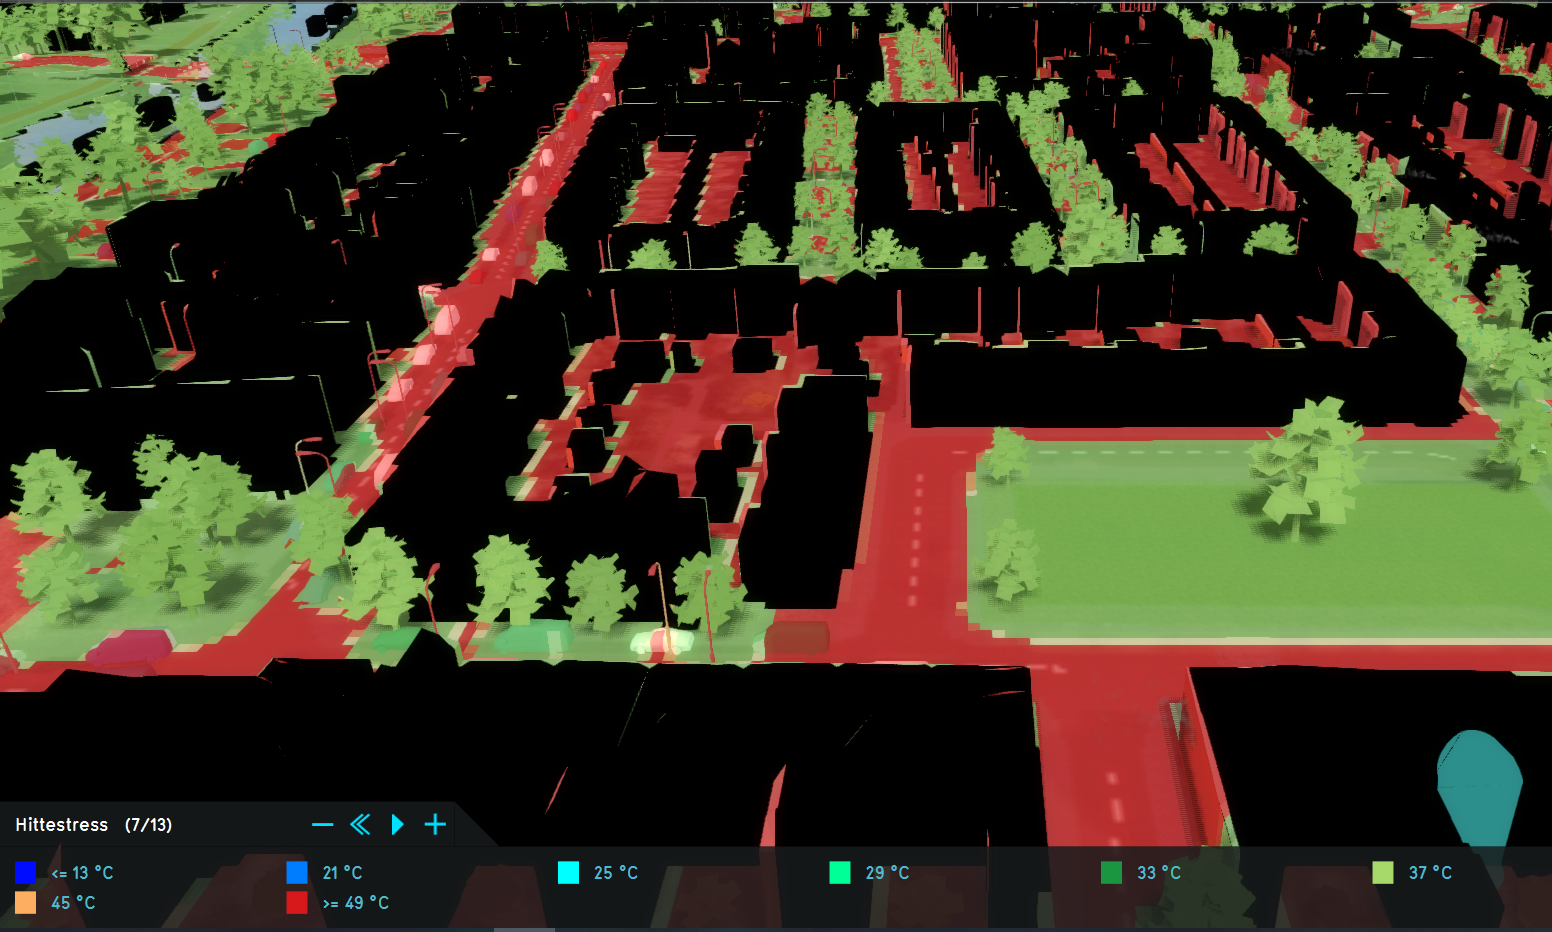 The situation with trees placed in groups


To present his finding at the end of the course, Max created:
- a presentation of the findings using StoryMaps. You can find his StoryMap here:Link to Max's StoryMap
- a research paper that you can download here: File:Report GIS BSc Research Project Max Brink.pdf
- Maps showing the increase or decrease of the PET (Physiological Equivalent Temperature) heat stress in the Rivierenwijk at 17:00
-
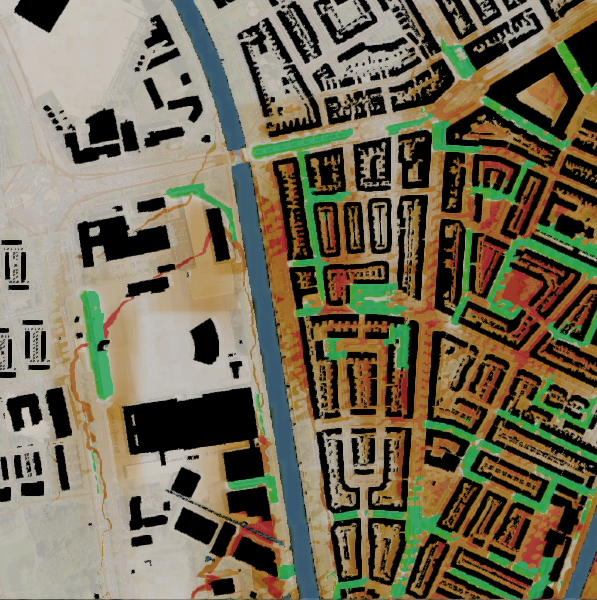 The ituation with trees placed in lanes
 -
 The situation with trees placed in groups


Feedback and recommendations
According to the student, these are the most relevant challenges of using Tygron for this course:
- The maximum size per project allowed for the educational license is 1 km x 1 km (1 square km). This could be challenging especially when the case-study area is longitudinal and does not fit into the maximum frame. To fix this problem, Max had to clip out some of neighbourhood during the analysis phase.
- The test-run function is confusing because once the test-run is over, the scenario goes back to the current situation. To avoid that, it is recommended to take videos and screenshots of the results while trying different scenarios.
However, the student explains the added value of using the Tygron platform for this course:
- The platform is very time-saving for researchers, especially when it comes to the calculation of effects with real geo-data.
- The overlay options are very useful for this type of research.
- The wiki offers very extensive explanations about the heat overlays and they work (they are based on government reports). This could be very valuable for researchers because they can use the wiki as a reference in their methodology section.
- Learning the platform does not only help with the assignment. It creates internship opportunities for students like Max, who is pursuing an internship related to Tygron.
"It was really nice to have so many details and to use all these different factors like wind, urban heat island effect and all other factors in one project without requiring a lot of time because a lot of things are already included in Tygron".

Max Brink, WUR
Additionally, the student finds that the 4 weeks were sufficient enough for this course, and recommends that this type of research be done individually.
Contact
For more information about this course, you can contact us at:
You can also reach Max Brink, the student who used the Tygron platform in this course: .
| <<Previous page | Next page>> |