Radial well aquifer benchmark (Water Module): Difference between revisions
Jump to navigation
Jump to search
| Line 25: | Line 25: | ||
[[Inlet q (Water Overlay)|INLET Q]] is set to <math>\frac{-Q_0}{3600*24}</math> | [[Inlet q (Water Overlay)|INLET Q]] is set to <math>\frac{-Q_0}{3600*24}</math> | ||
[[ | [[Inlet underground (Water Overlay)|UNDERGROUND]] is set to true (1.0) to place the outlet below the surface. | ||
===References=== | ===References=== | ||
Revision as of 15:53, 16 December 2020
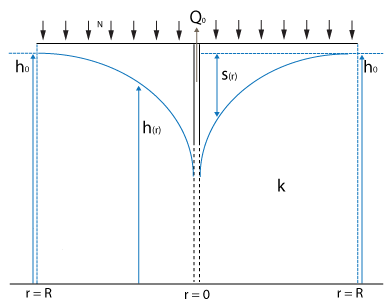
This testcase demonstrates a situation where a well is pumping up ground water. A characteristic ground water level curve will form over time.
Formulas
Stationary lowering of the ground water table in a closed water transmissive layer can be described by the following formula [1]
where:
- : stable water level at the considered stable water table edge
- : water level between the considered stable water table edge and the well
- : water level in the well
- : transmissivity of the aquifer in m² / day
- : distance to the well
- : distance of the considered stable water table edge to the well
- : amount of water pumped out in m³ / day
Setup
We use the following setup in our tests. The grid size used is 51 by 51, with a configurable cell size of in meters. There is one underground outlet, which pumps water away continuously with a default amount per second.
The outlet is placed on the cells x = 25 and y = 25 as an inlet with a negative inlet.
INLET Q is set to
UNDERGROUND is set to true (1.0) to place the outlet below the surface.
References
- ↑ Verruijt, A. (1970). Theory of Groundwater Flow. Macmillan, London.


