Avg shore width m (Water Overlay): Difference between revisions
Jump to navigation
Jump to search
No edit summary |
No edit summary |
||
| Line 3: | Line 3: | ||
{{Overlay attributes|type=row|overlay=Water | {{Overlay attributes|type=row|overlay=Water | ||
|attribute=AVG_SHORE_WIDTH_M | |attribute=AVG_SHORE_WIDTH_M | ||
|unit= | |unit=m | ||
|description=With the surface water mode set to Grid Averaging, identified water average areas can be extended to include nearby shorelines within the configured distance. | |description=With the surface water mode set to Grid Averaging, identified water average areas can be extended to include nearby shorelines within the configured distance. | ||
|defaultvalue=3 | |defaultvalue=3 | ||
Revision as of 12:13, 29 January 2024

| Icon | Attribute | Unit | Range | Description | Default value |
|---|---|---|---|---|---|
| |
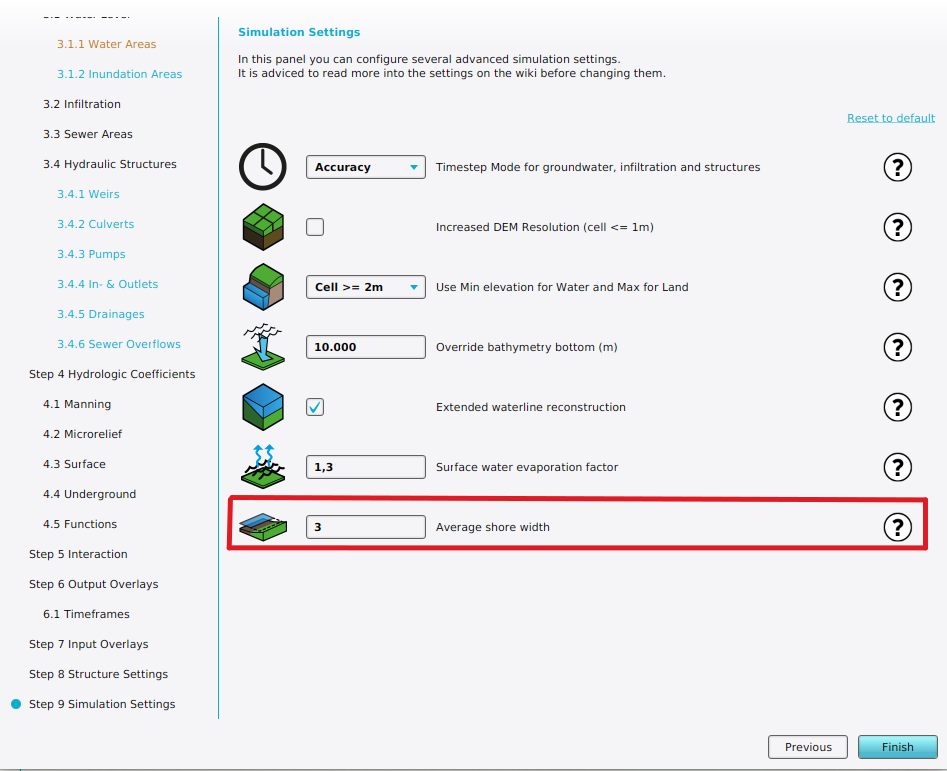
AVG_SHORE_WIDTH_M | m | With the surface water mode set to Grid Averaging, identified water average areas can be extended to include nearby shorelines within the configured distance. | 3 |
Water polygons supplied by Geo data often do not include the shorelines around it, which could still contain water due to overflowing. Additionally, shorelines are important for the interaction between ground water and water ways.
-
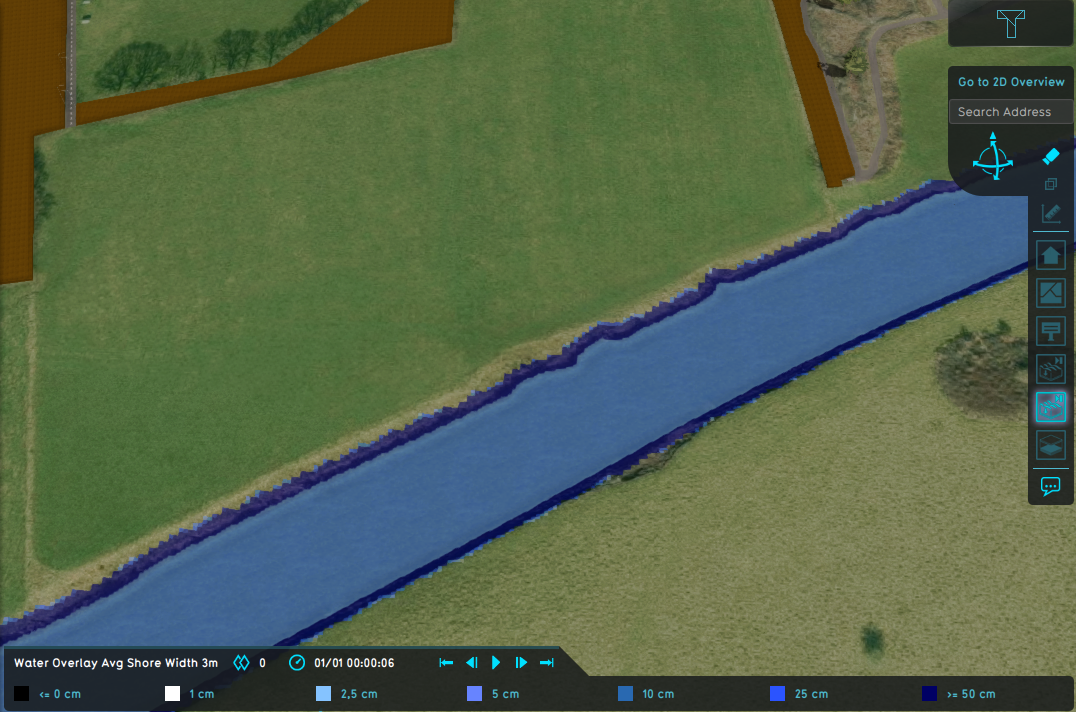
Water Overlay with set to Grid Averaging Waterways and an average shore width of 3m.
-
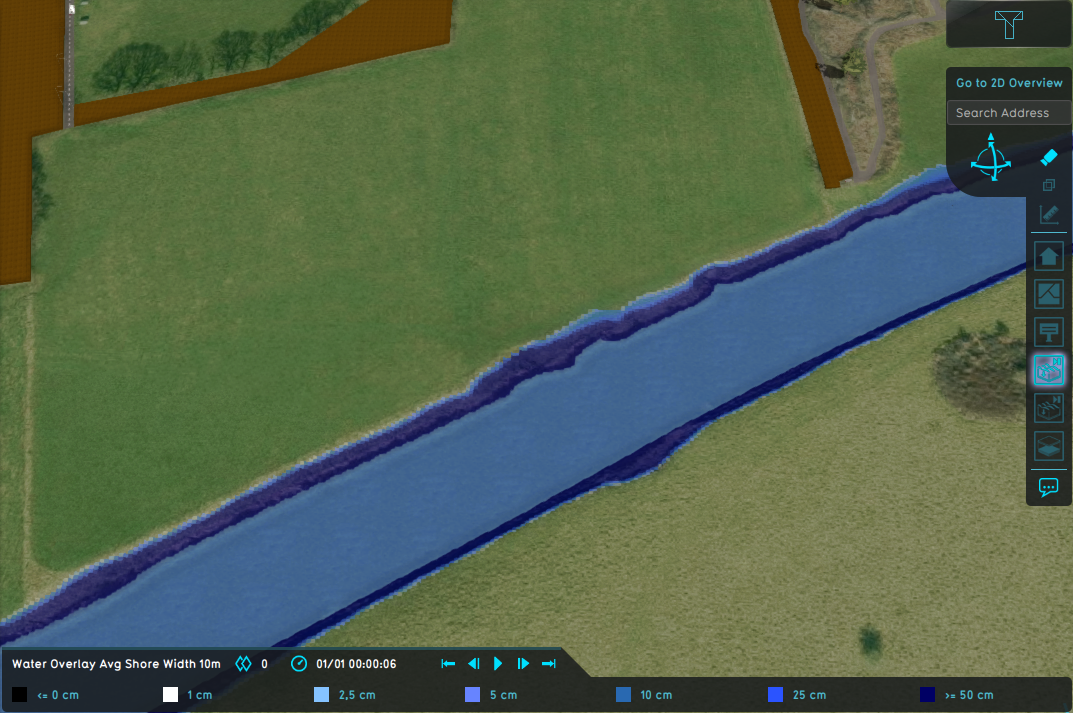
Water Overlay with set to Grid Averaging Waterways and an average shore width of 10m.
-
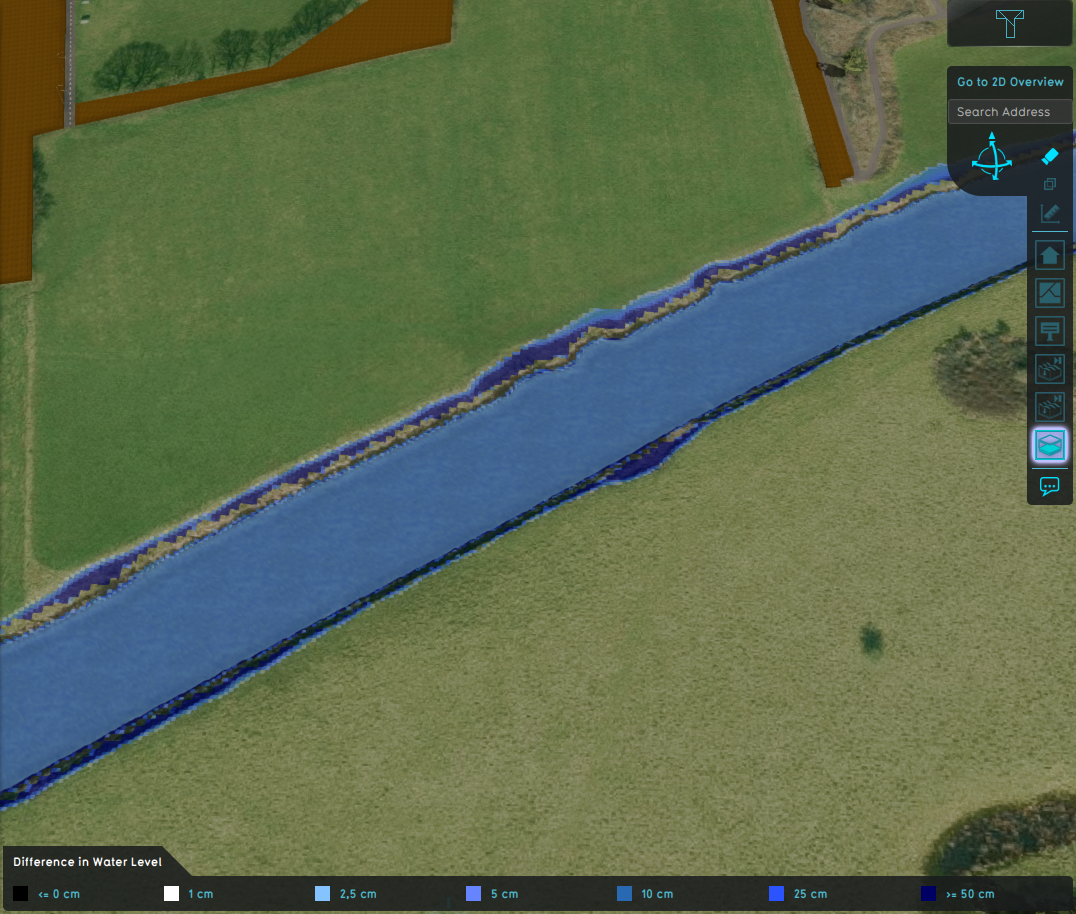
Difference in water level.


