Stowa 2017 benchmark (Water Module)
The Stowa 2017 benchmark was set up in order to find out which tool currently available to the Dutch Water management industry performs reliable in which circumstances. The goal of the benchmark was to provide insight to waterboards and municipalities which water simulation tool would suit their needs best. The benchmark consist of several topics:
- Rain water discharge for several types of terrain
- Underground water infiltration
- Flow direction and speed
- 2D-1D interaction between surface water and water objects such as weirs and culverts.
For the complete benchmark, see benchmark 2017.
Please note that the referenced document contains results made in 2017, with a model that was not yet using the 2D Saint Venant equations.
The Water Module has been much improved since 2017 and is now based on the finite volume method described by Kurganov et al.
The results presented below have been generated on 04-09-2019.
Test case 1
Test case 2
Test case 3
Test case 4
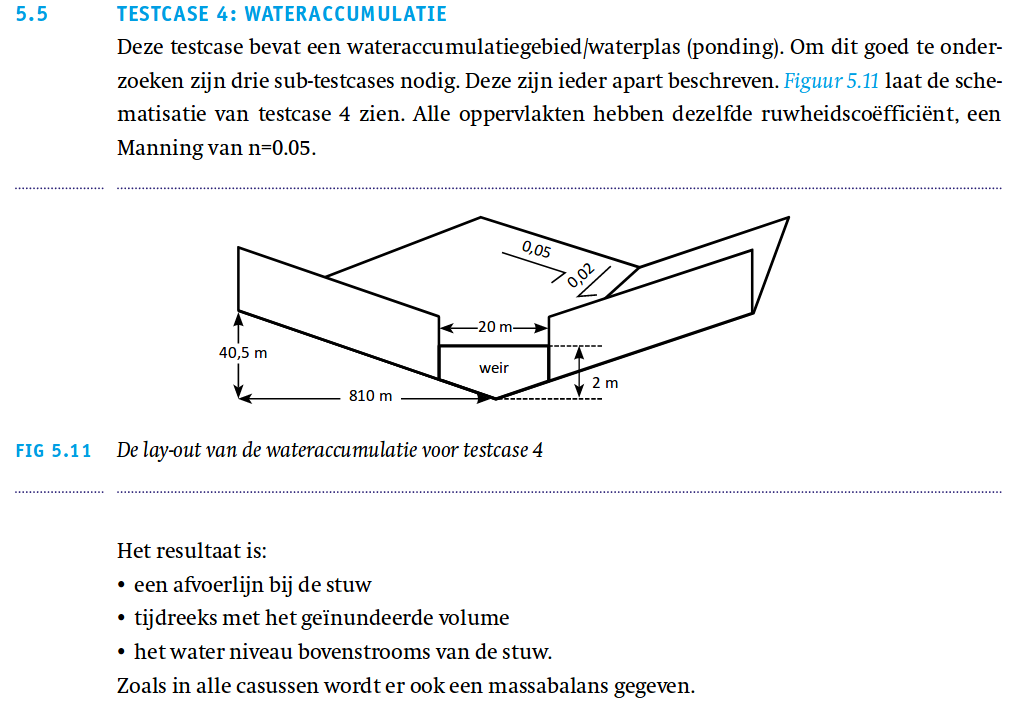
This testcase contains a ponding problem. This testcase is subdivided into 3 sub-testcases in order to investigate several aspects of this ponder problem. Each is described below. See image 5.11 for the layout of the problem. Each surface in this test case has a Manning roughness value of 0.05.
Setup
For each test case the base setup is the same.
Test case 4A
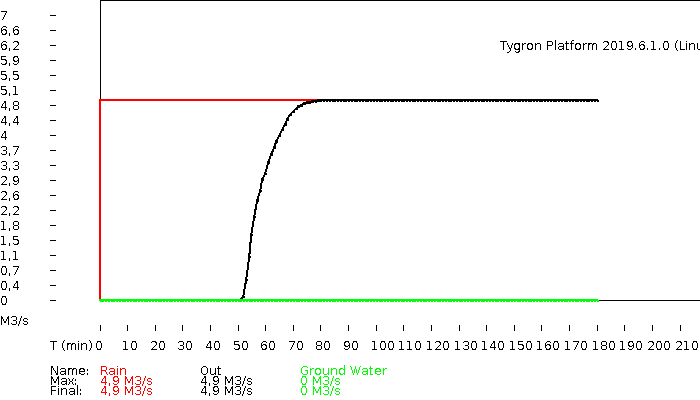
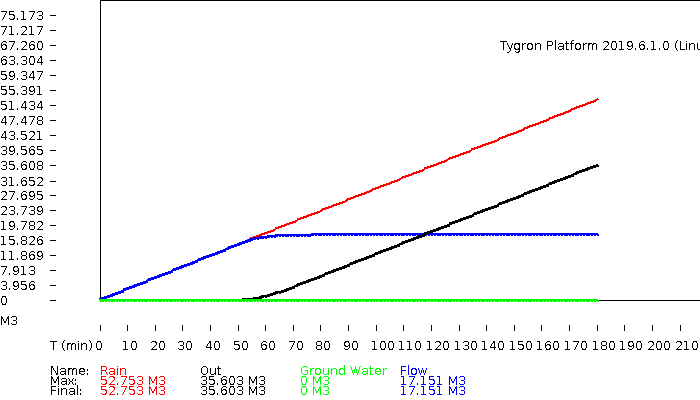
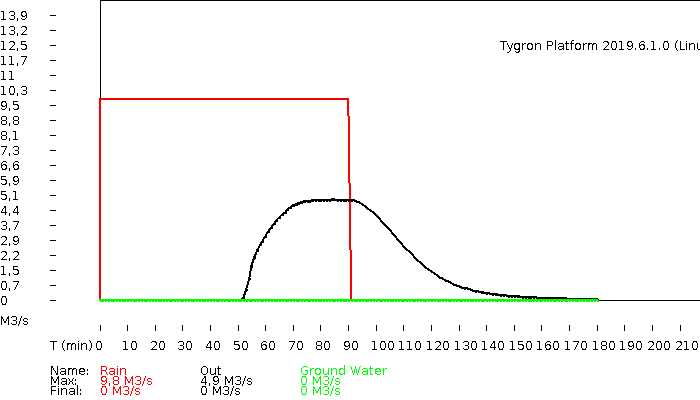
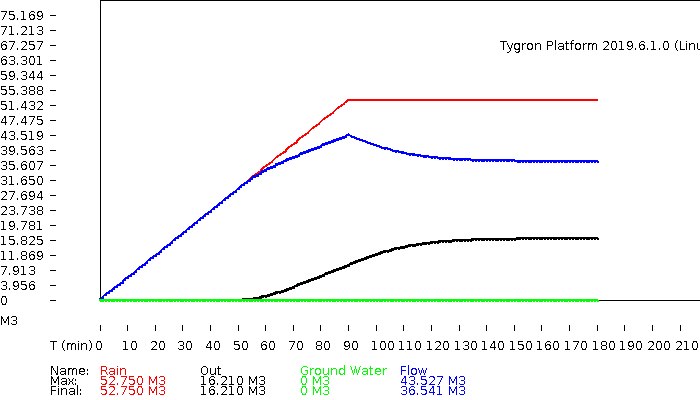
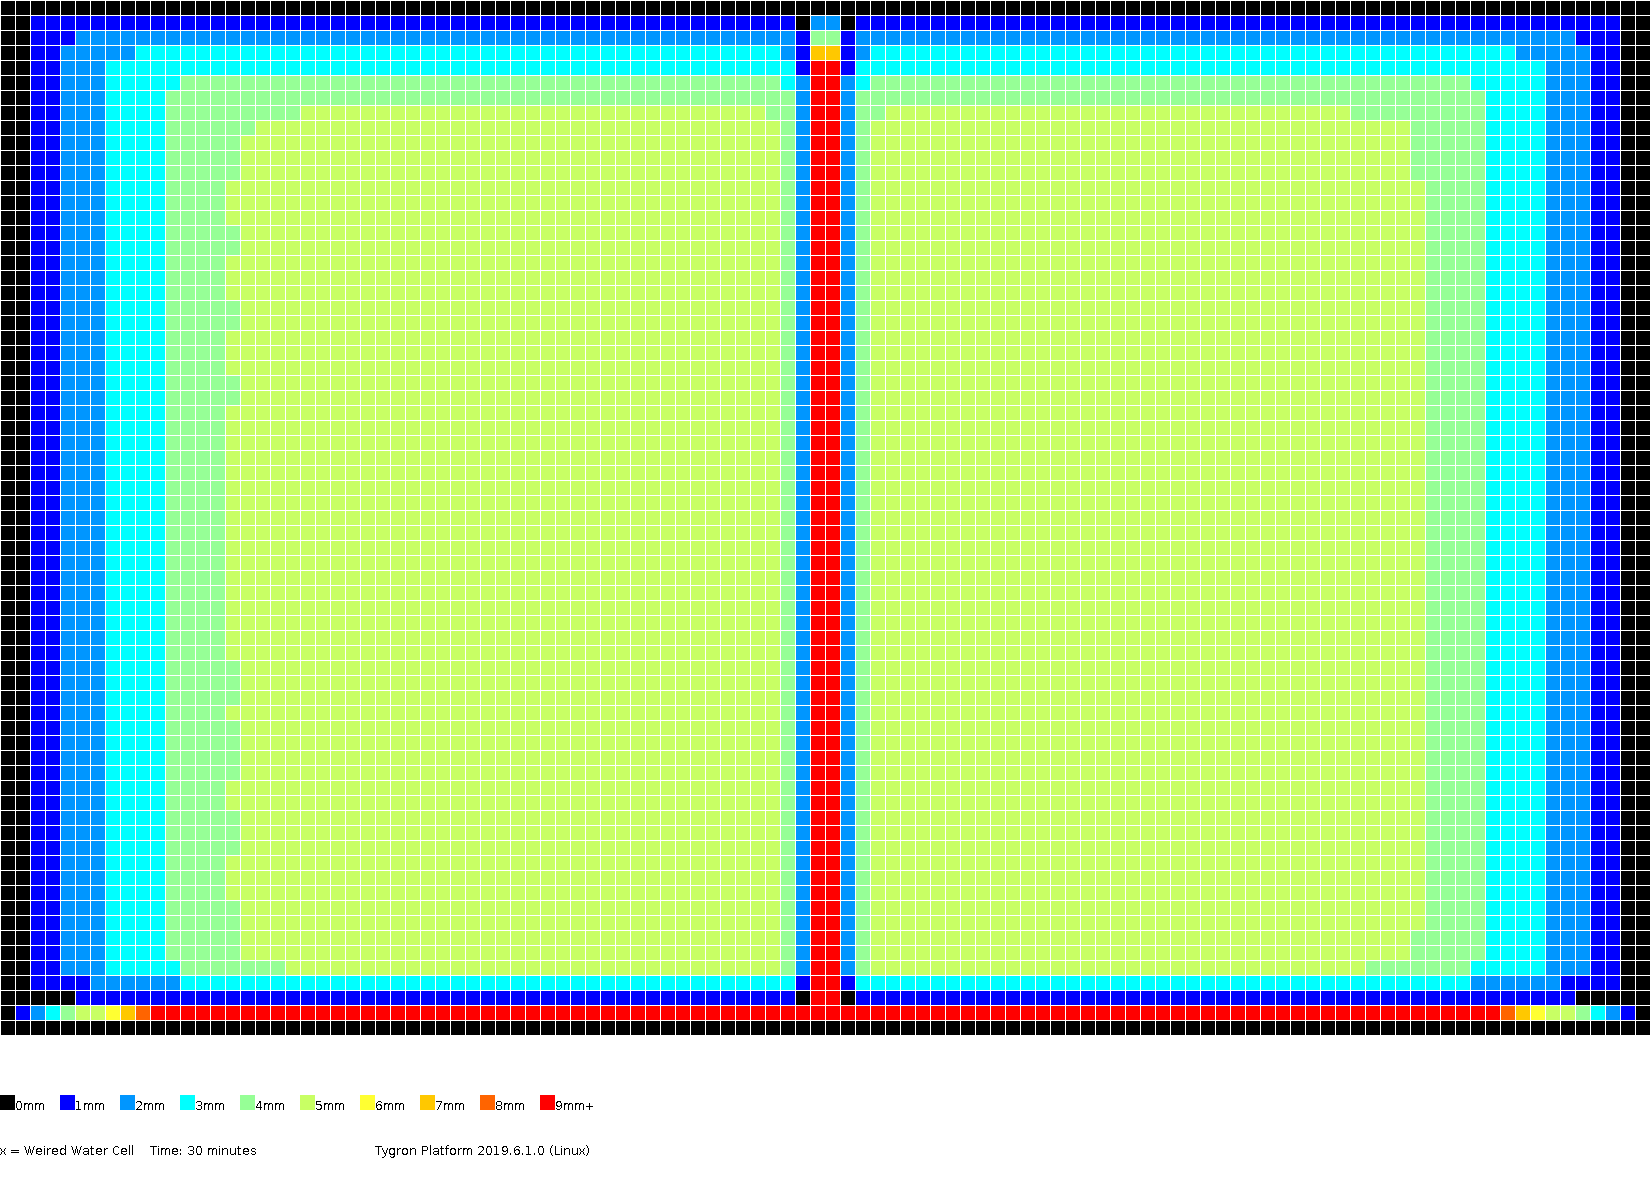
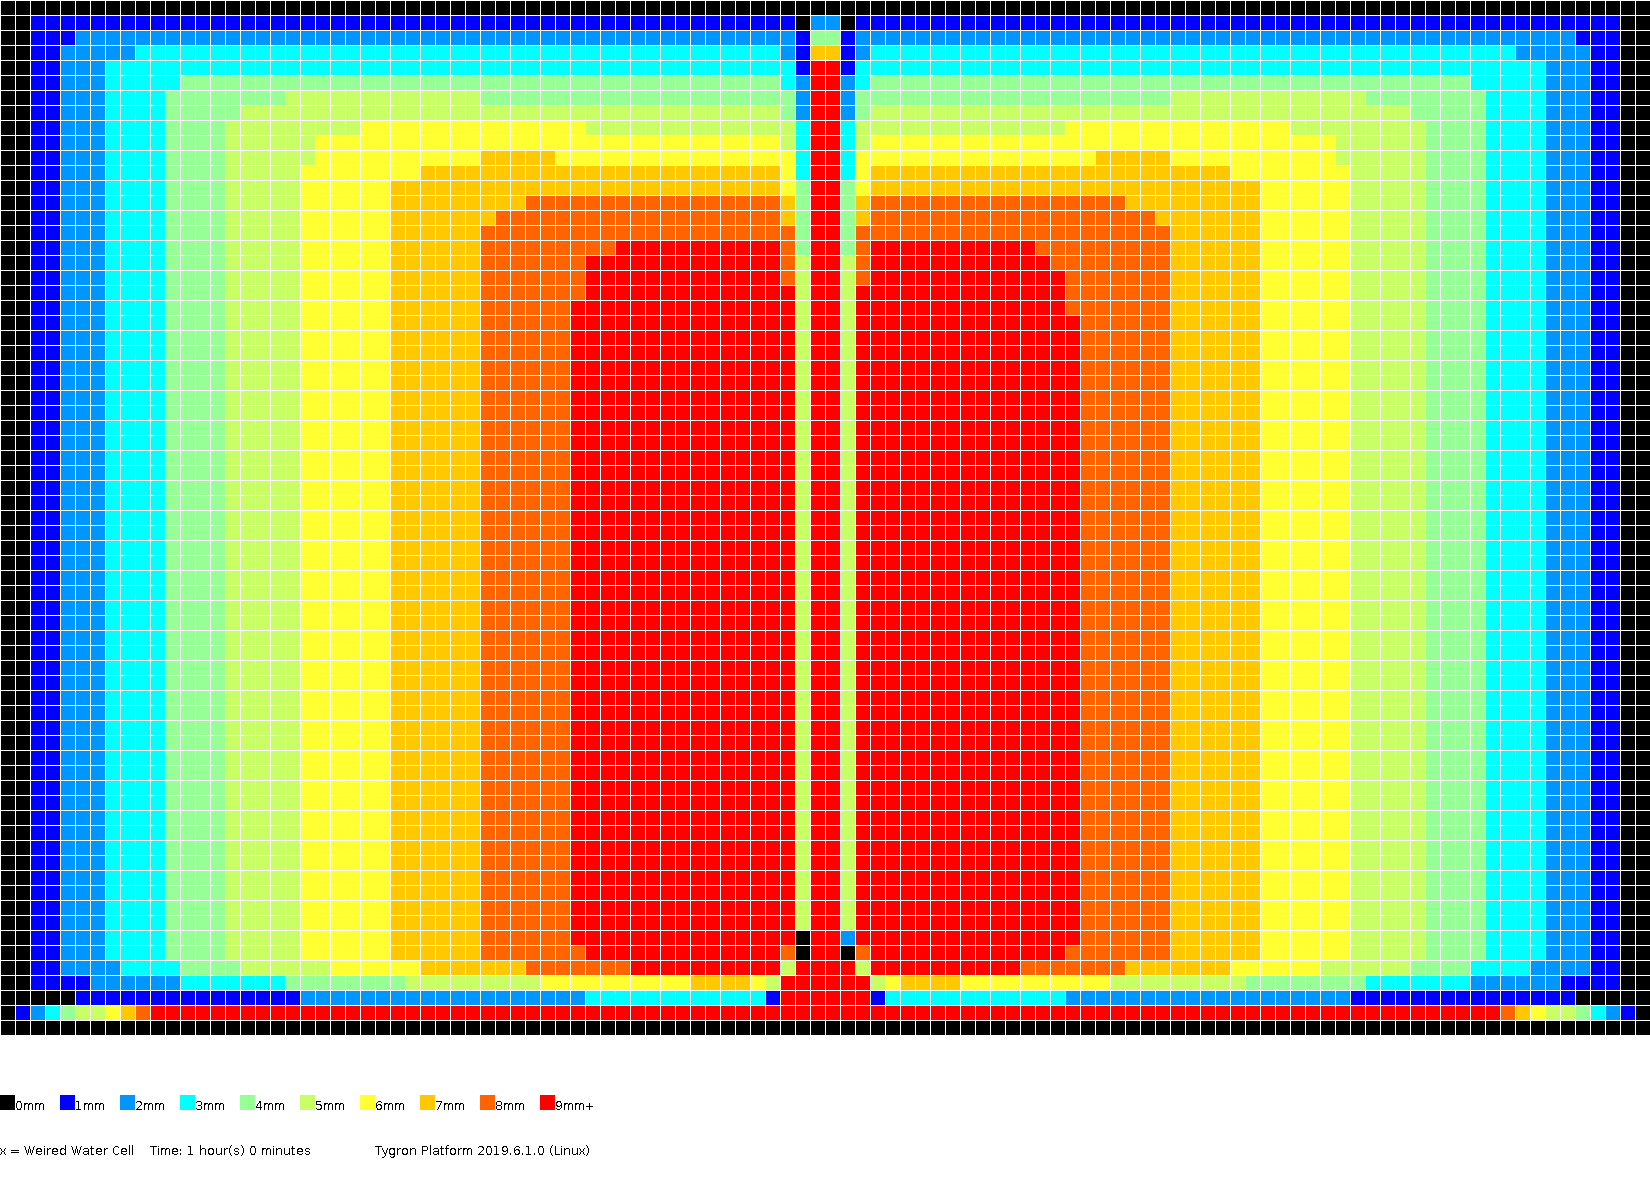
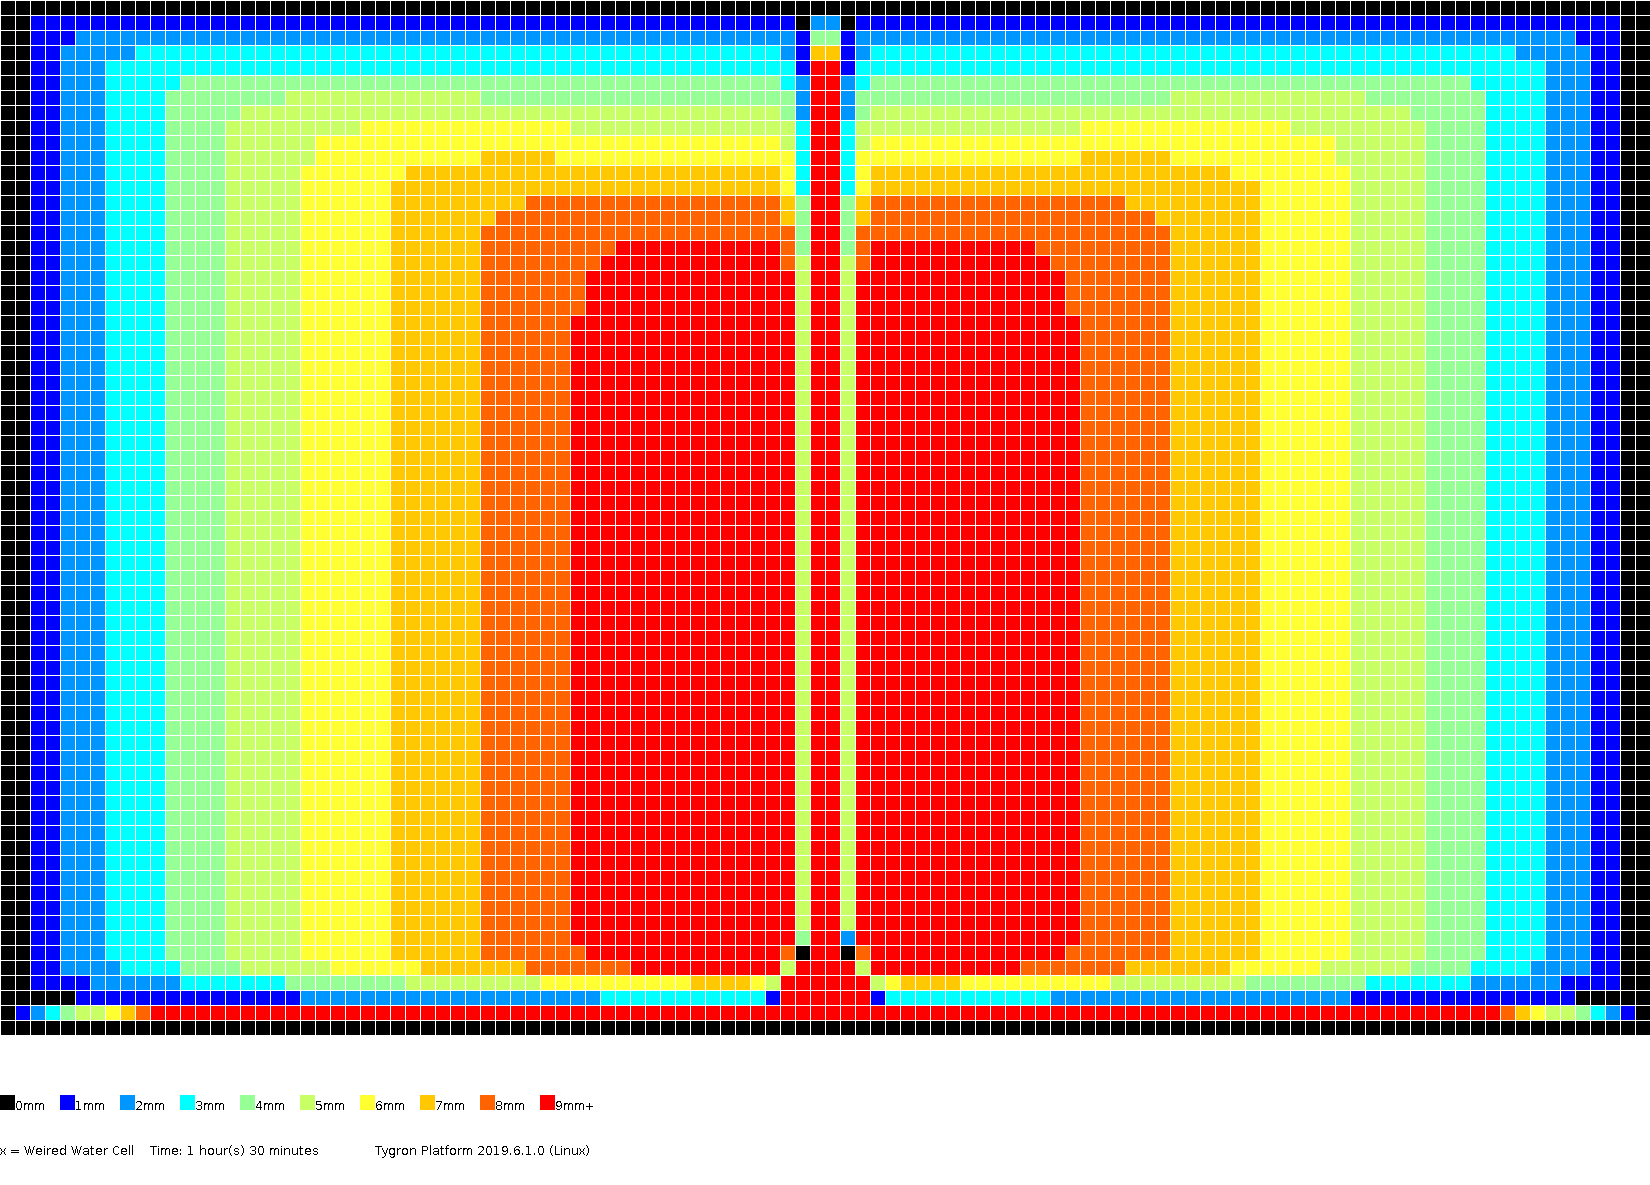
In this testcase, the amount of rainfall is similar to testcase 3. However, it continues to rain until the end of the simulation. The surface and underground are impenetrable. And the weir is considered to be 'perfect'.

Results
The hydrograph and volume.
-
hydrograph
-
volumes
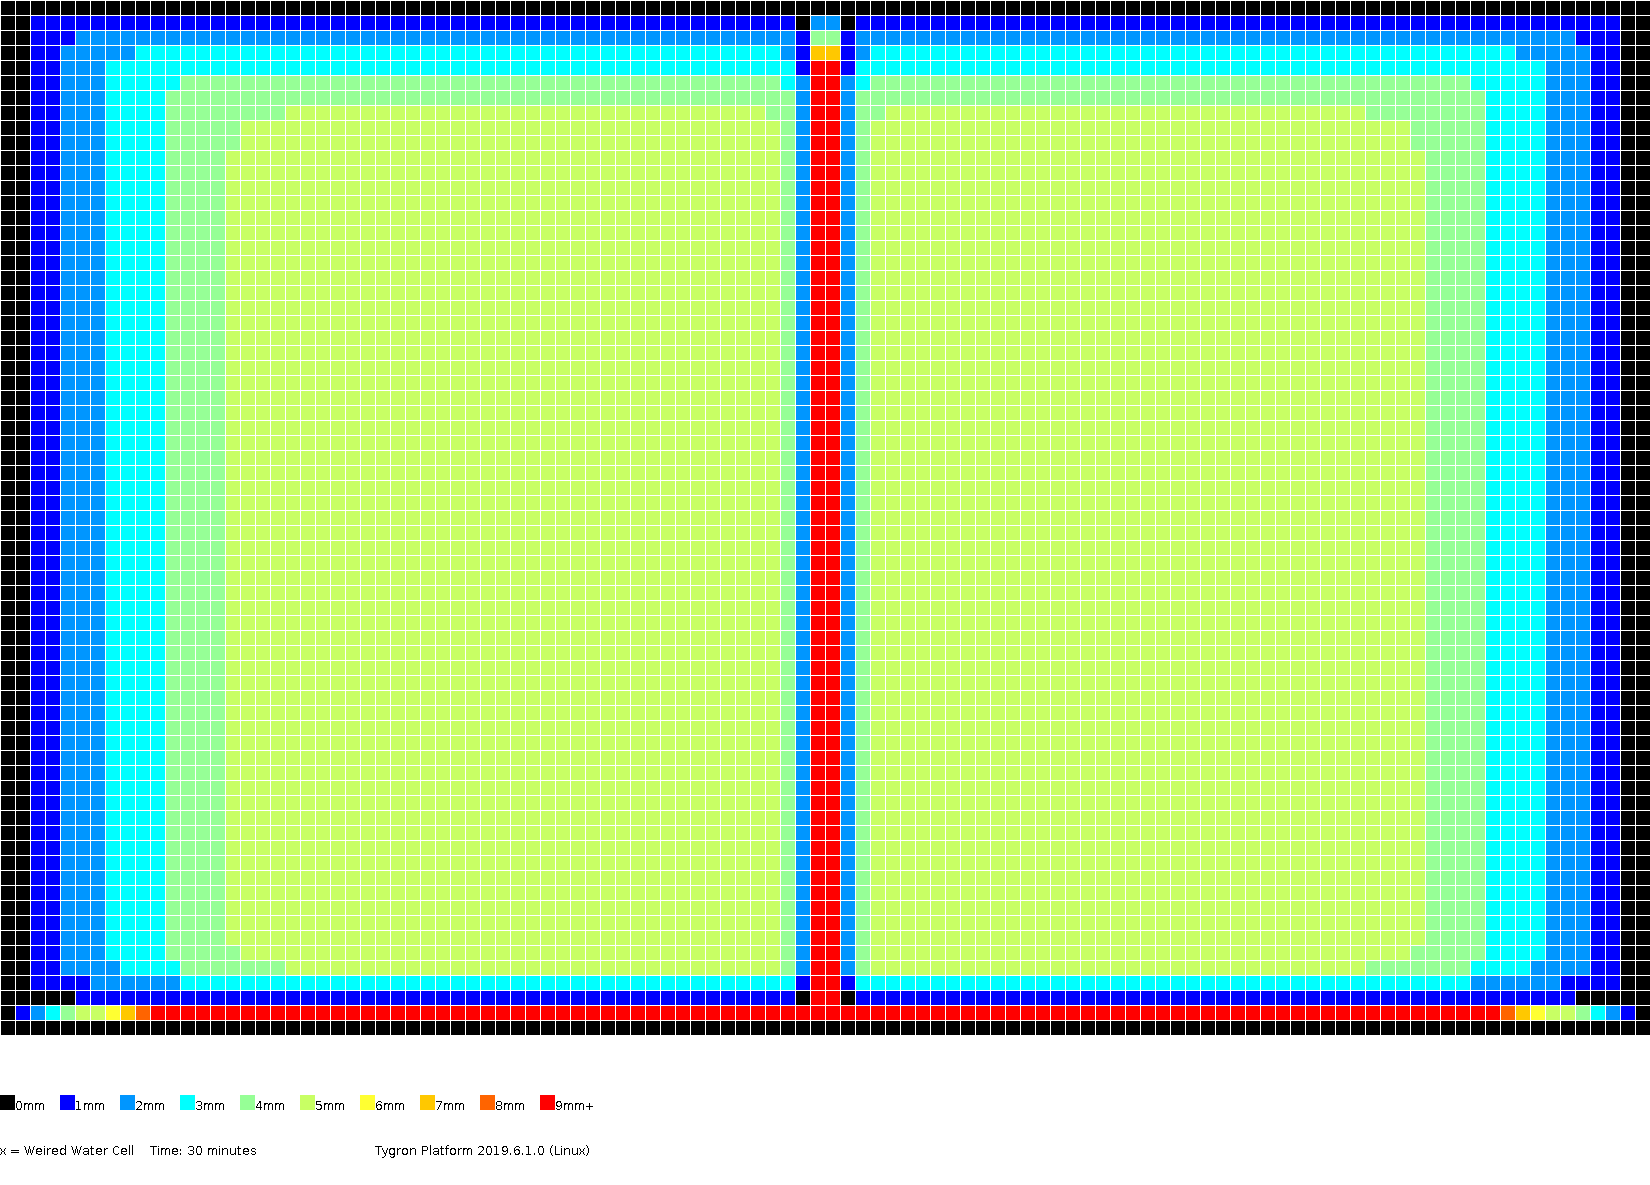
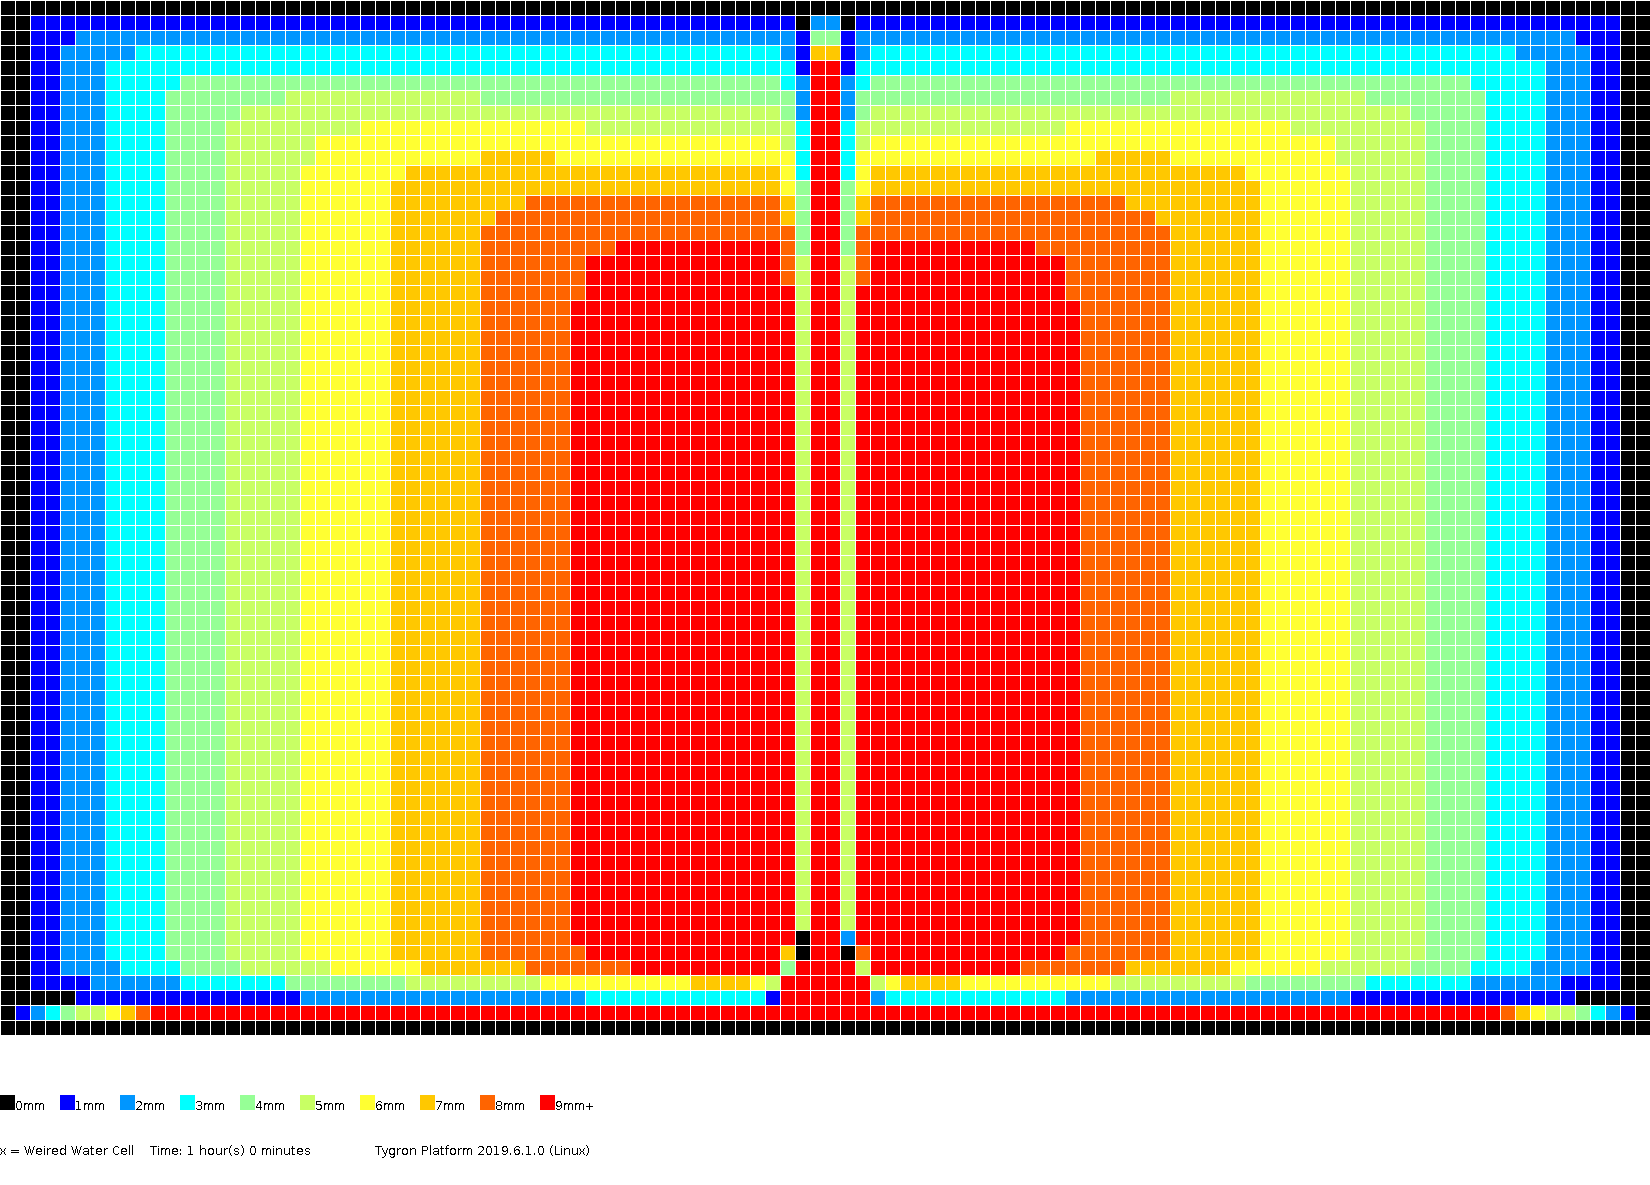
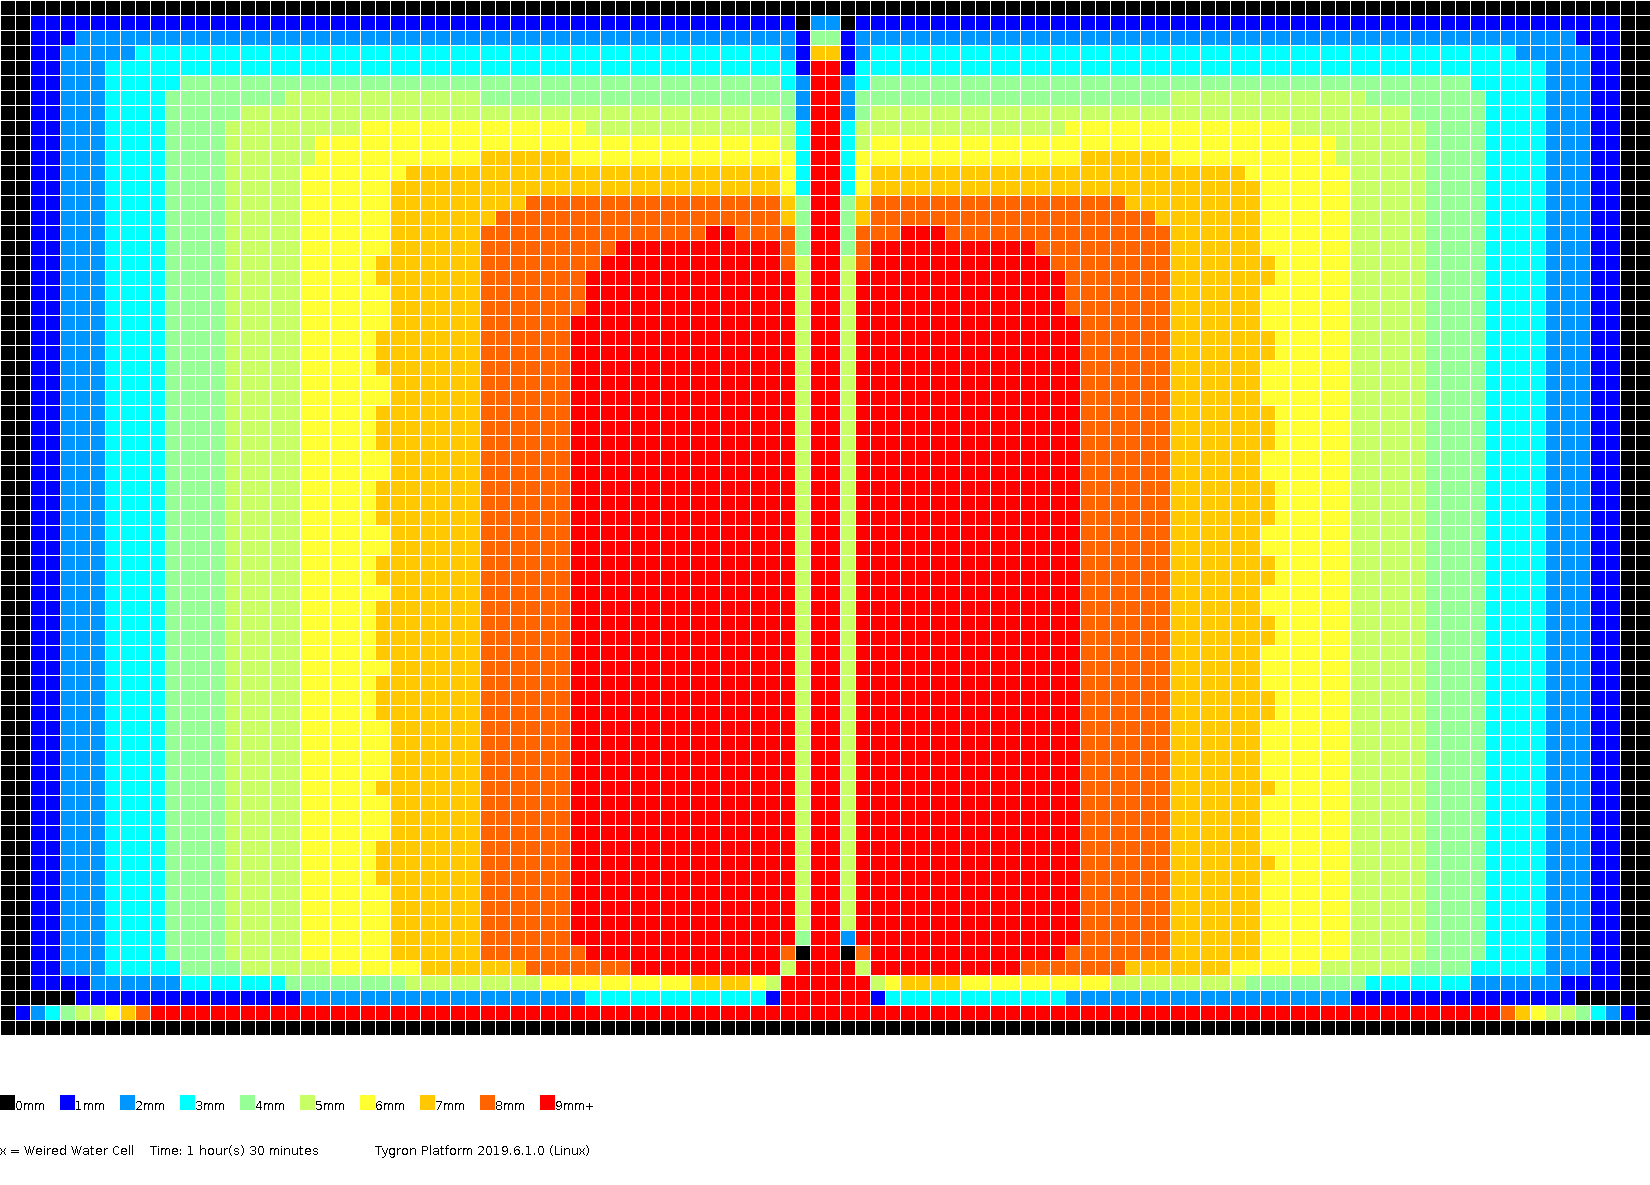
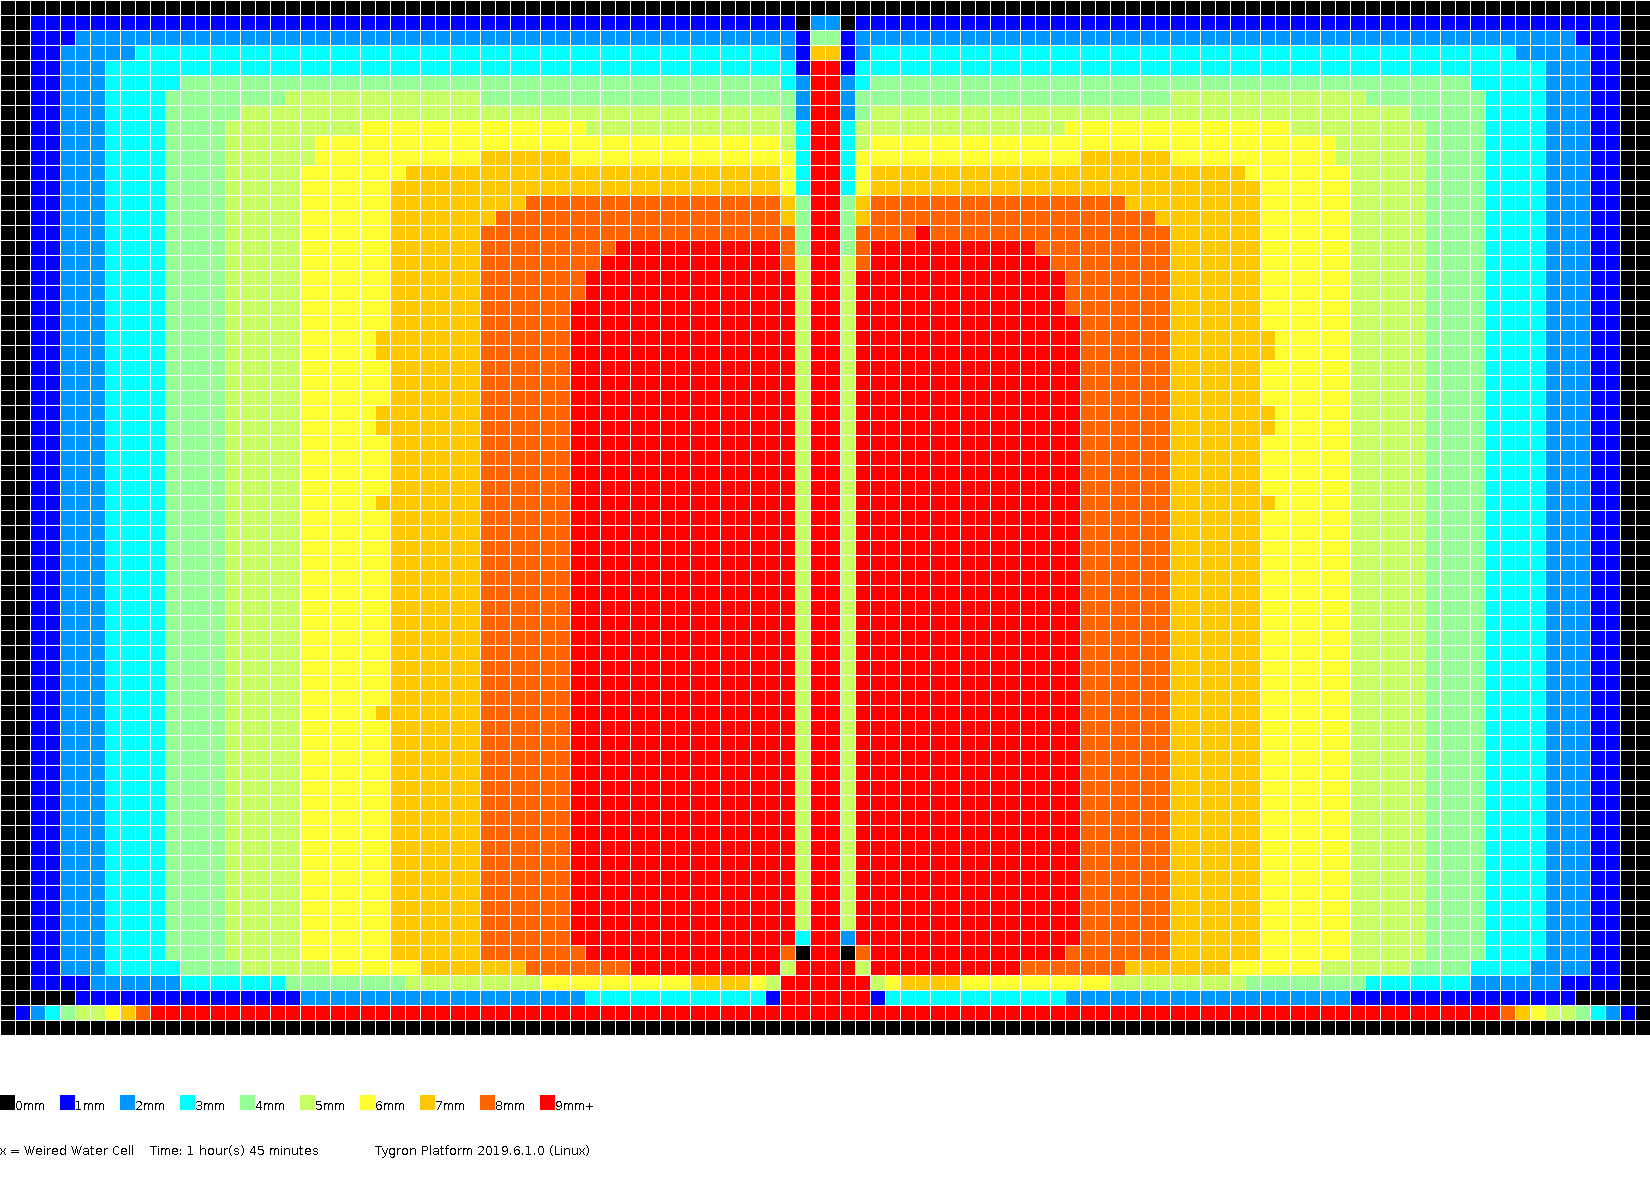
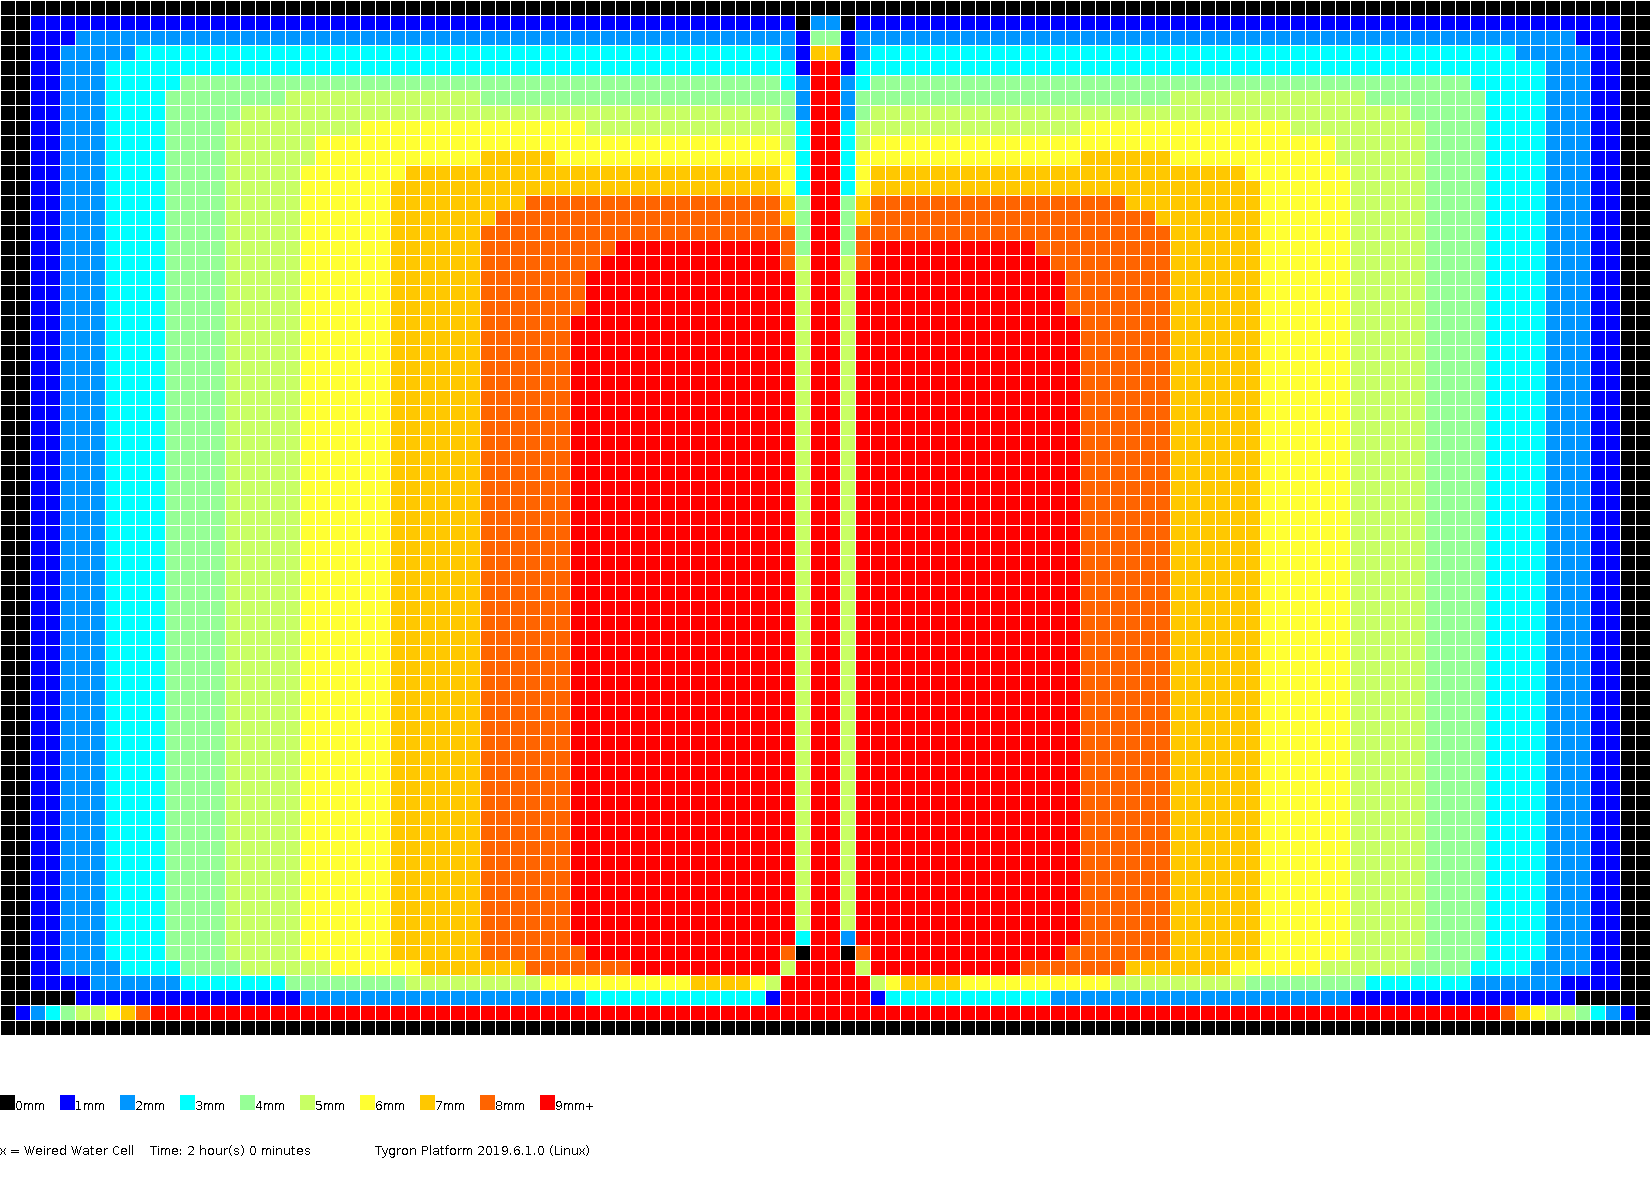
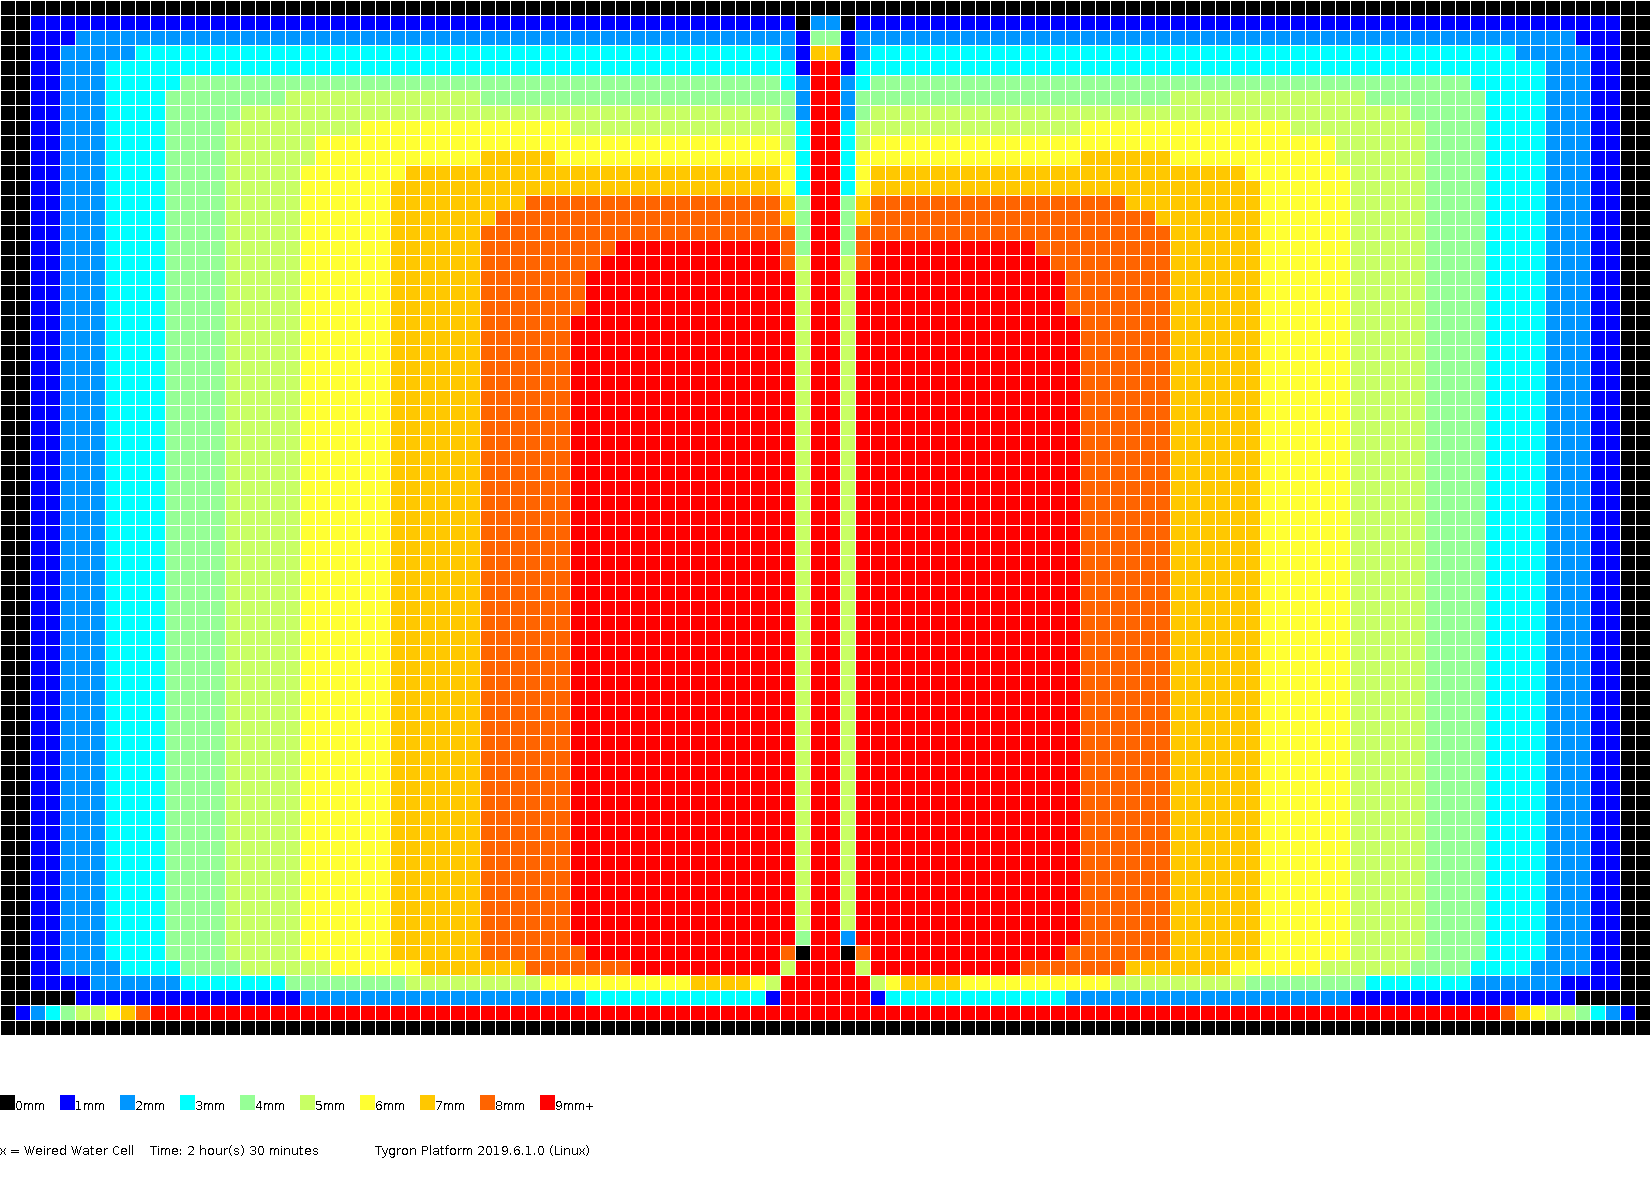
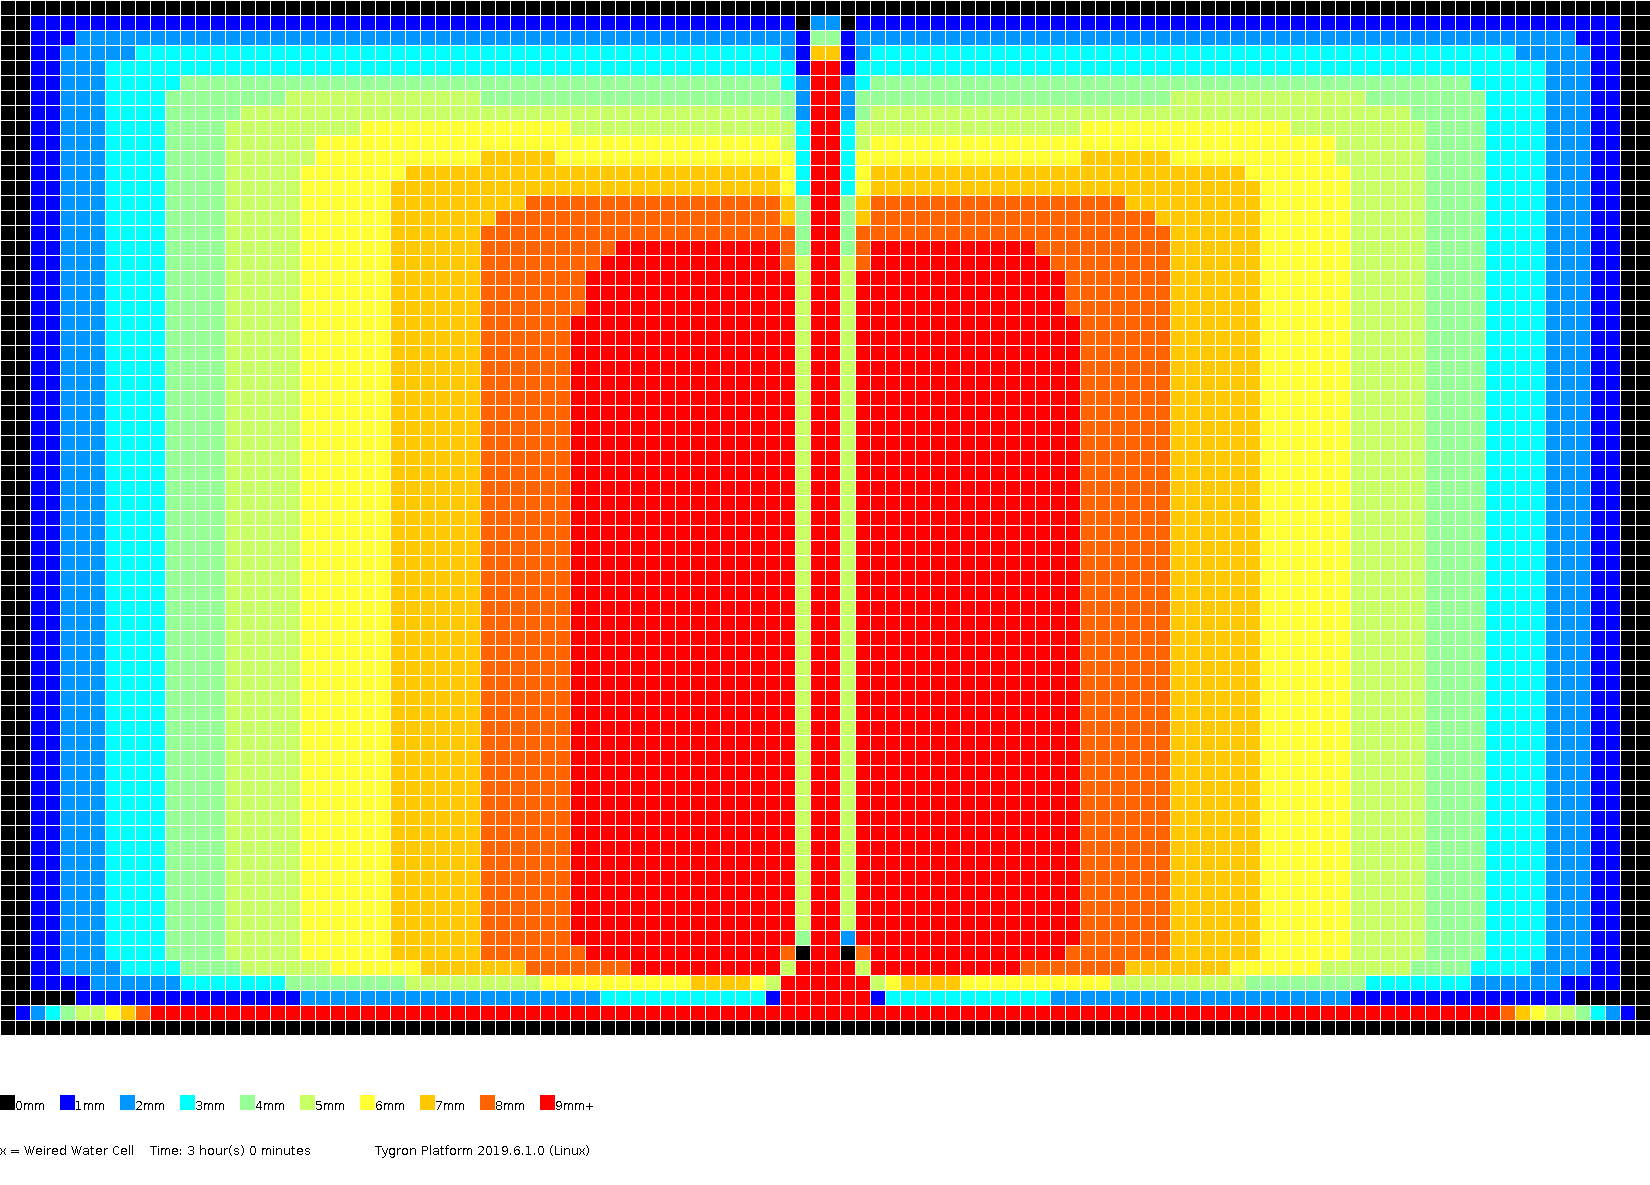
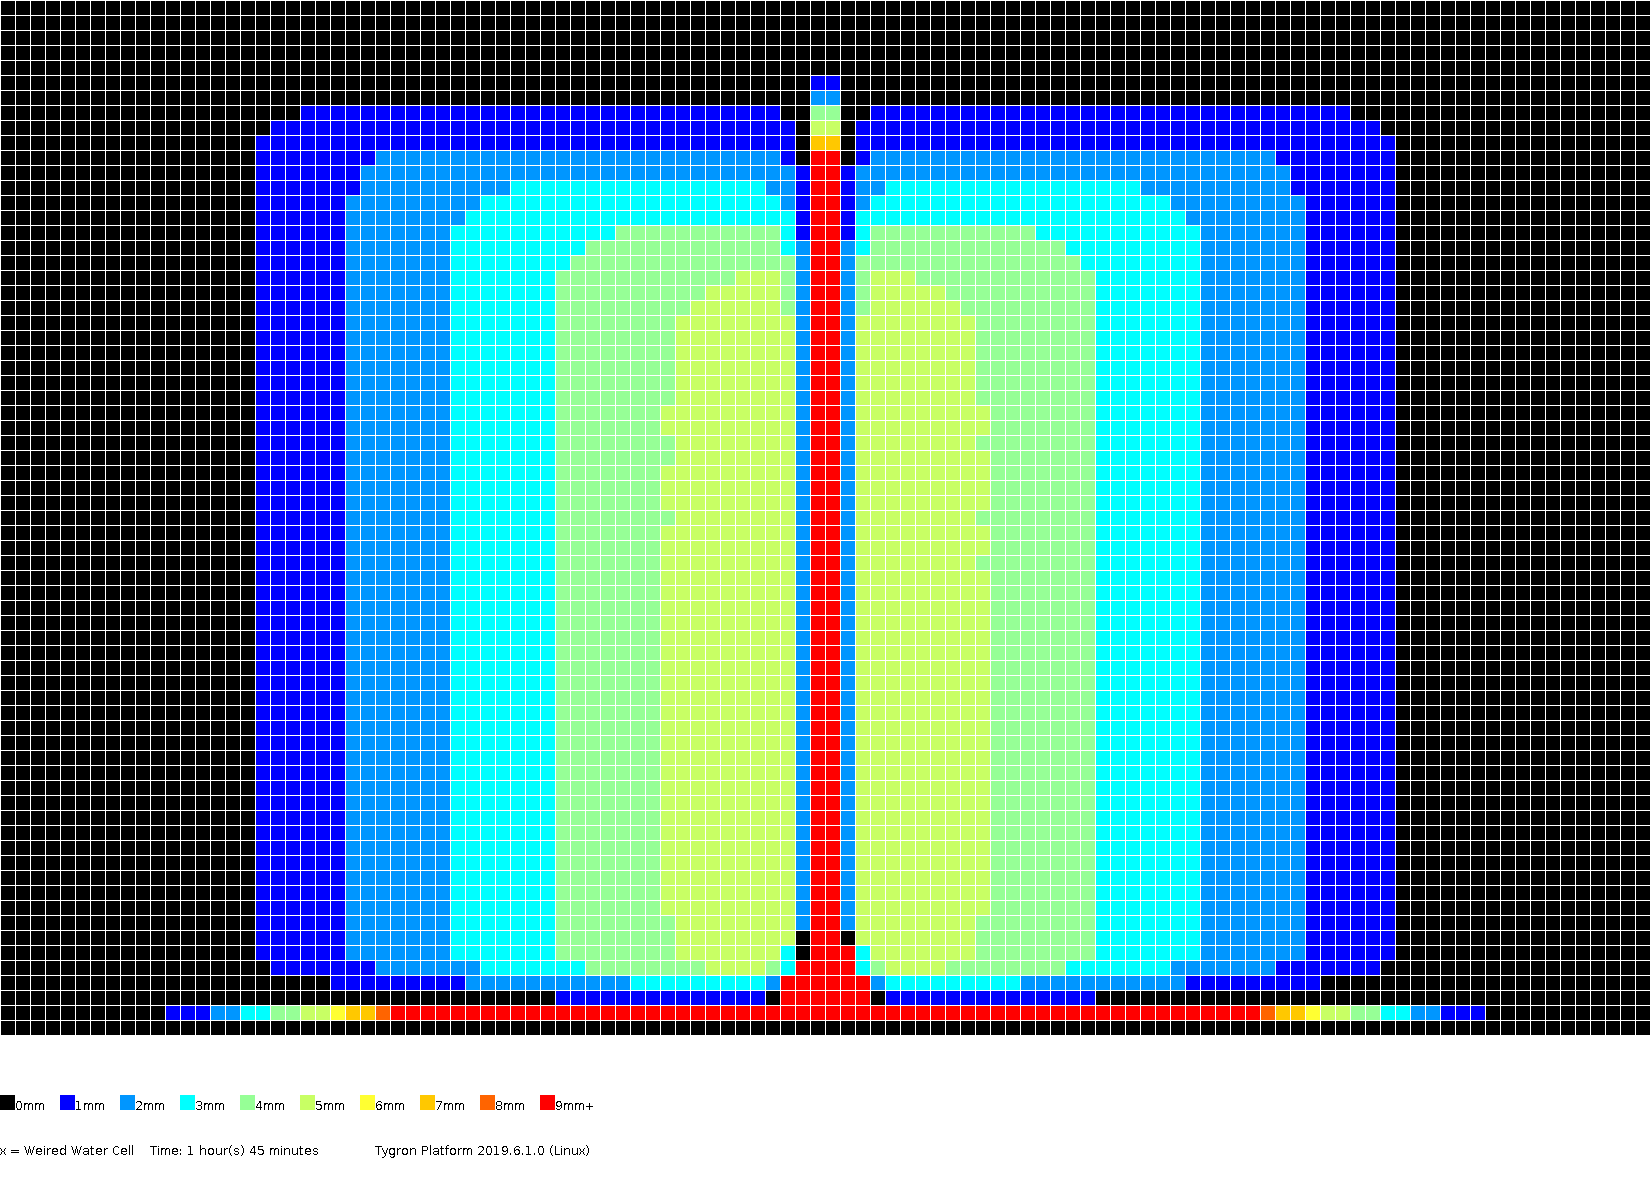
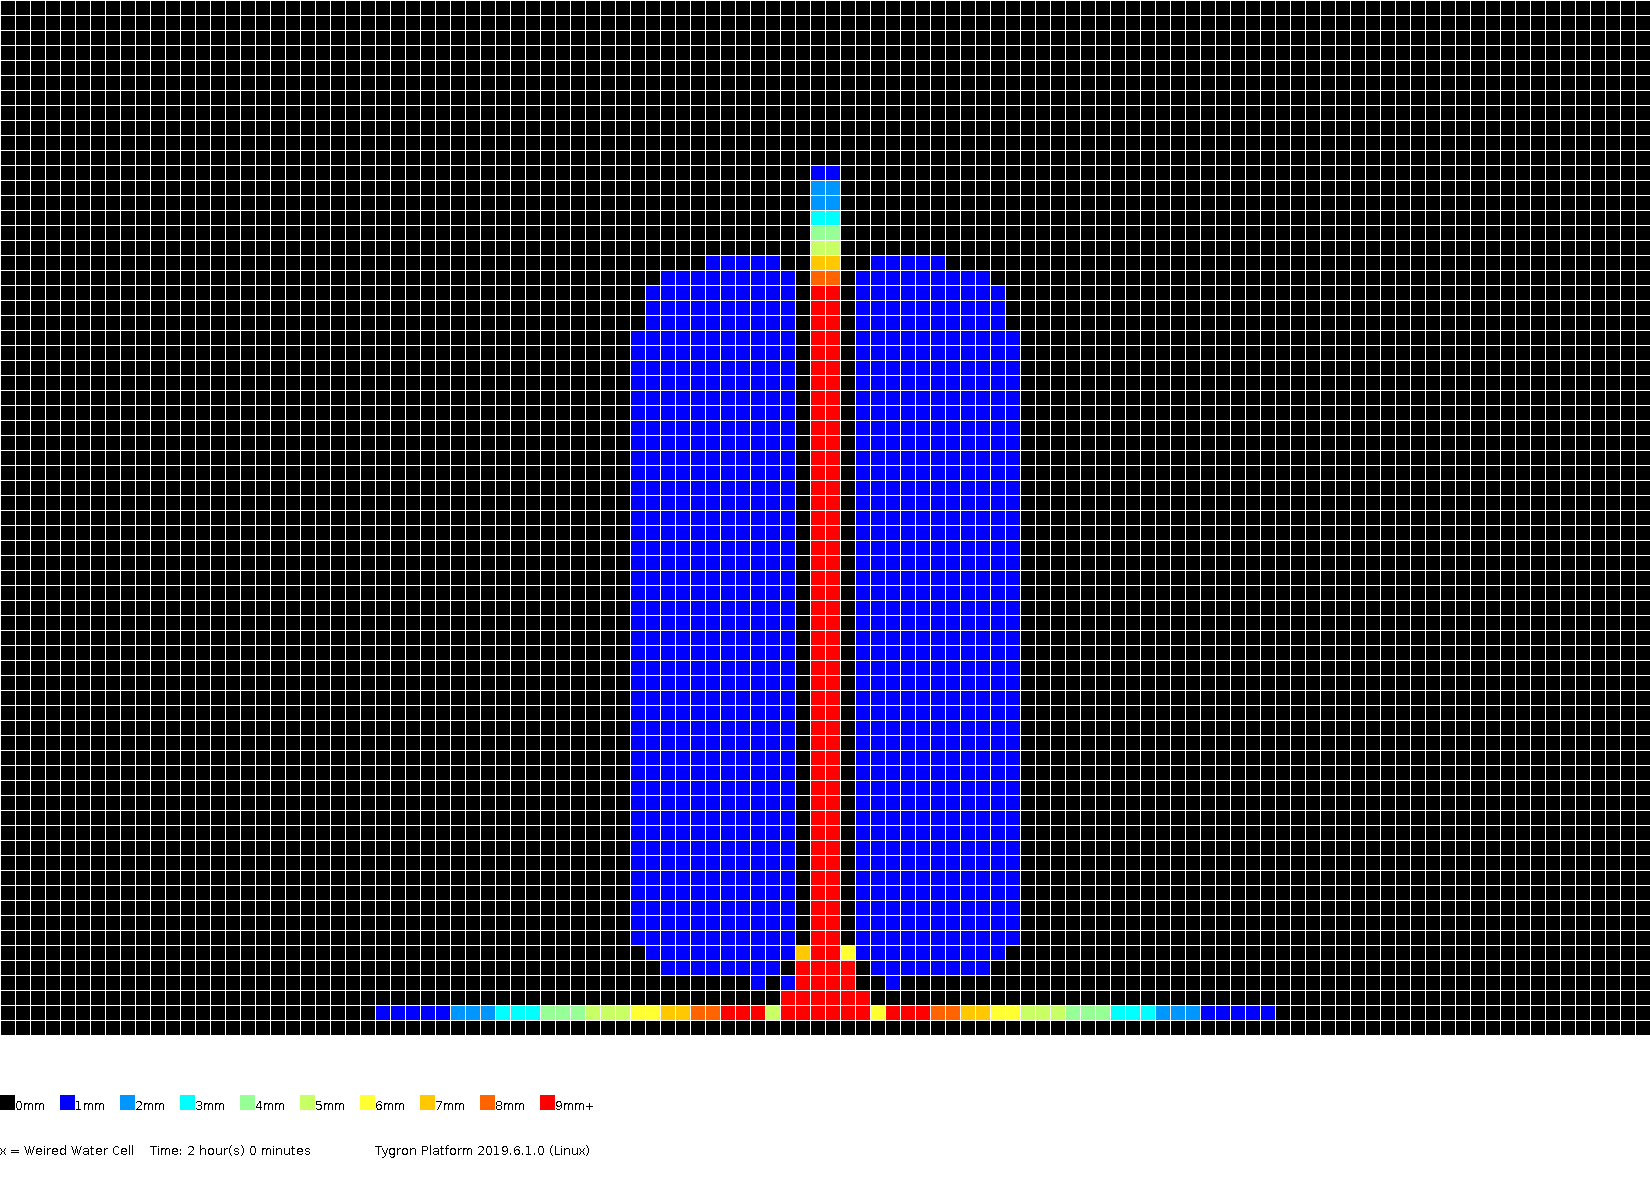
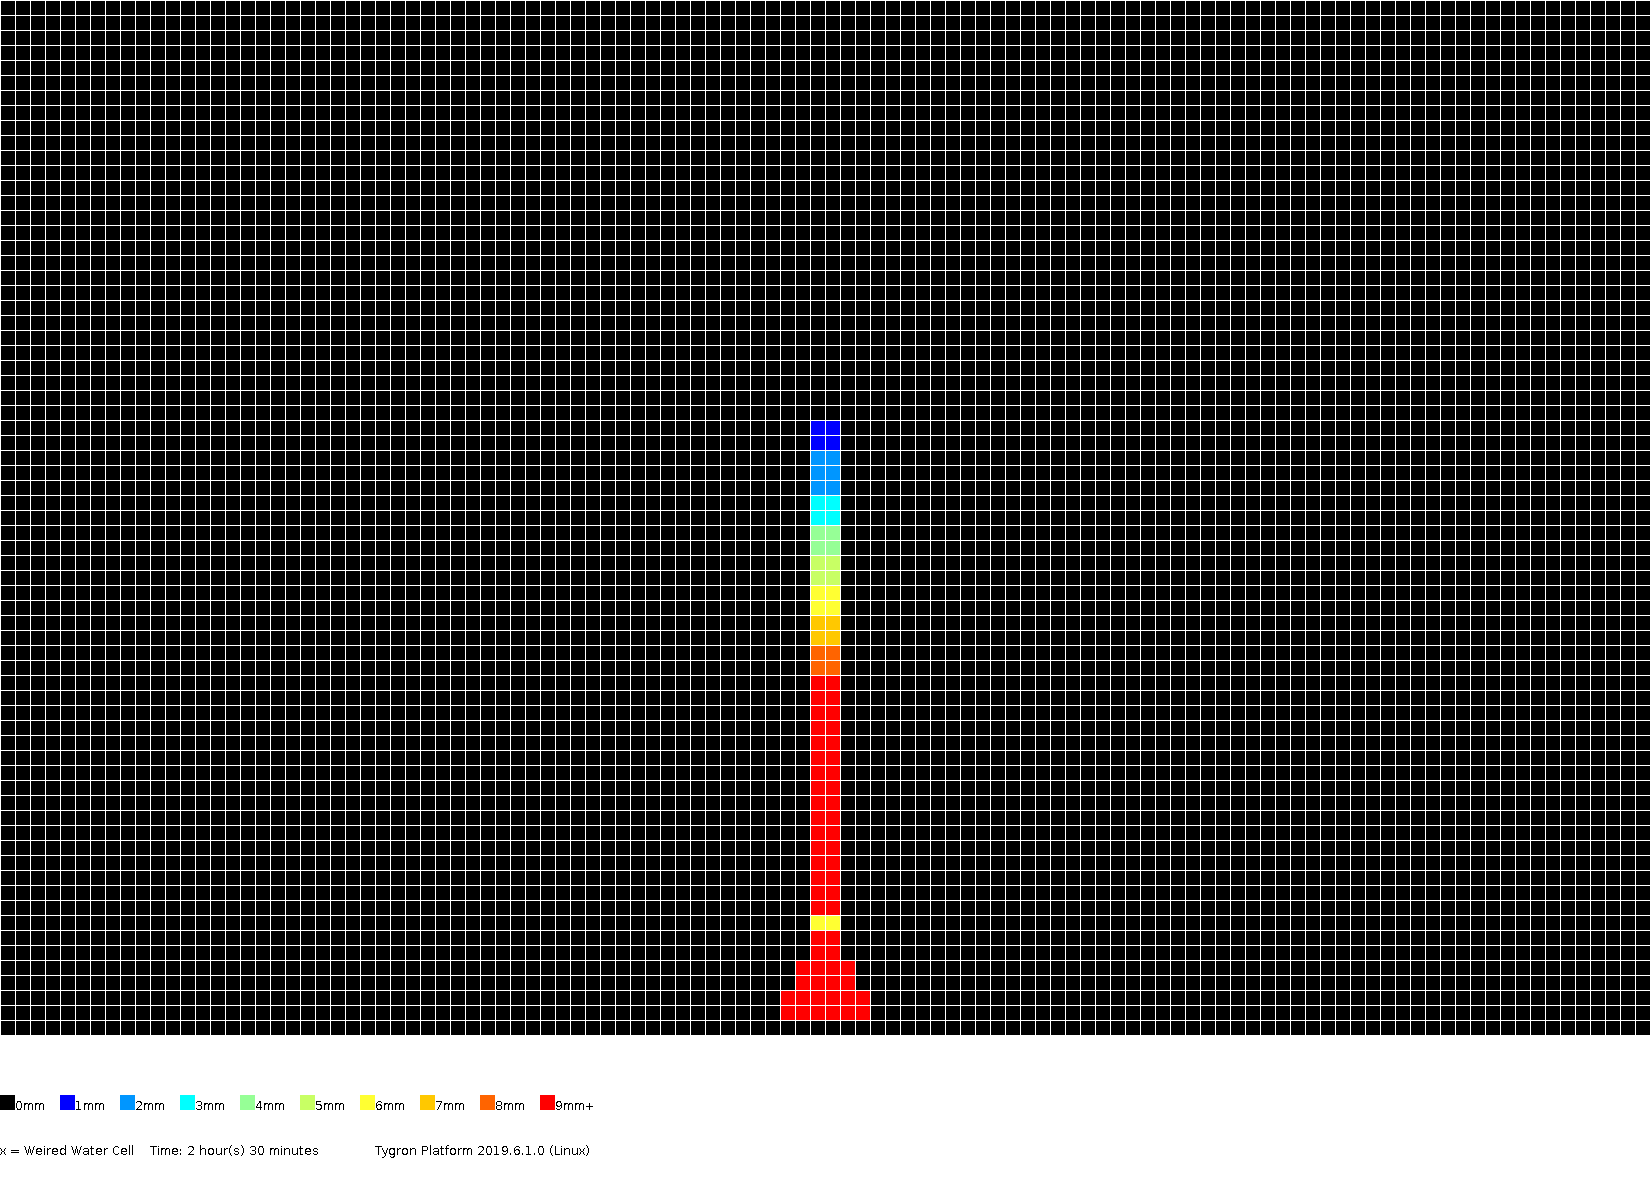
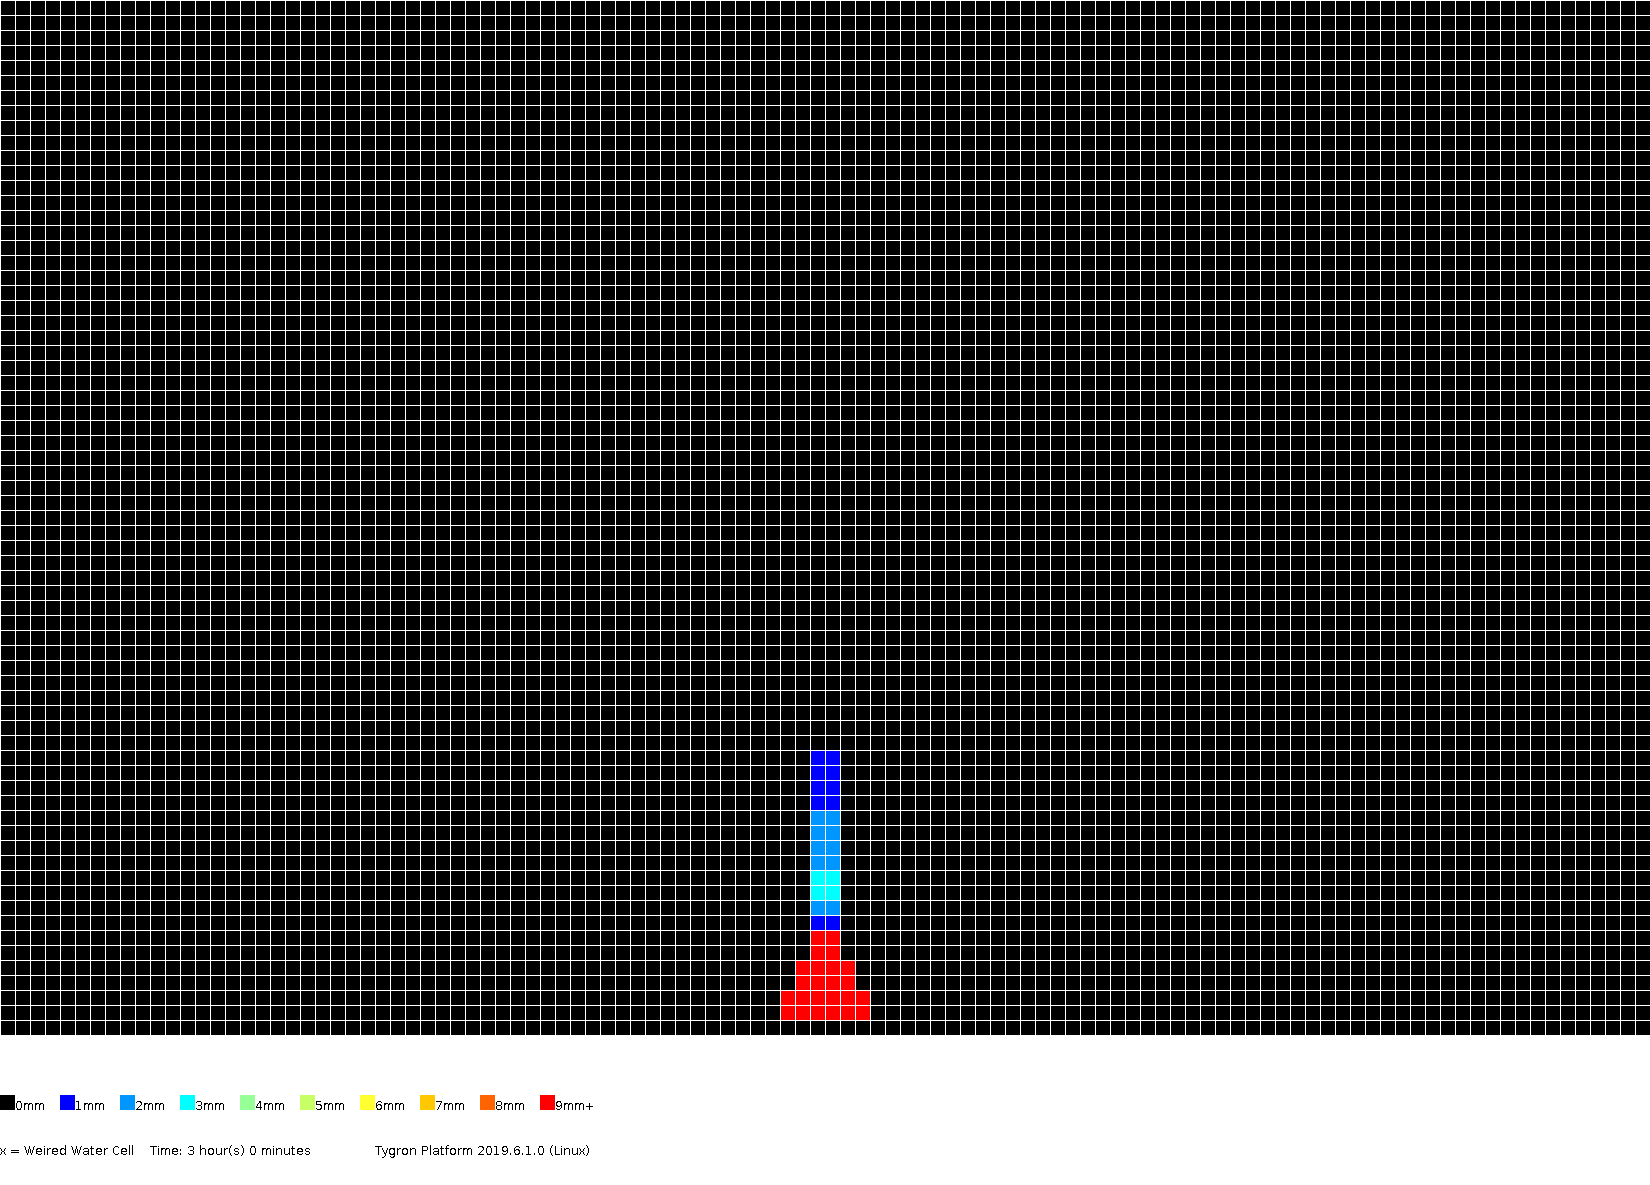
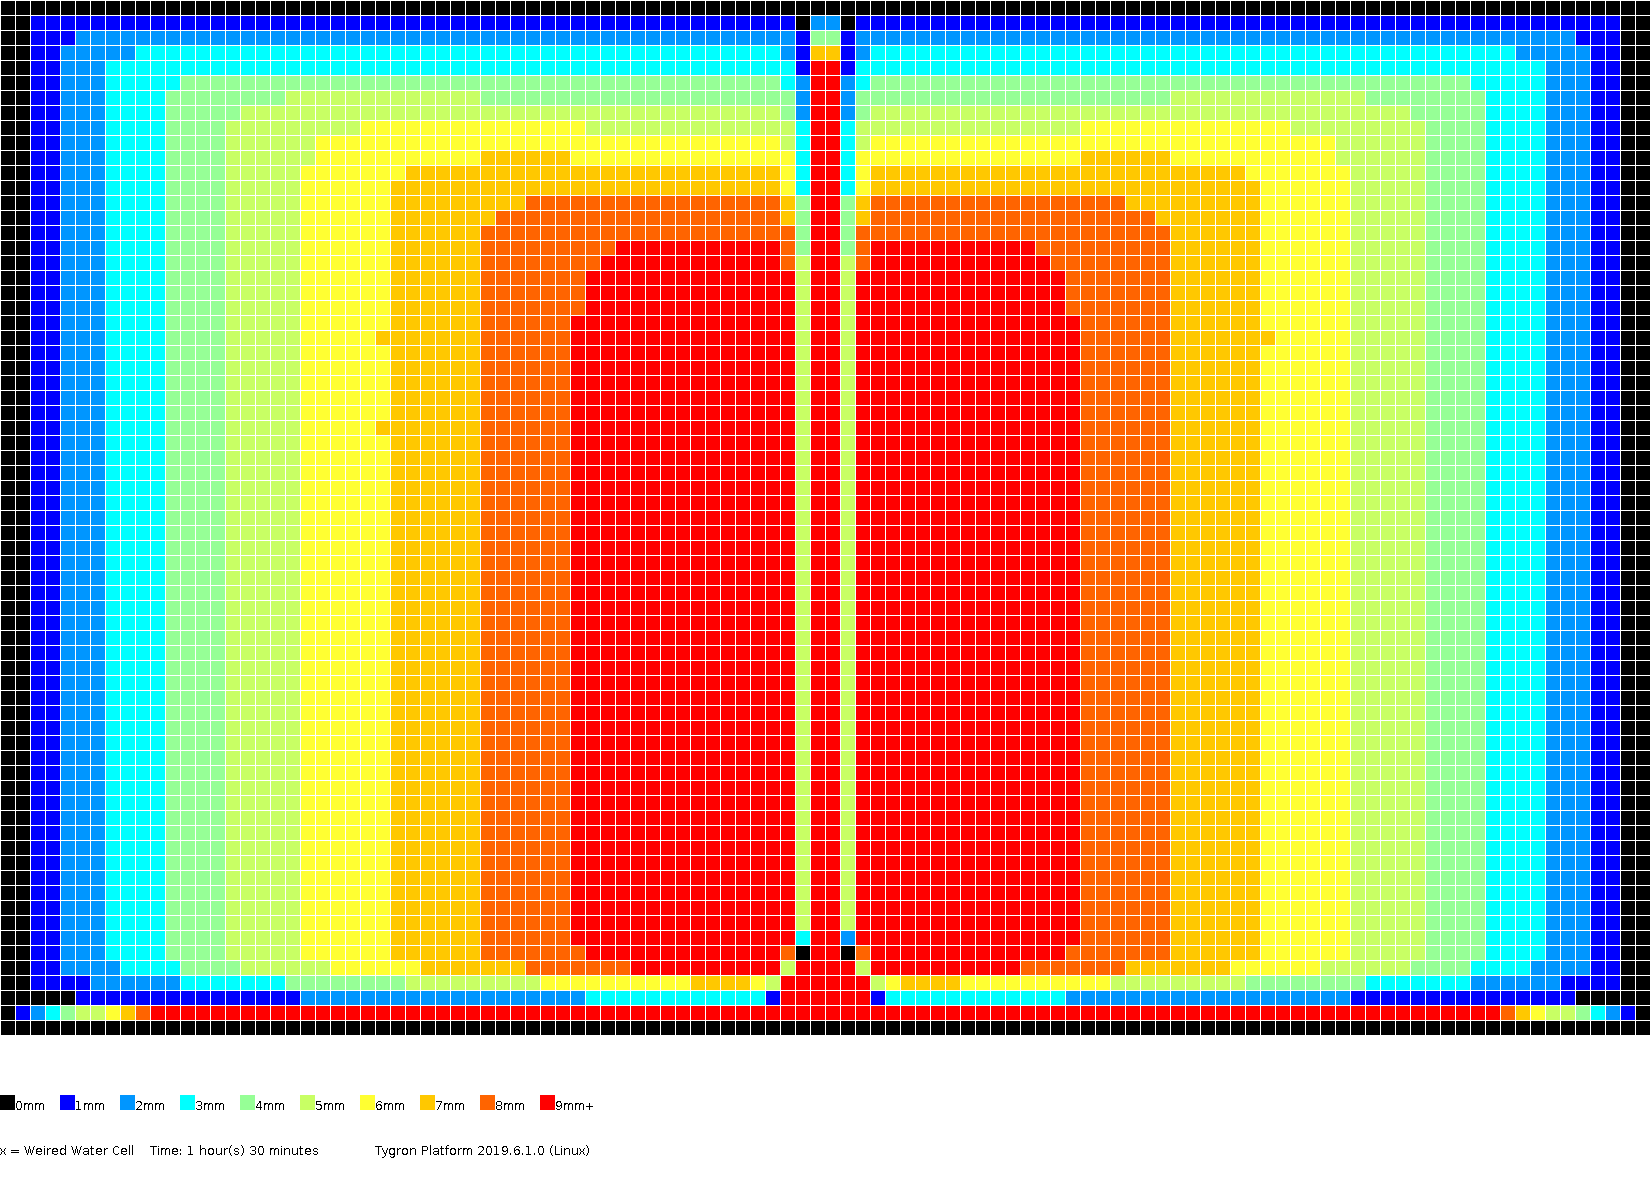
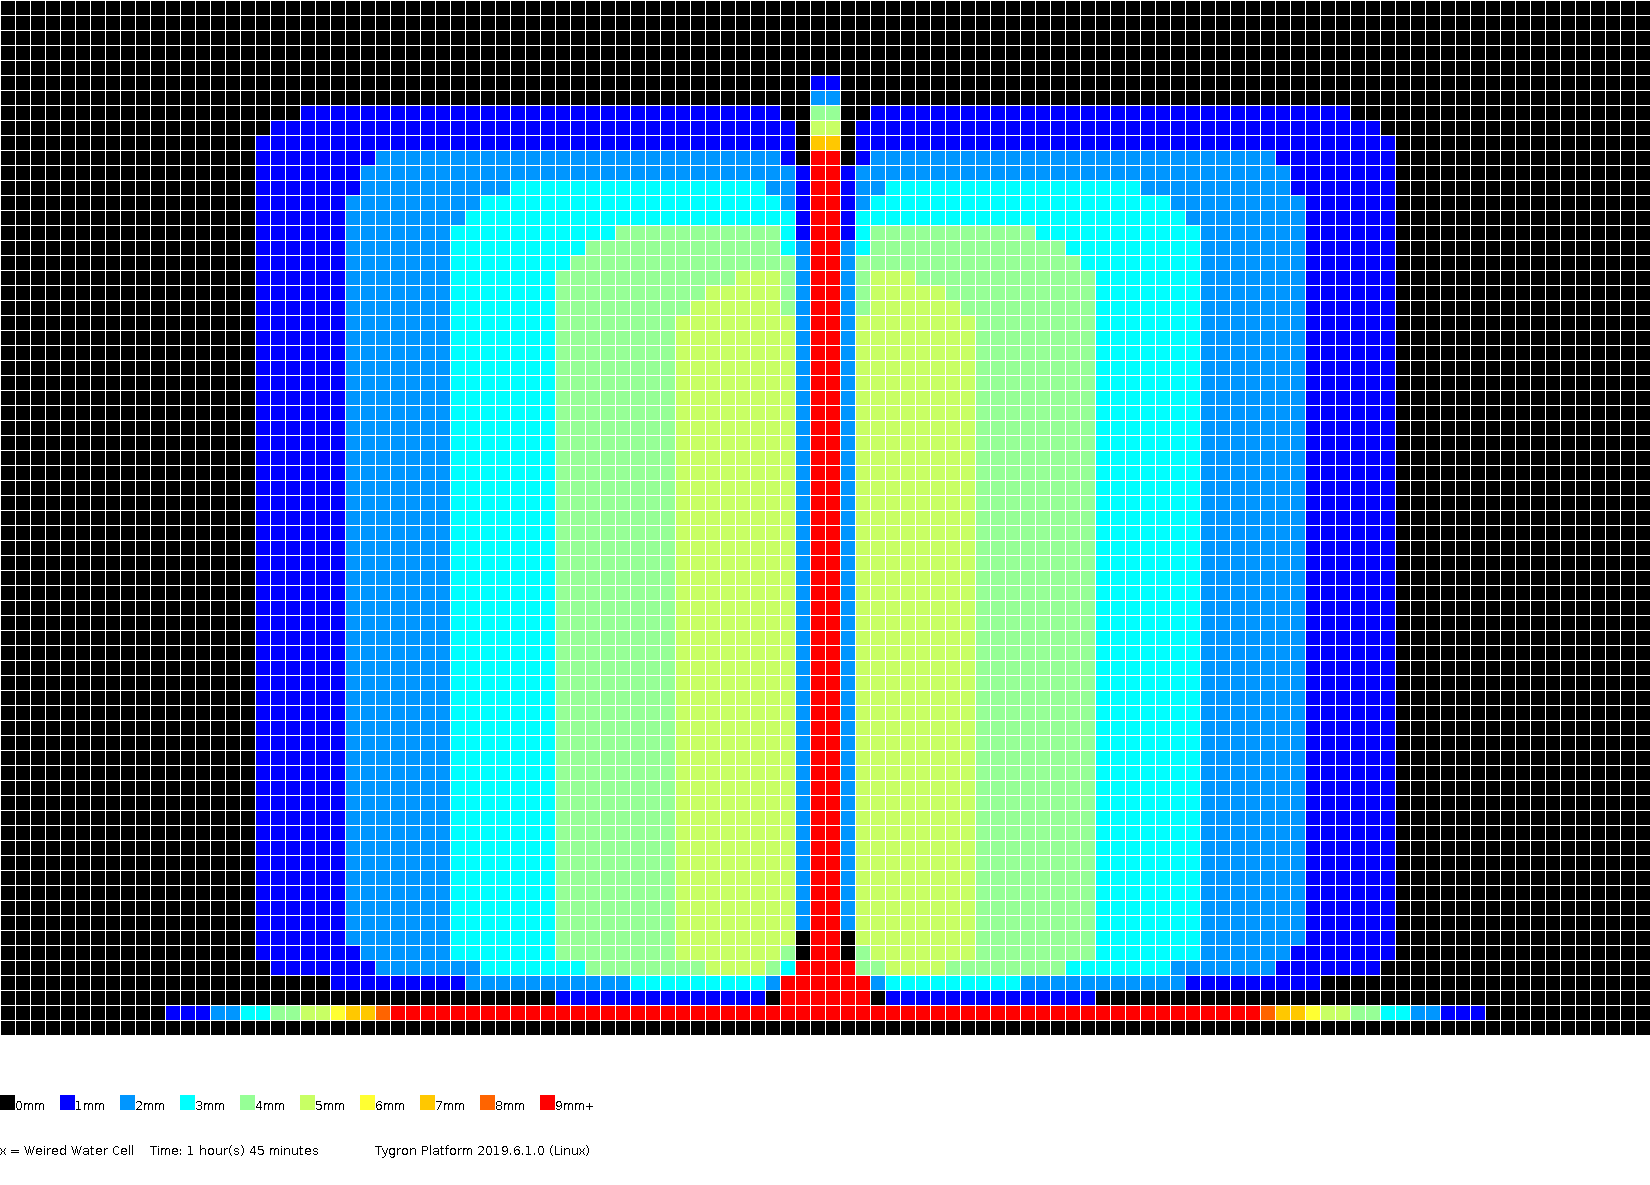
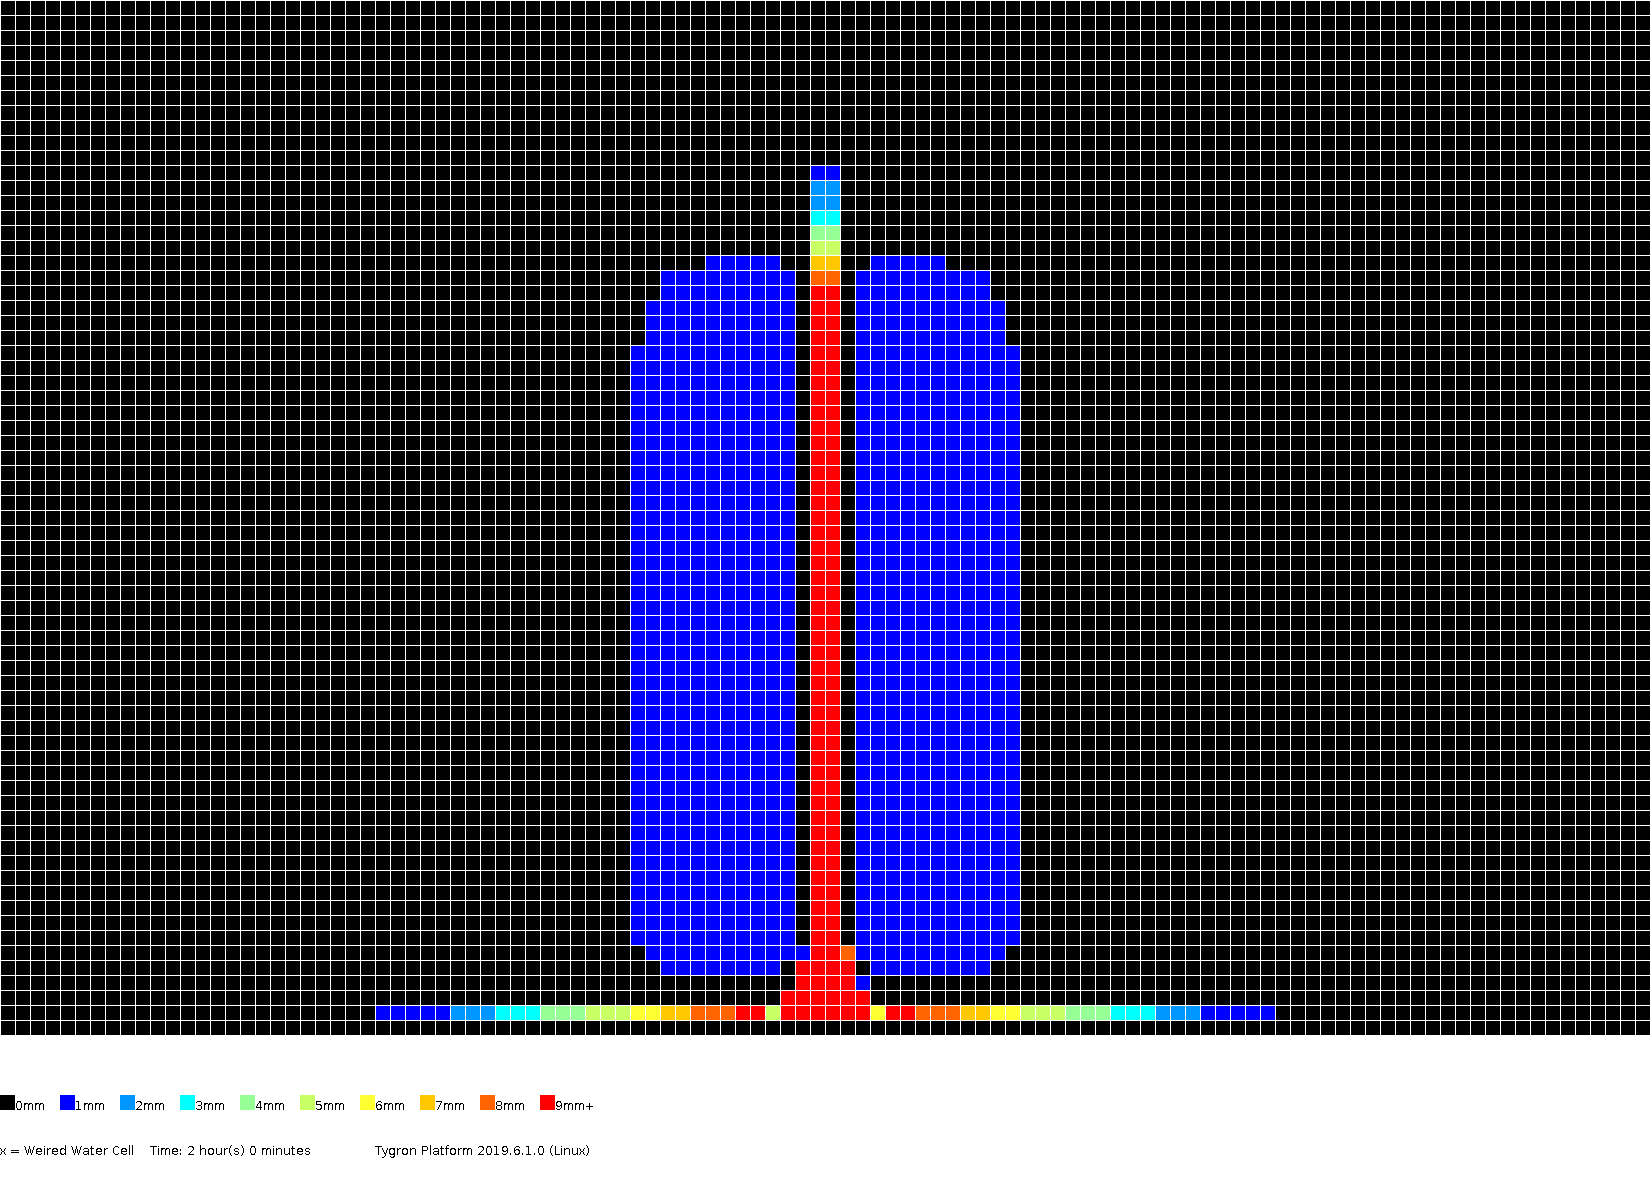
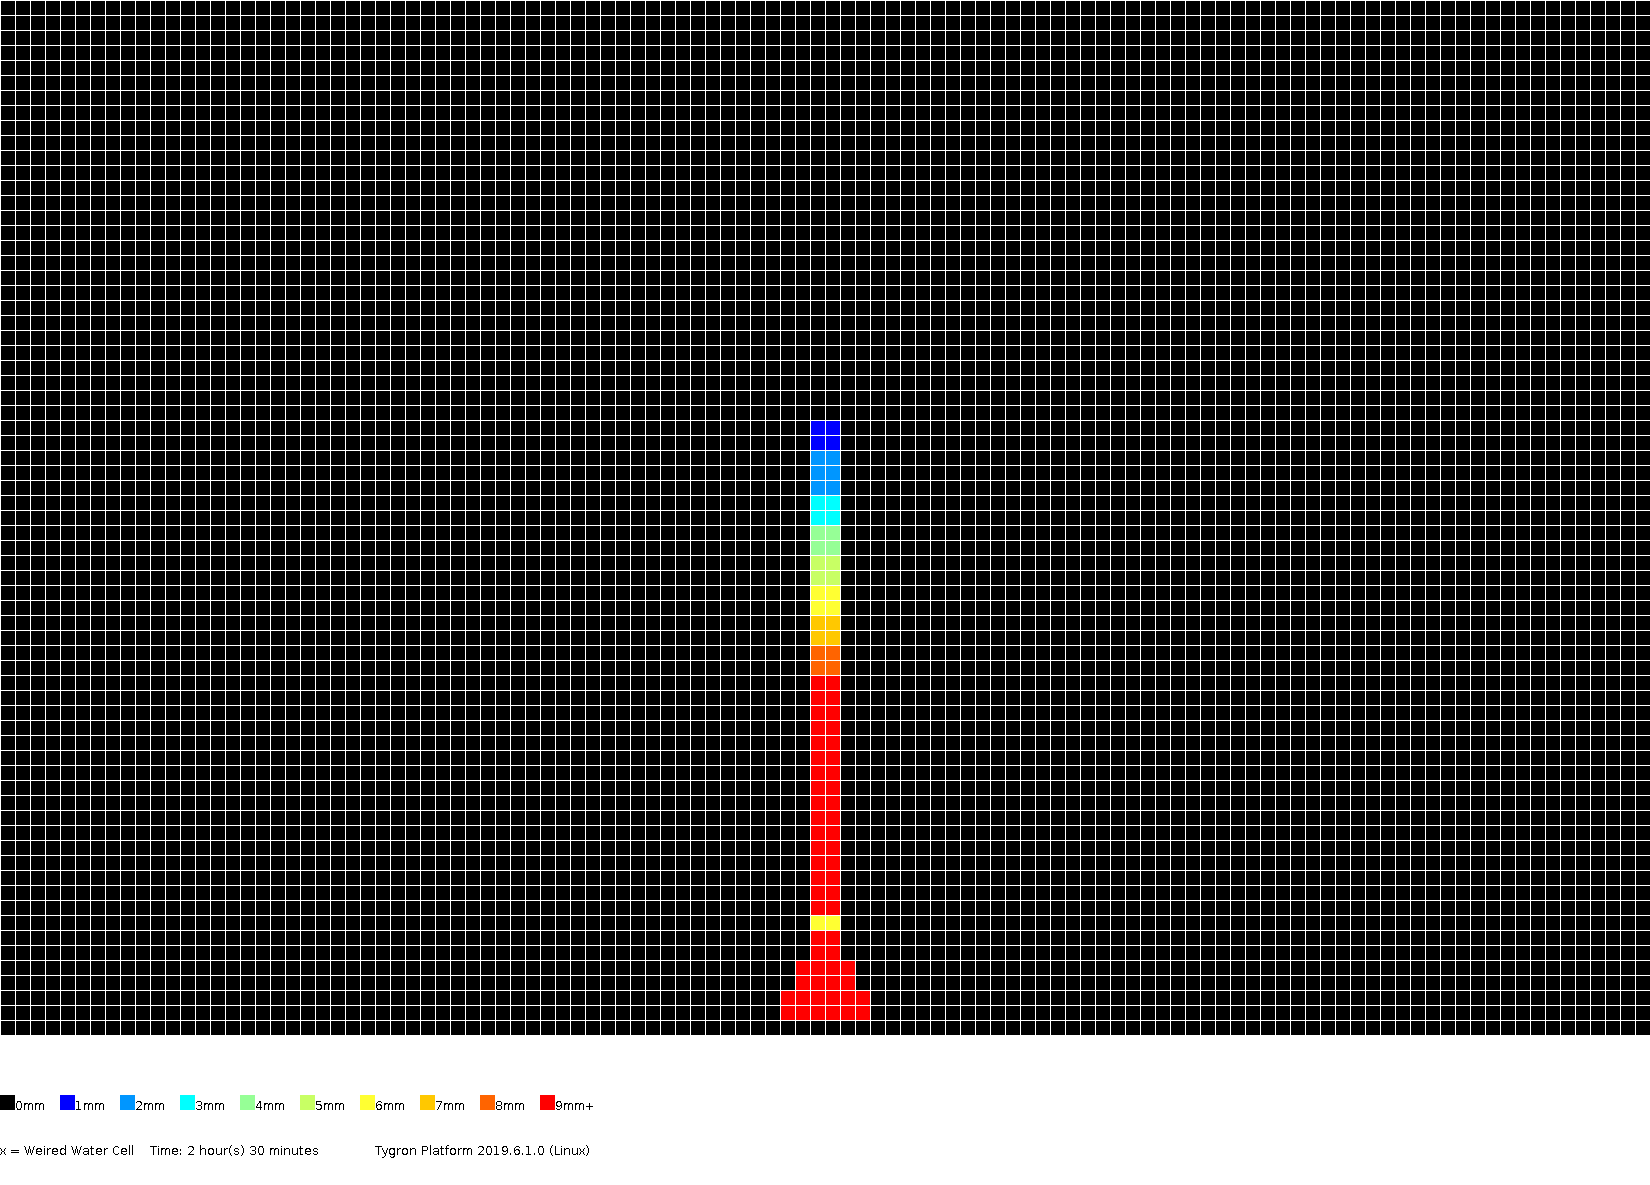
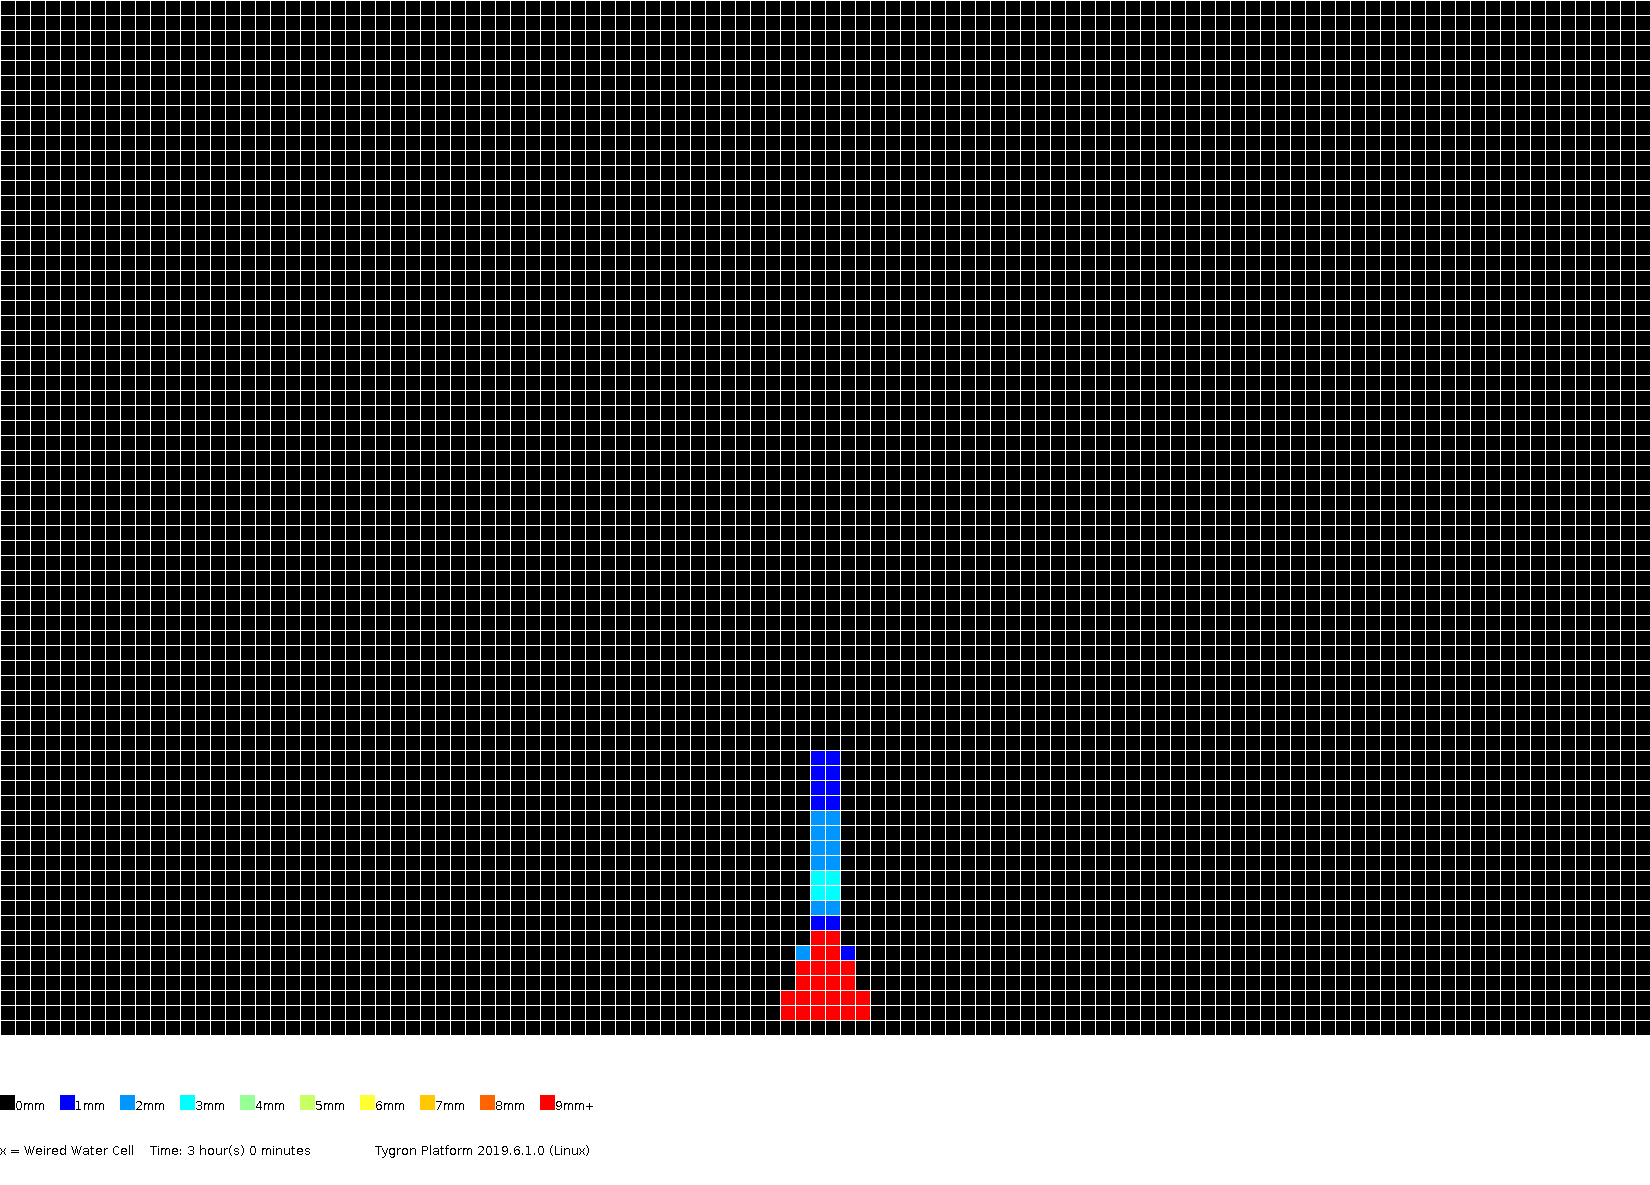
The amount of surface water (in meters), color coded per grid cell, presented for several timeframes.
-
0h30m
-
1h00m
-
1h30m
-
1h45m
-
2h00m
-
2h30m
-
3h00m
Test case 4B
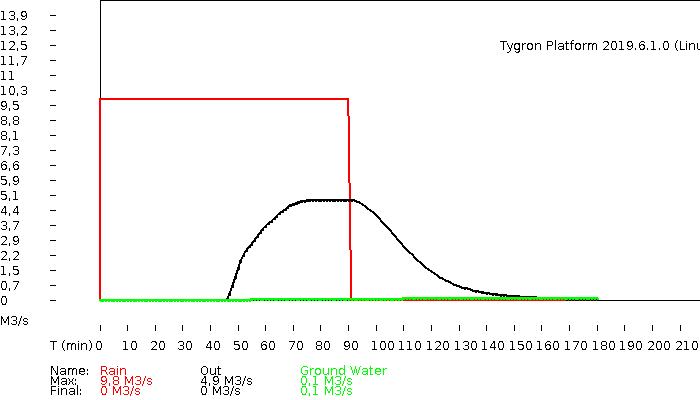
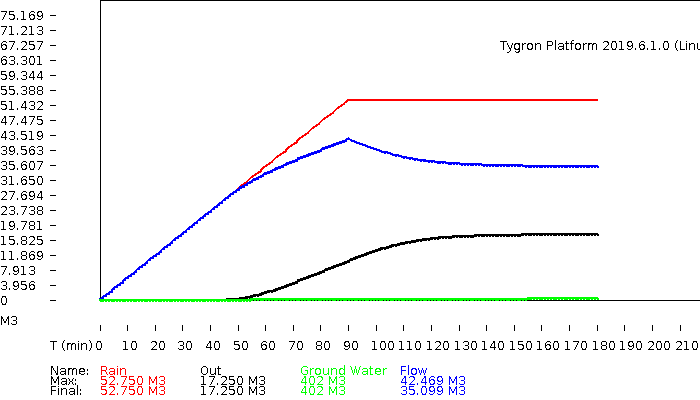
In this testcase the amount of rainfall is 21.6 mm per hour and lasts for 90 minutes. The underground has an infiltration capacity of 10.8 mm per hour. The simulation runs until the water level has lowered to about +/- 2cm below the crest of the weir. The effects of the groundwater table can be ignored.
Results
The hydrograph and volume.
-
hydrograph
-
volumes
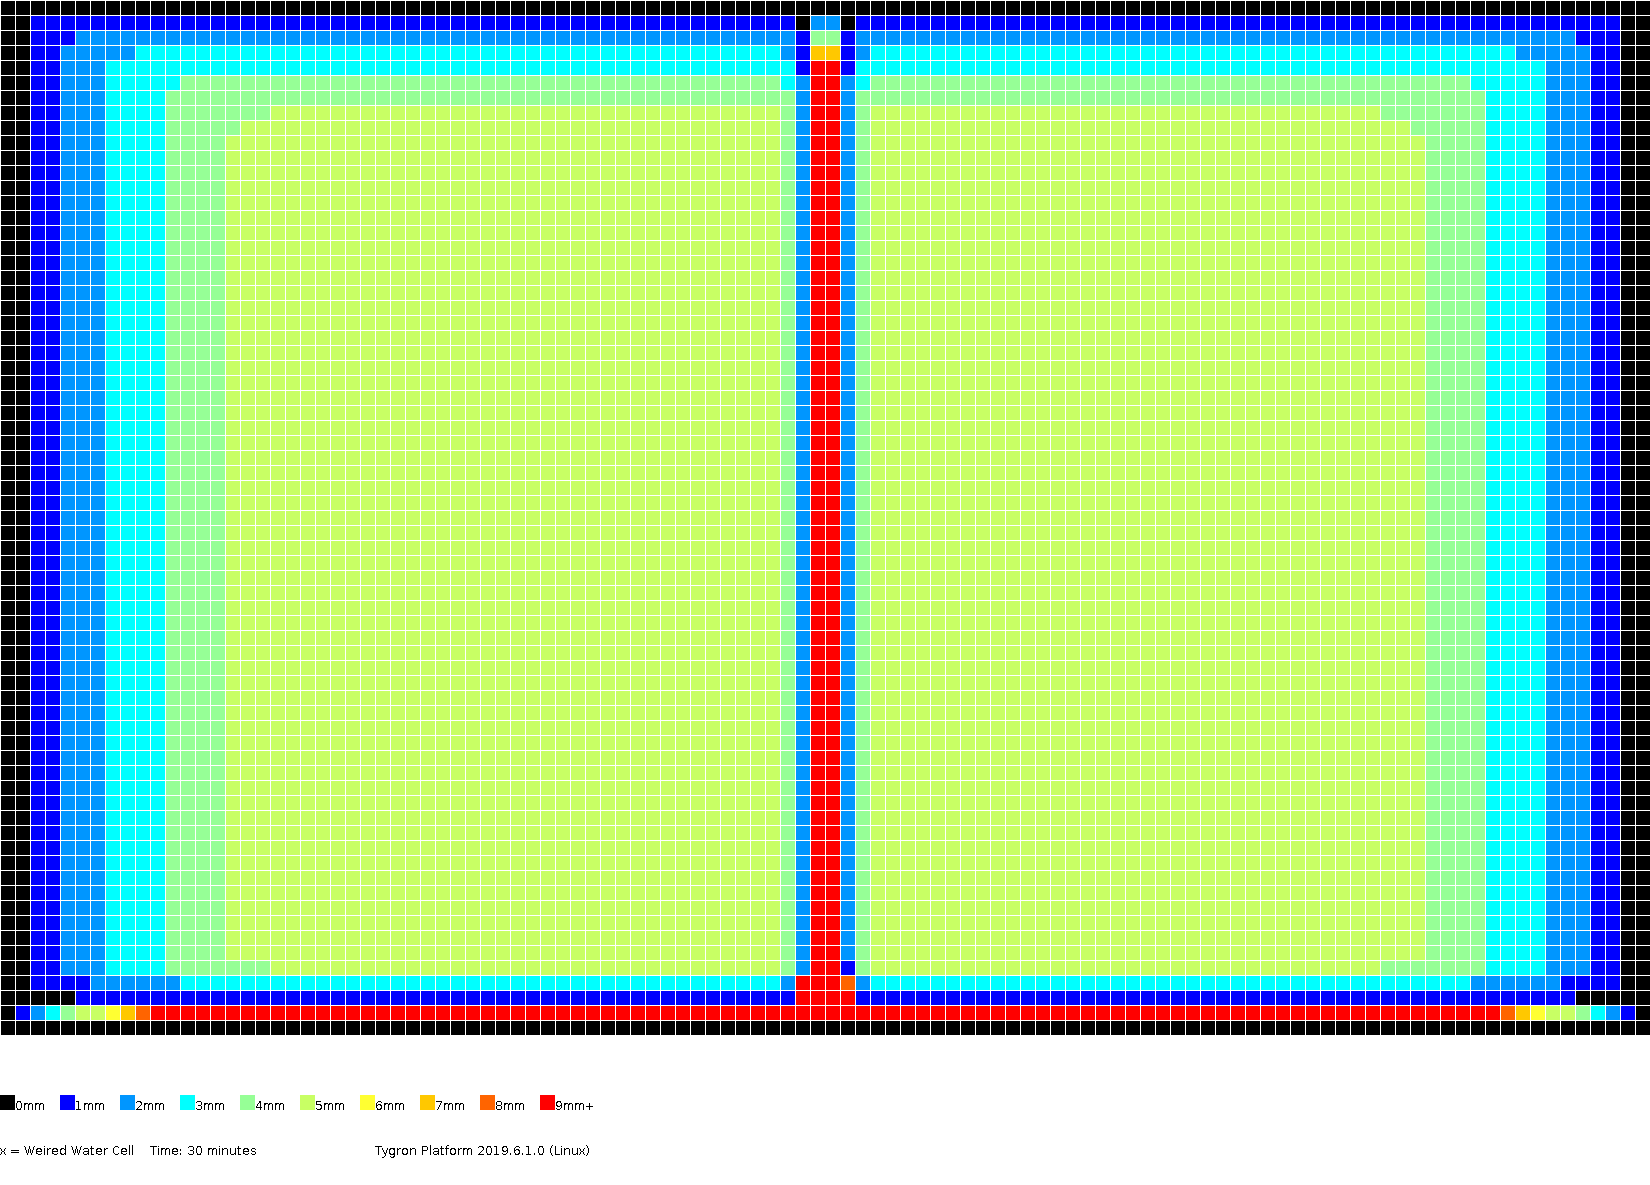
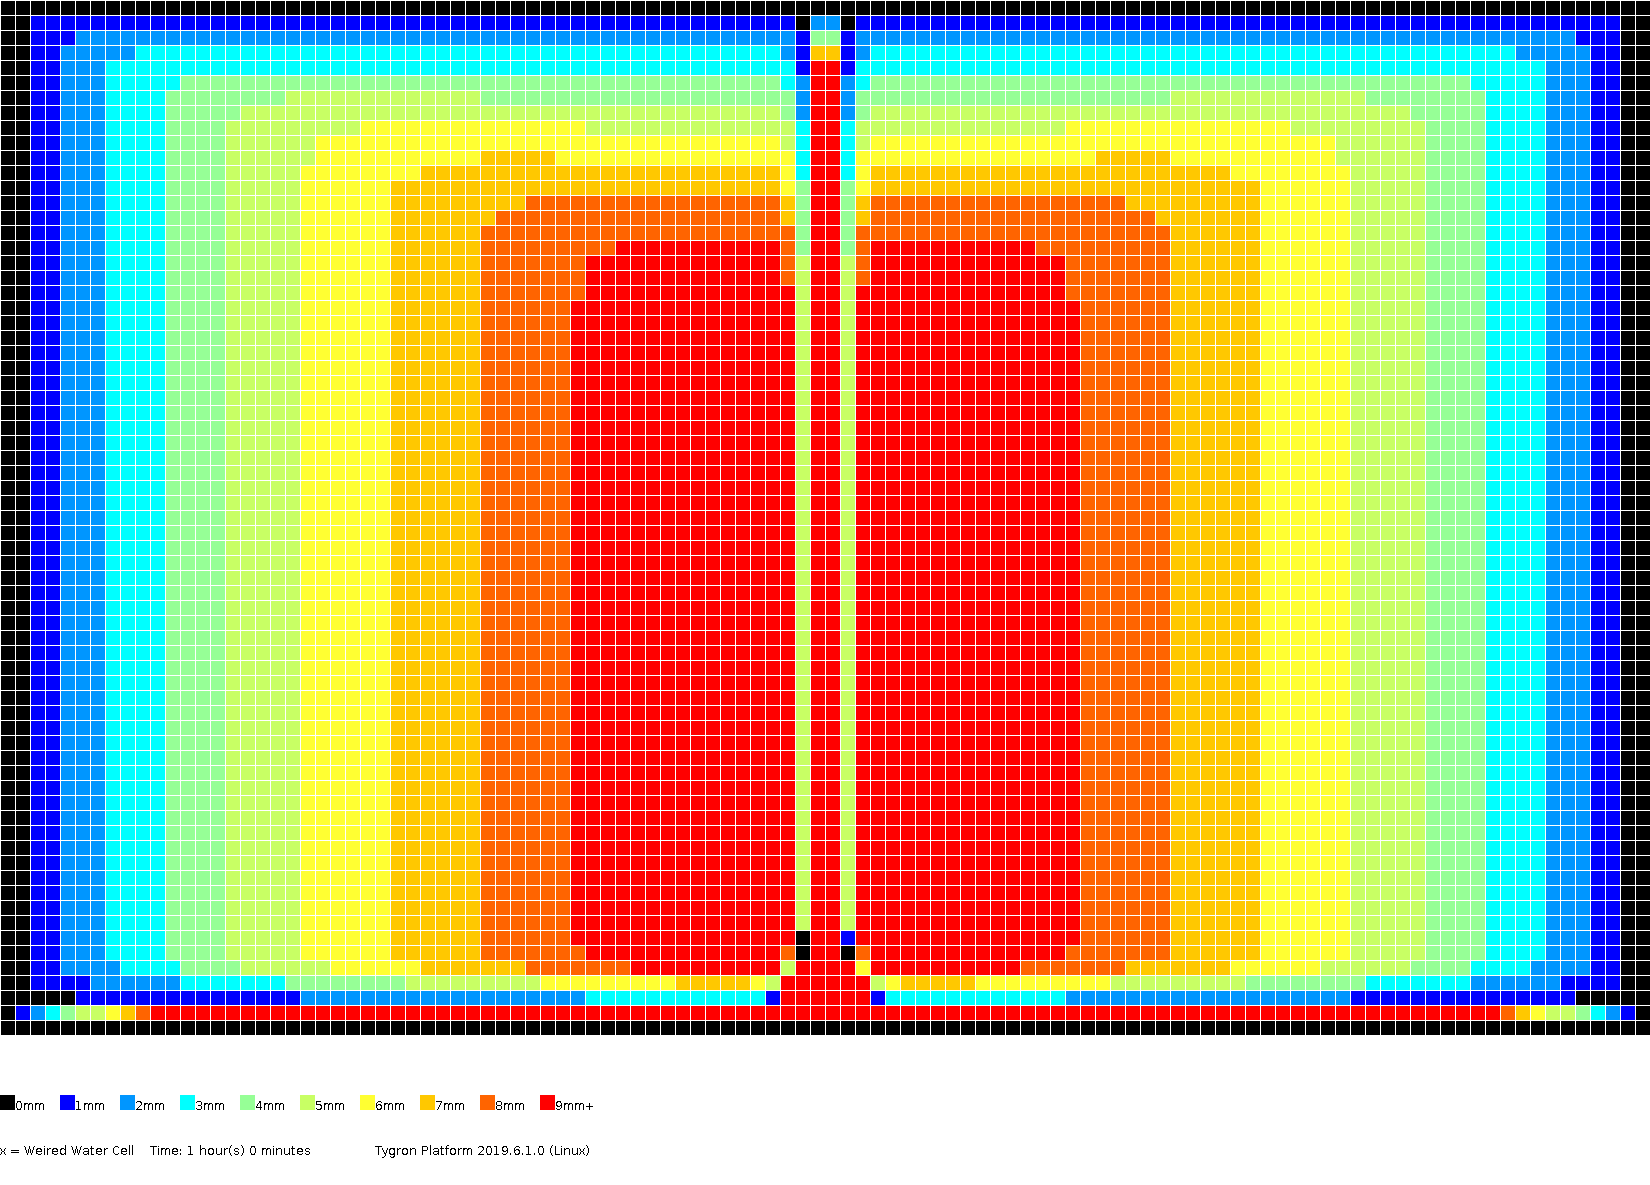
The amount of surface water (in meters), color coded per grid cell, presented for several timeframes.
-
0h30m
-
1h00m
-
1h30m
-
1h45m
-
2h00m
-
2h30m
-
3h00m
Test case 4C
In this testcase, the amount of rainfall and the infiltration capacity are equal to testcase 4B. The porosity of the soil is now set to 0.25. The impenetrable layer is strictly horizontal and 10 meters below the lowest surface height. The groundwatertable at t=0 is horizontal, 50 cm below the height of the weir. The initial surface water level is equal to the initial groundwatertable. The hydraulic condictivity is 5x10⁻⁵ for water infiltration from the surface to the underground. The simulation time is equal to testcase 4B.
Results
The hydrograph and volume.
-
hydrograph
-
volumes
The amount of surface water (in meters), color coded per grid cell, presented for several timeframes.
-
0h30m
-
1h00m
-
1h30m
-
1h45m
-
2h00m
-
2h30m
-
3h00m
Complete set of results
The complete set of produced results for the Stowa 2017 benchmark can be downloaded as a .zip-file here.
