Stowa 2017 benchmark (Water Module)
The Stowa 2017 benchmark was set up in order to find out which tool currently available to the Dutch Water management industry performs reliable in which circumstances. The goal of the benchmark was to provide insight to waterboards and municipalities which water simulation tool would suit their needs best. The benchmark consist of several topics:
- Rain water discharge for several types of terrain
- Underground water infiltration
- Flow direction and speed
- 2D-1D interaction between surface water and water objects such as weirs and culverts.
For the complete benchmark, see Stowa benchmark 2017. Please note that the referenced document contains results made in 2017, with a model that was not yet using the 2D Saint Venant equations.
The Water Module has been much improved since 2017 and is now based on the finite volume method described by Kurganov et al.
The results presented below have been generated on 04-09-2019.
Test case 1
This test case will validate whether a shallow water calculation tool can calculate sheet flow accurately. An analytic solution of this case is provided by (Di Giammarco, 1996).
The reference grid resolution is 20 by 20 meters. The Manning roughness is 0.015. The surface is expected to be impenetrable, meaning that there is no rain water infiltrating into the underground. Water that reaches the lowest border of this test case is expected to flow out of the system.


Setup
A sloped terrain of 800 by 1000 meters, on which a rain fall is applied of 10.8 mm per hour for a duration of 90 minutes. The total simulation time is 3 hours.
A graphical impression of the height map in this testcase is given below. Again first the original height map and next the height map adjusted for ensuring a constant slope per grid cell x- and y-direction.
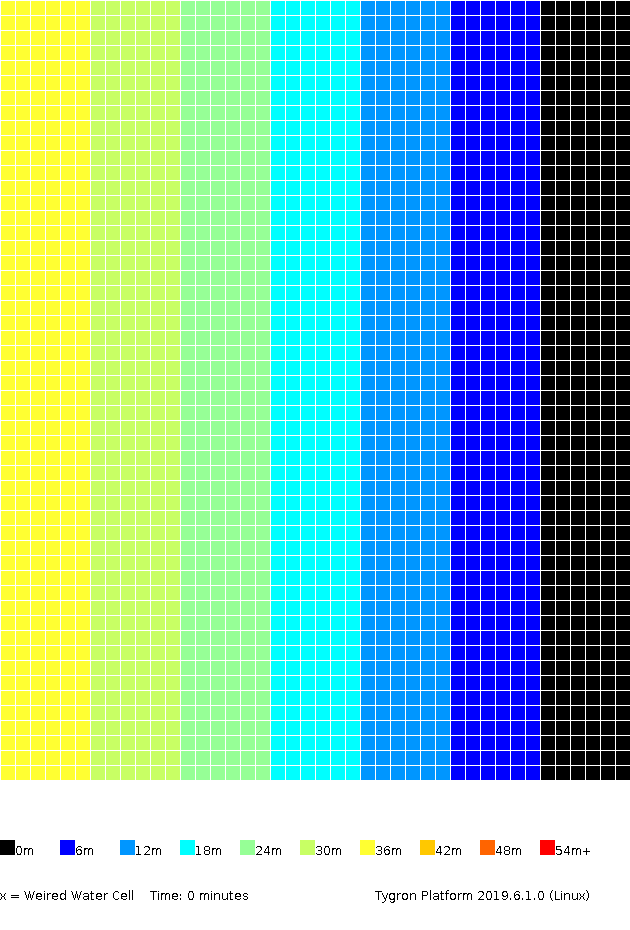
Initial 
After slope adjustments


Results
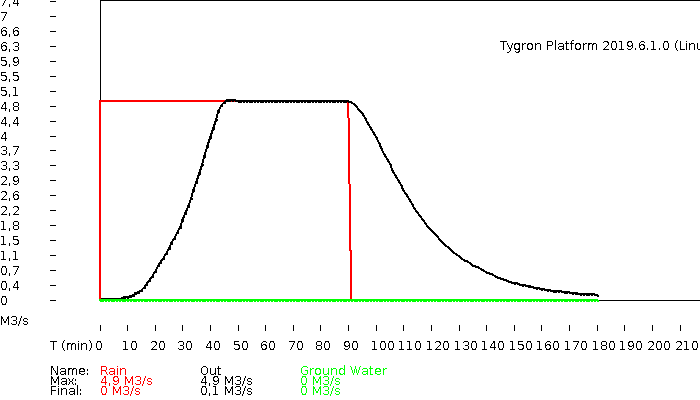
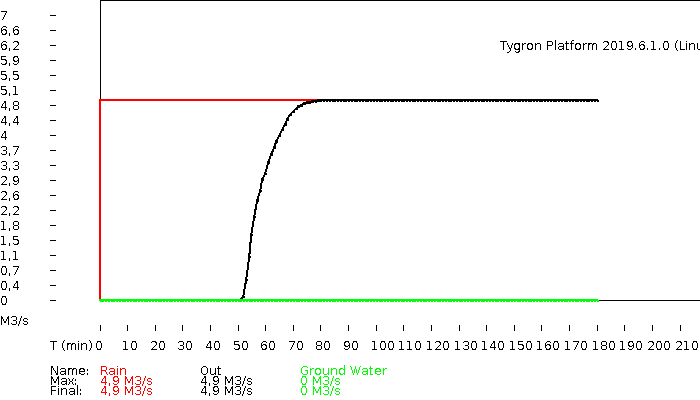
The hydrograph and volumes.
-
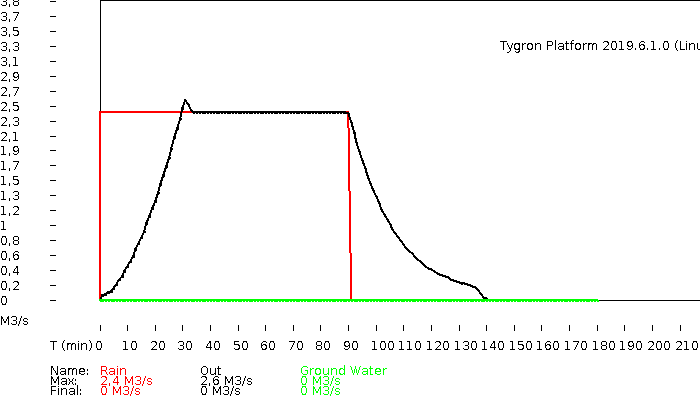 hydrograph
 -
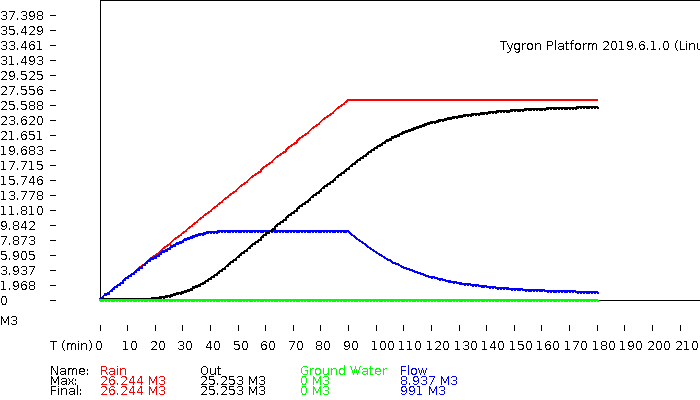
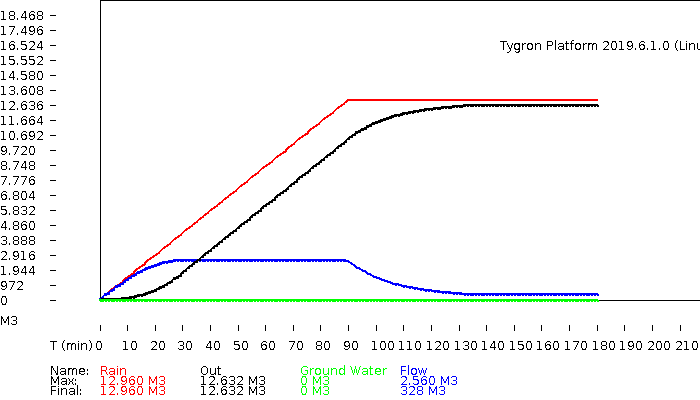 volumes


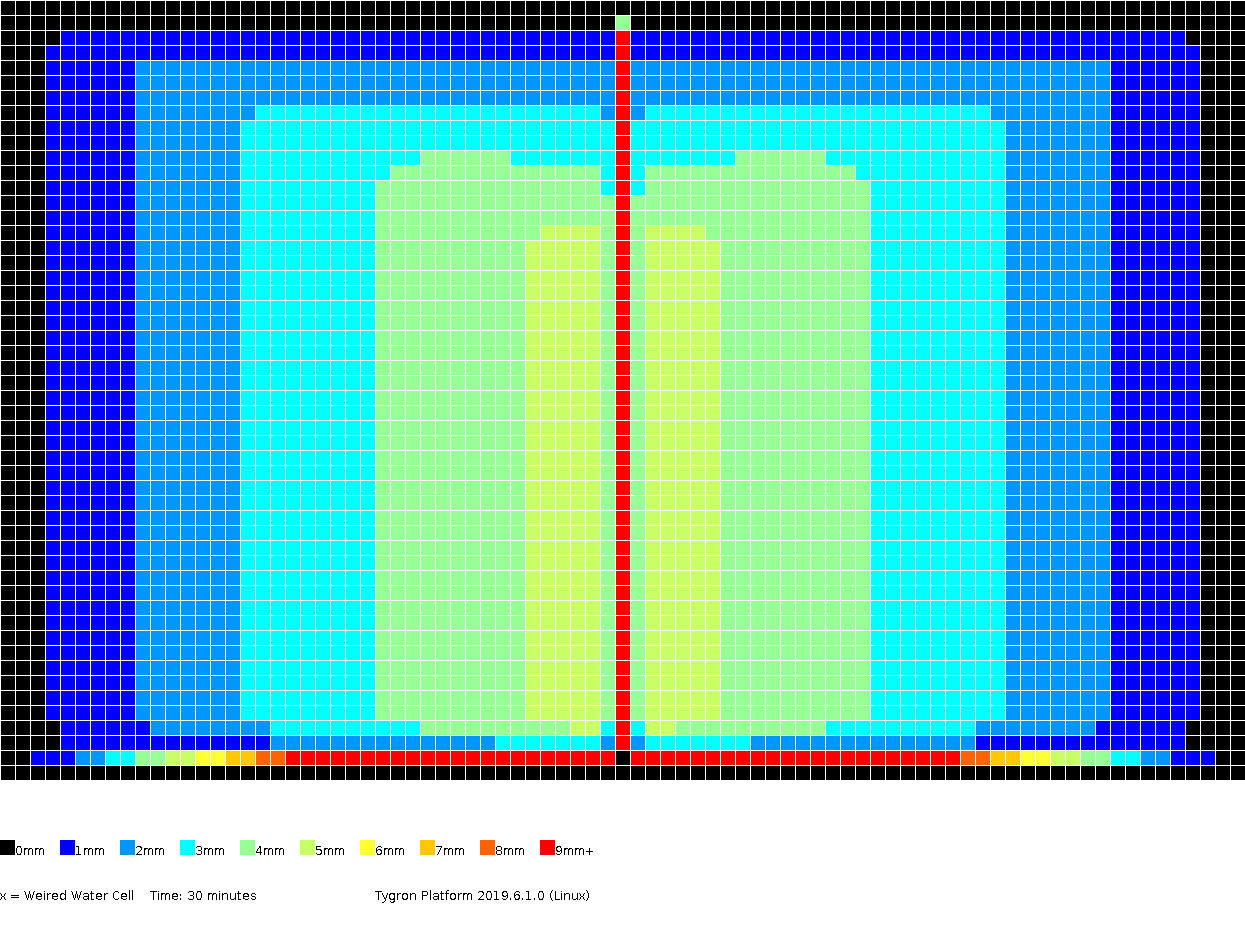
The amount of surface water (in meters), color coded per grid cell, presented for several timeframes.
-
 0h30m
0h30m -
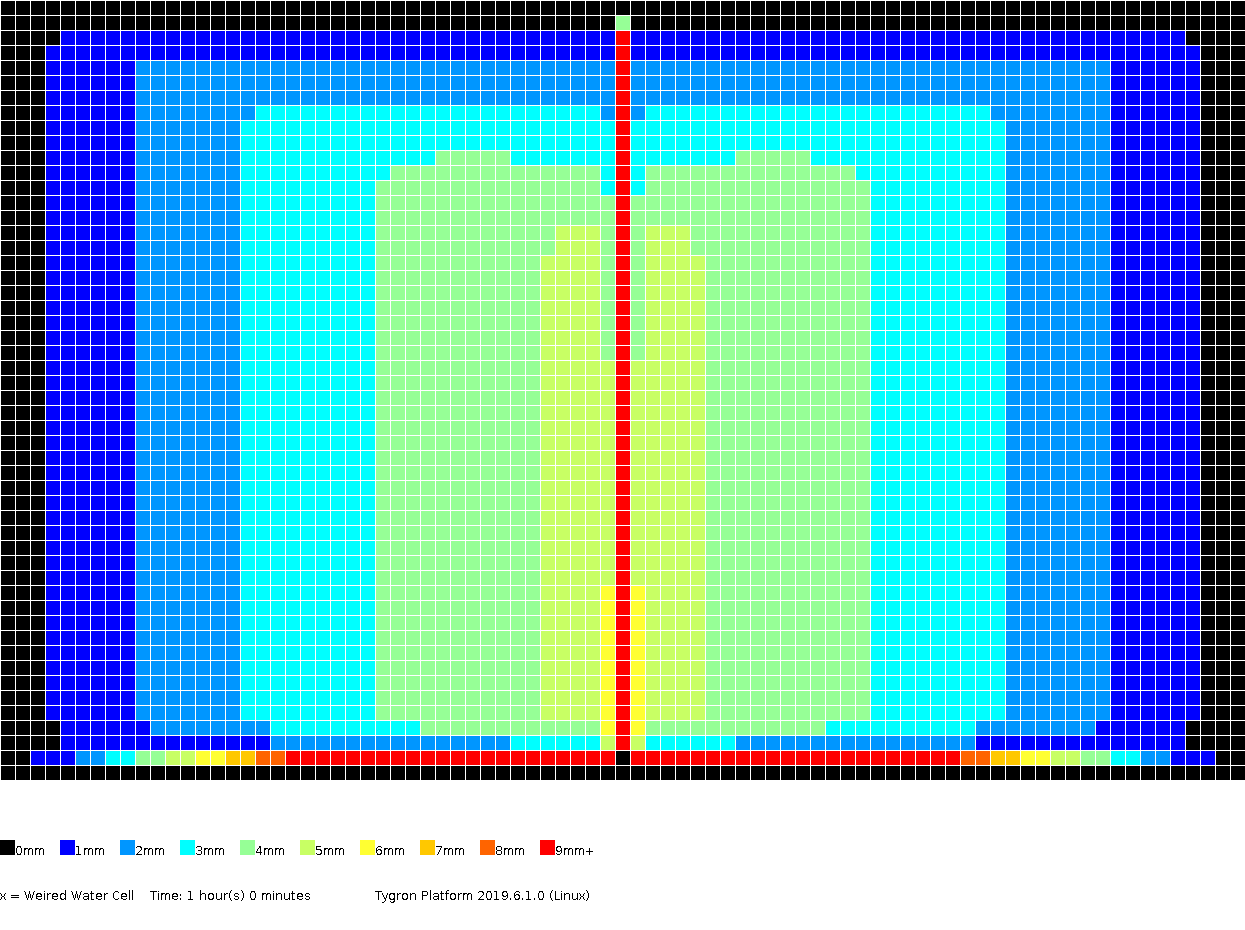
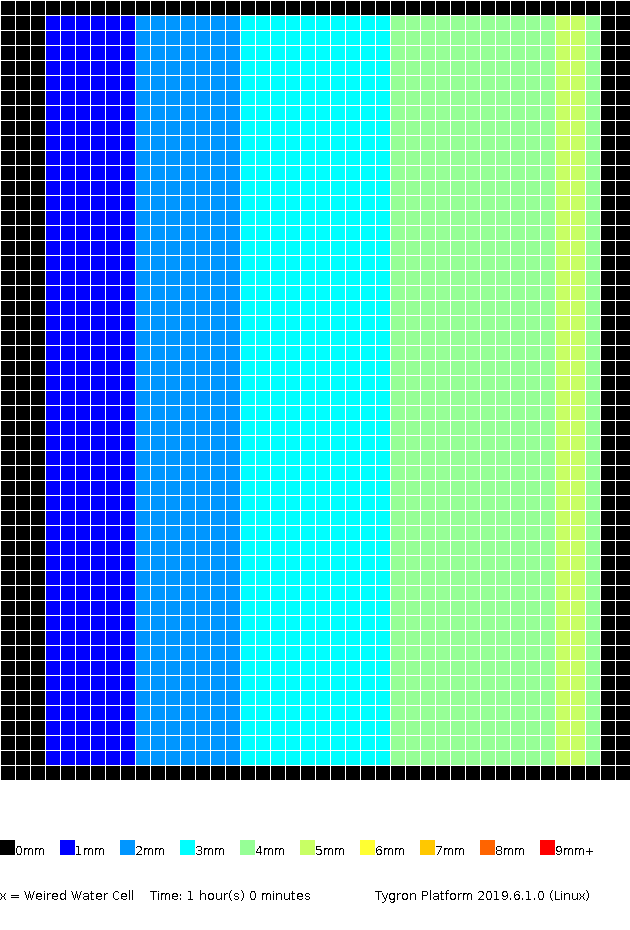 1h00m
1h00m -
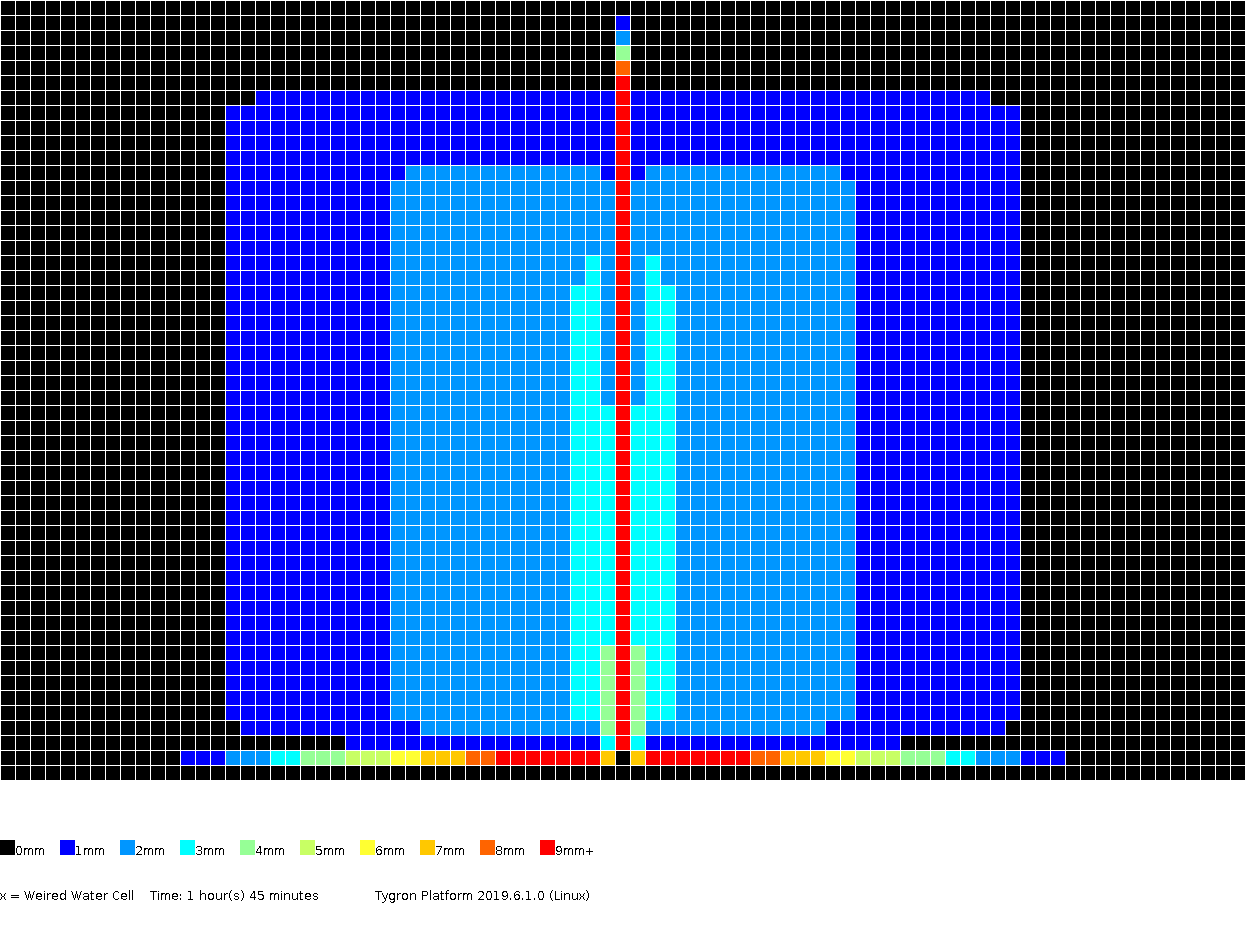
 1h30m
1h30m -
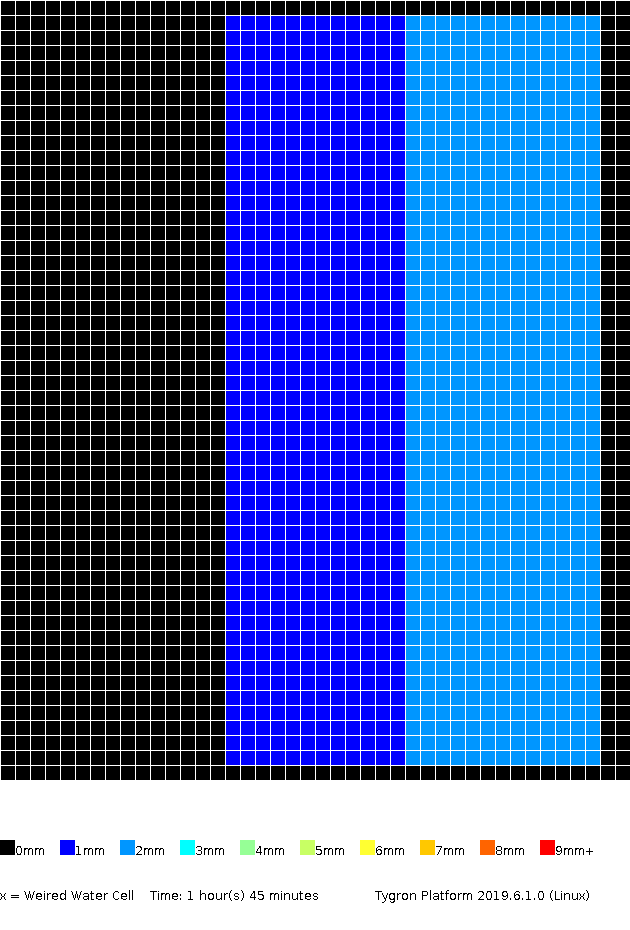 1h45m
1h45m -
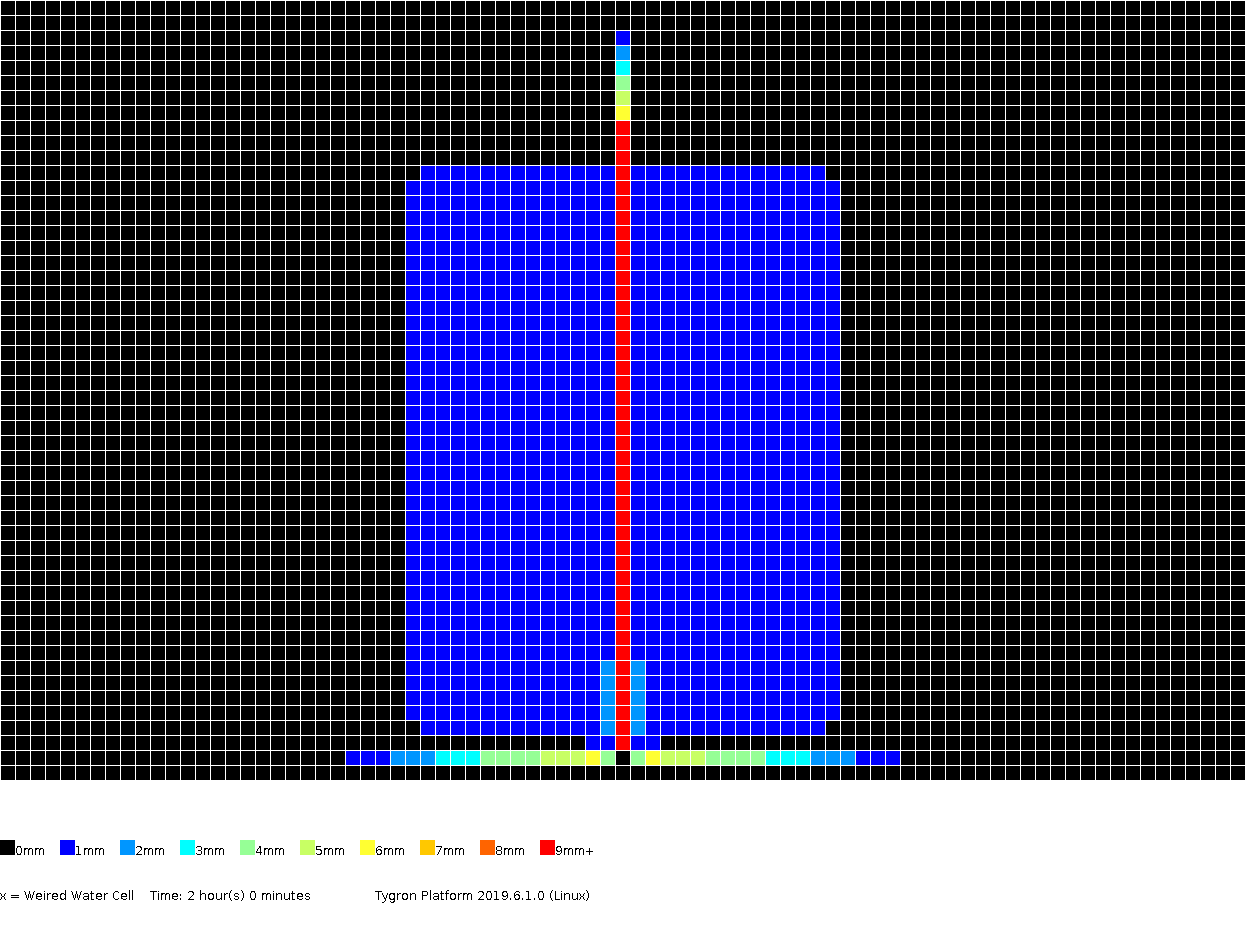
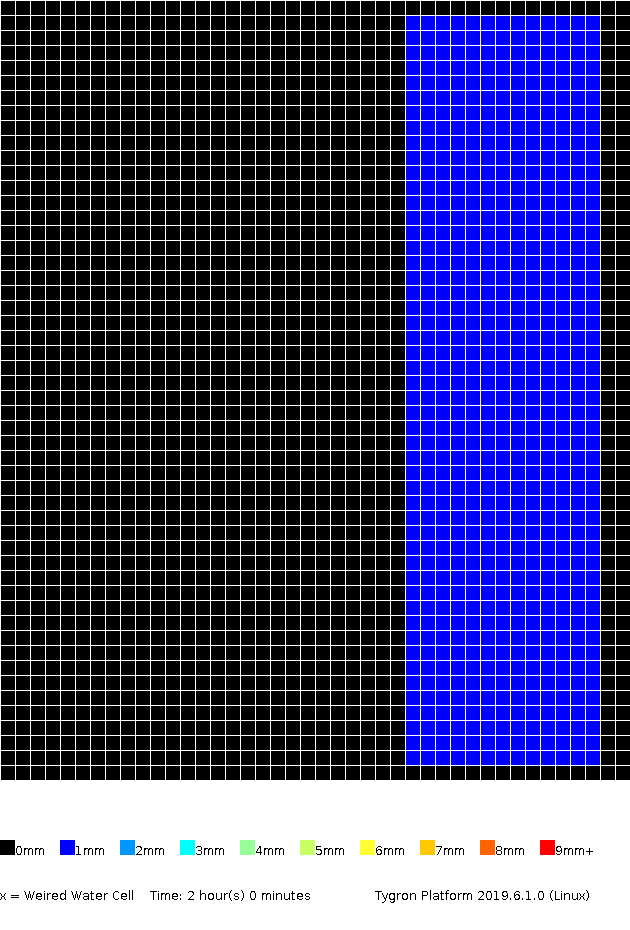 2h00m
2h00m -
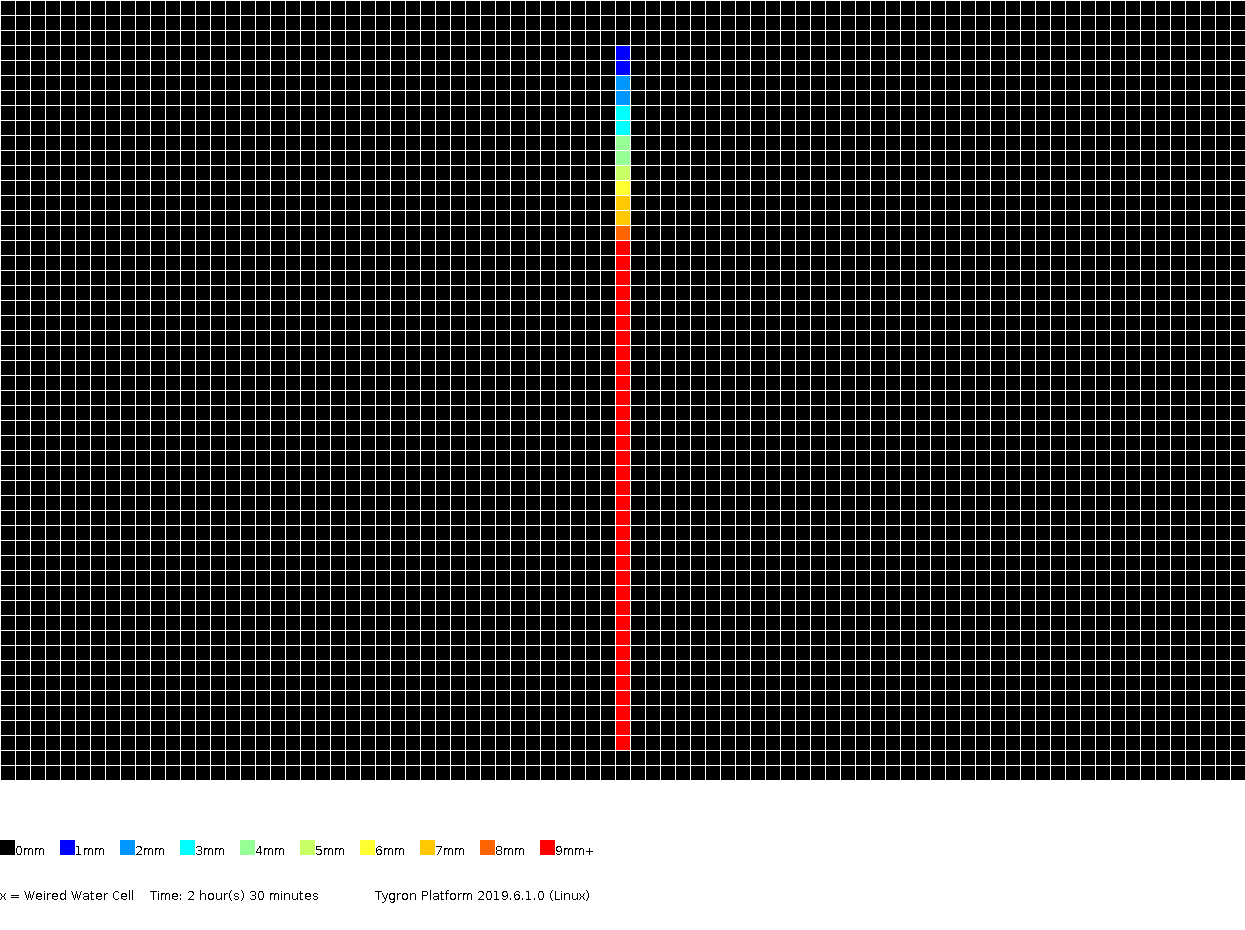
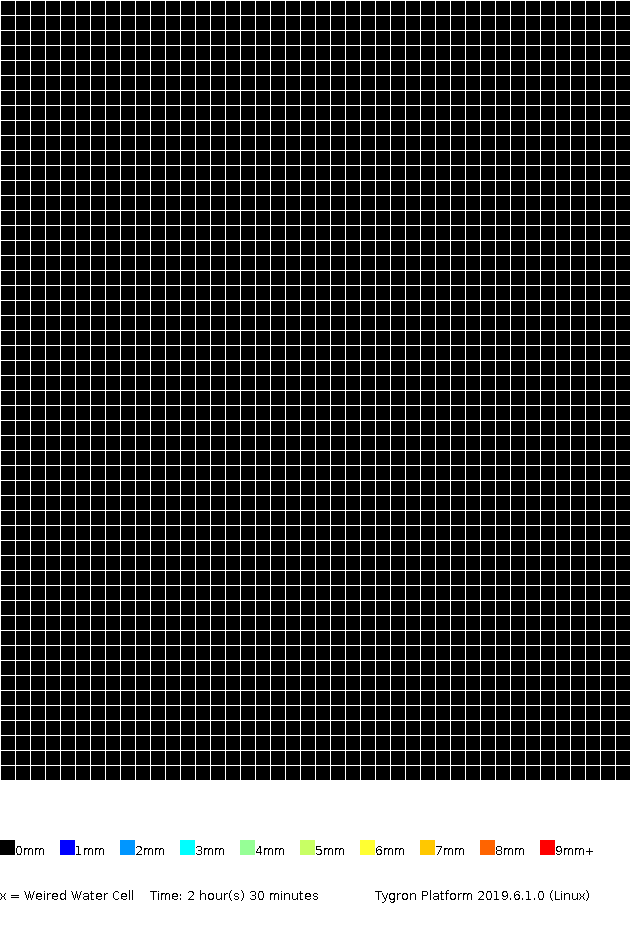 2h30m
2h30m -
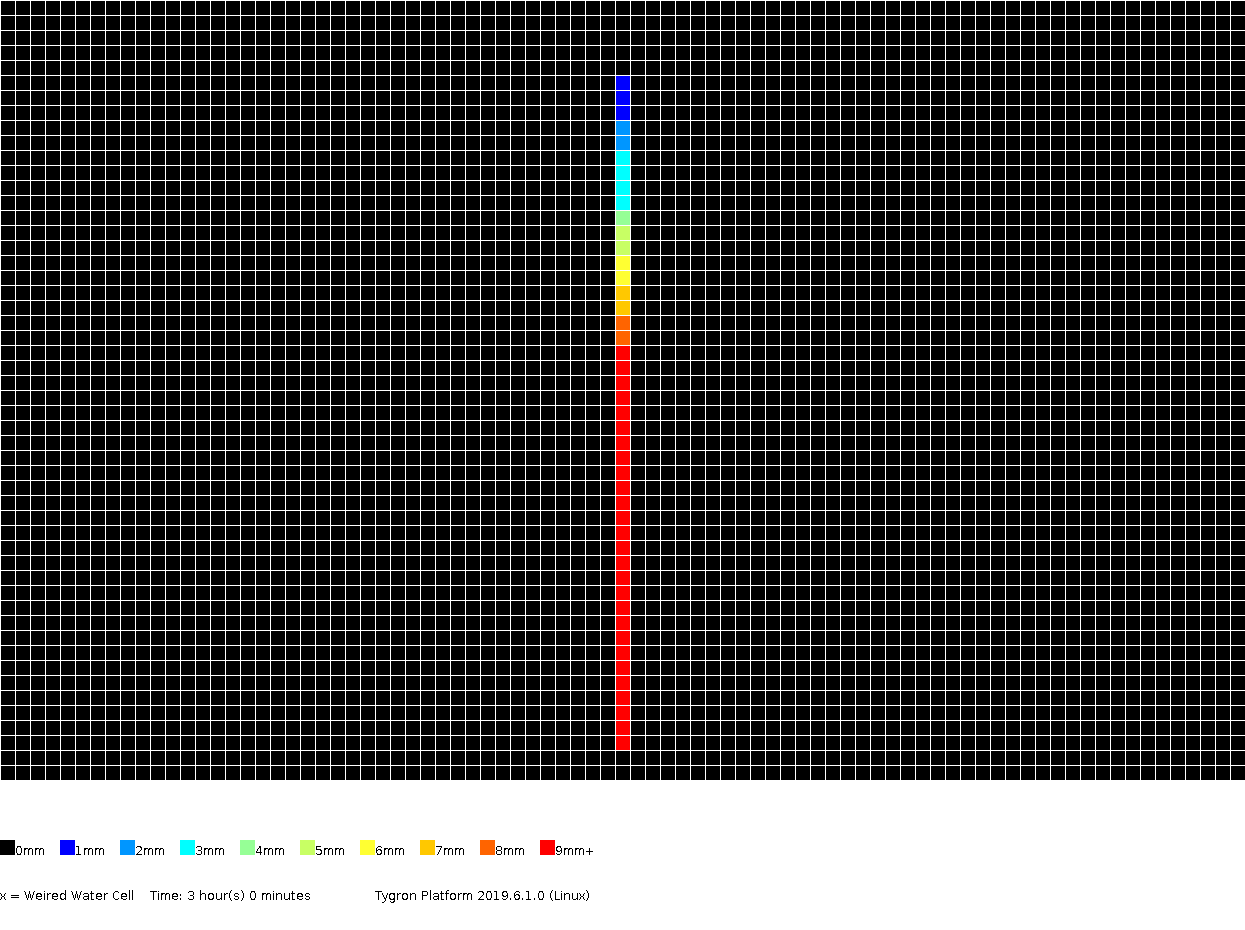
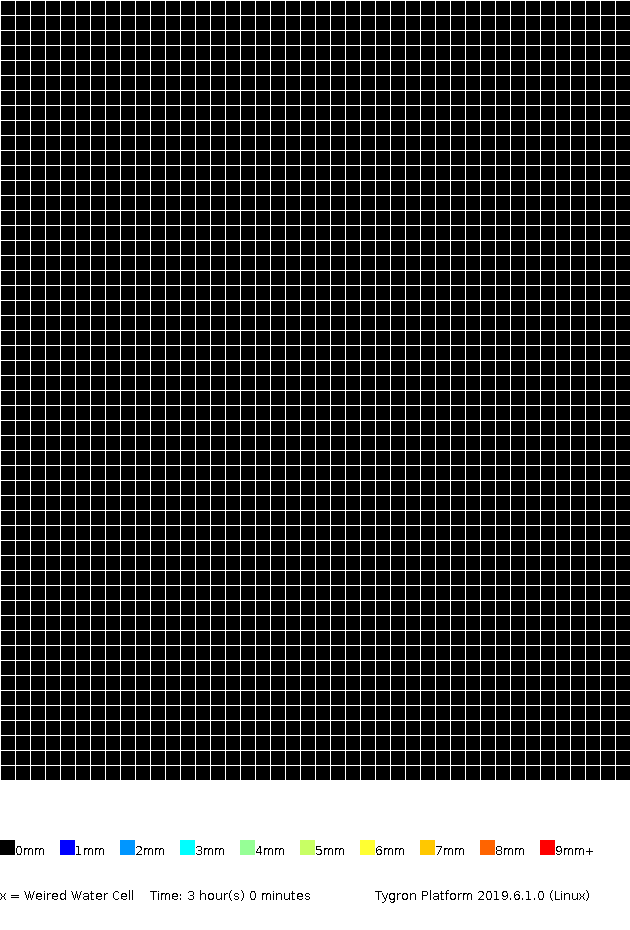 3h00m
3h00m


Test case 2
Test case 2 adds the following aspects with respect to test case 1:
- Flow coming from two directions that meet in the middle
- Deeper surface water flow
An analytic solution is available for this case. However, it is more complicated that test case 1. The influence of model boundaries should be less in this test case compared to test case 1.


Setup
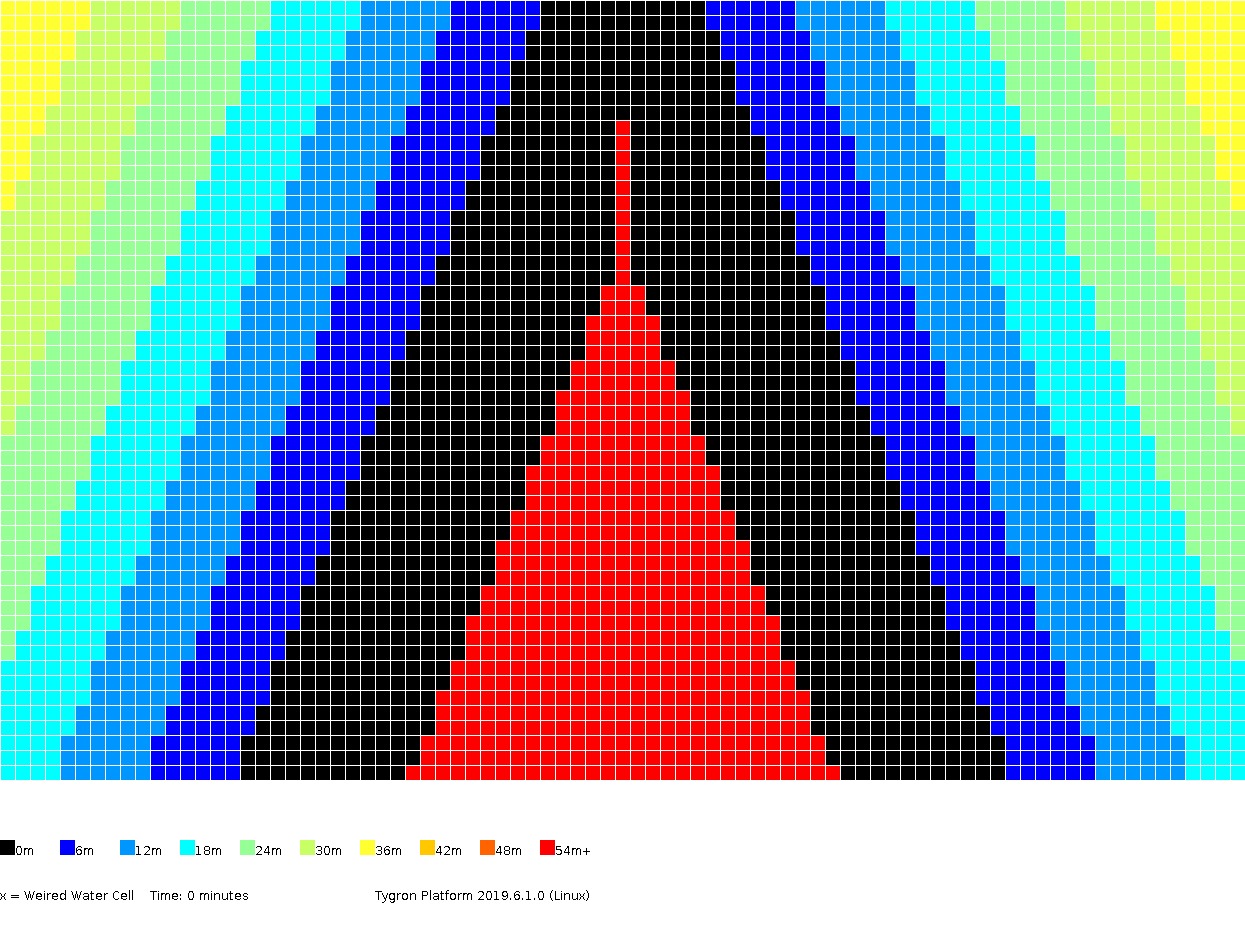
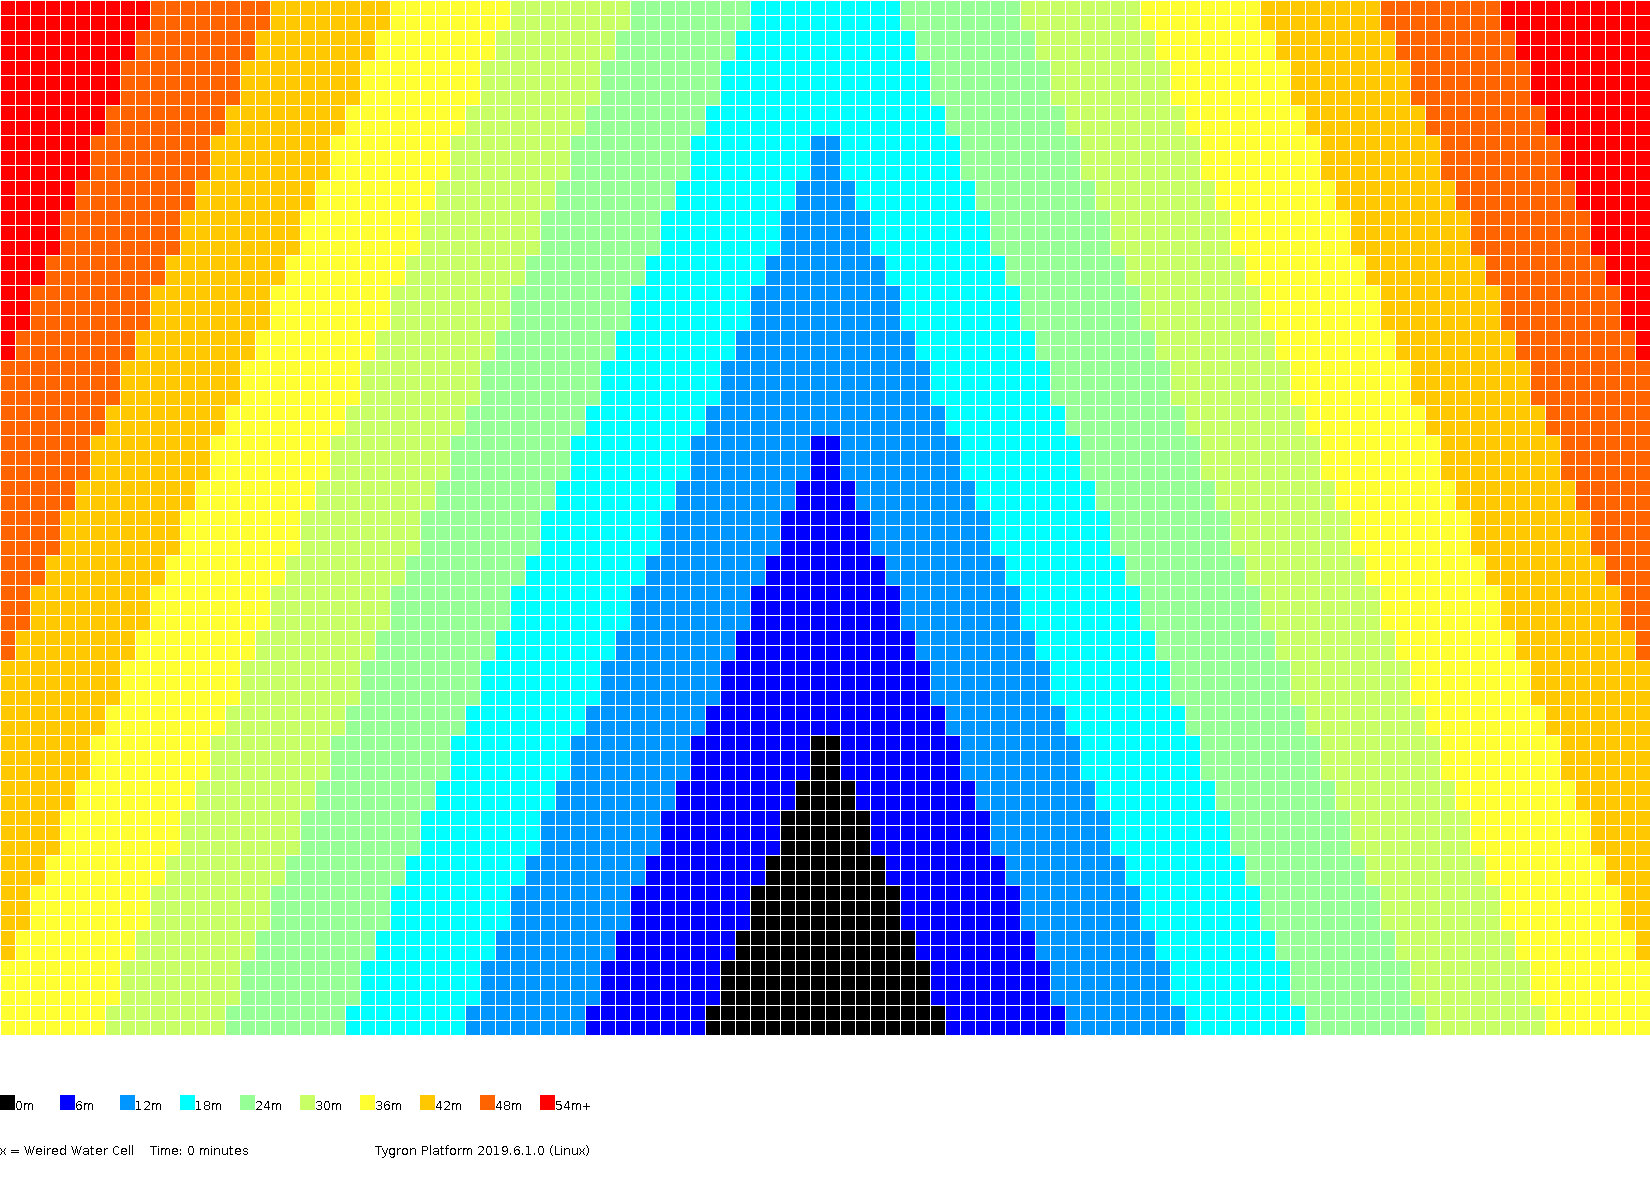
The lay-out of the terrain has a slanted V-shape. In the middle is a ditch, which is horizontal in the x-direction but slanted downwards in the y-direction with a value of 0.02. The terrain around the ditch is slanted downwards in the x-direction with a value of 0.05. Furthermore, the ditch is +-0.05m deep at the top. In the y-direction is remains horizontal. For the exact measurements see figure 5.9 above. A graphical impression of the height map in this testcase is given below. Again first the original height map and next the height map adjusted for ensuring a constant slope per grid cell x- and y-direction.
Initial 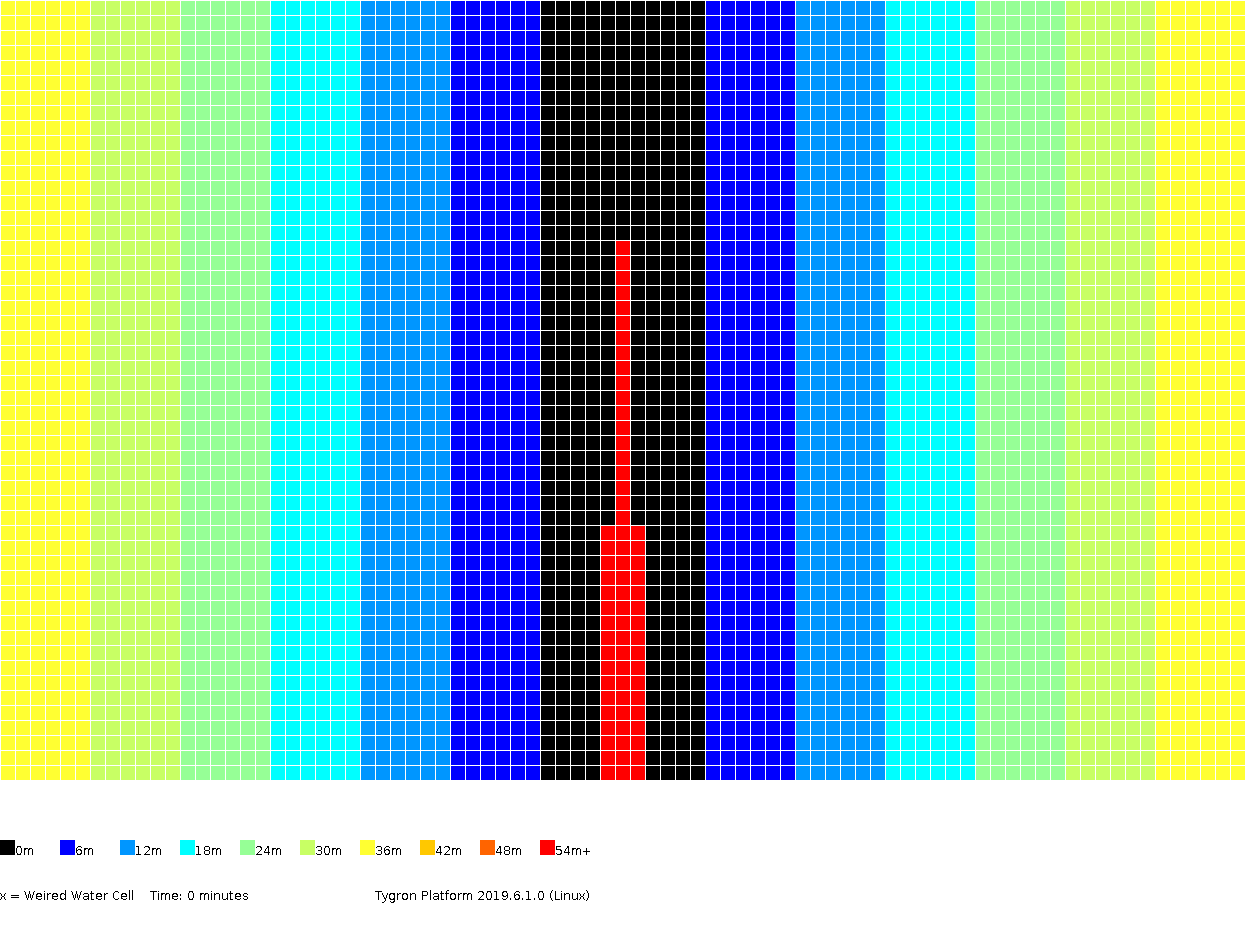
After slope adjustments


Results
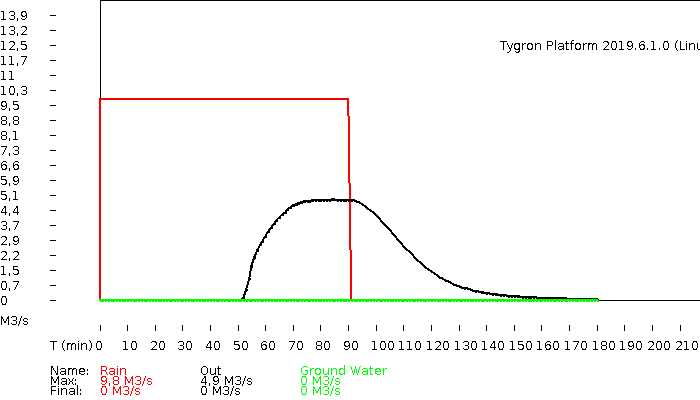
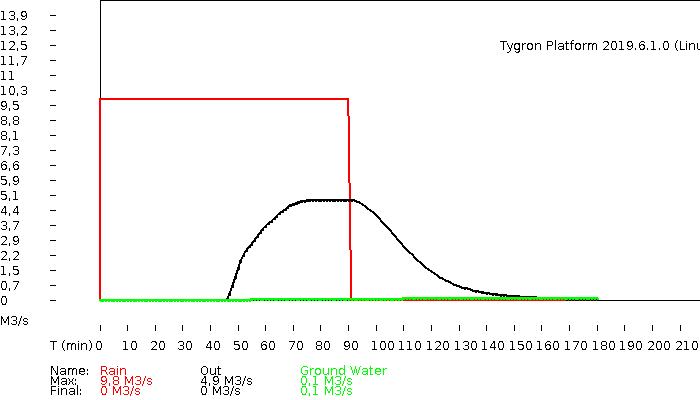
The hydrograph and volumes.
-
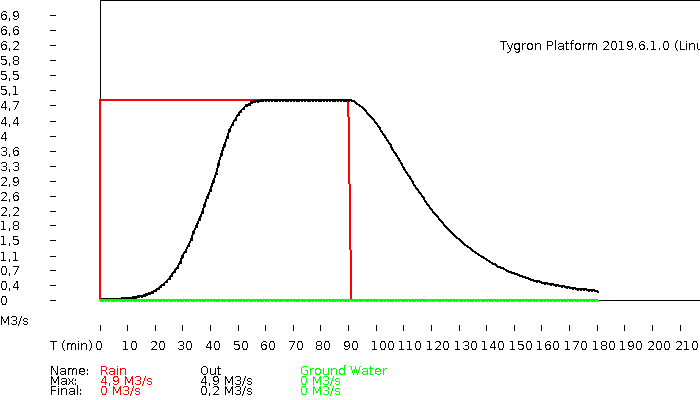 hydrograph
 -
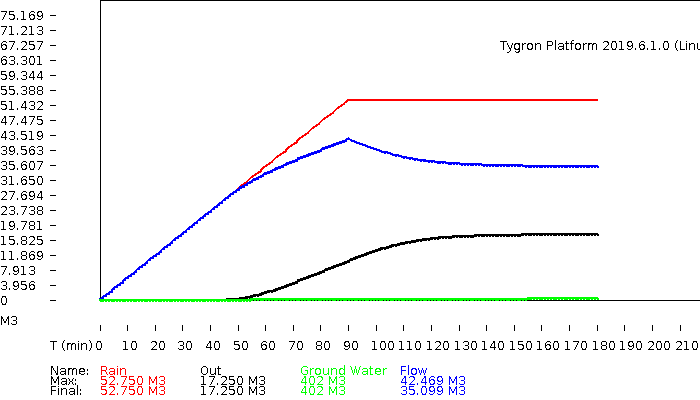
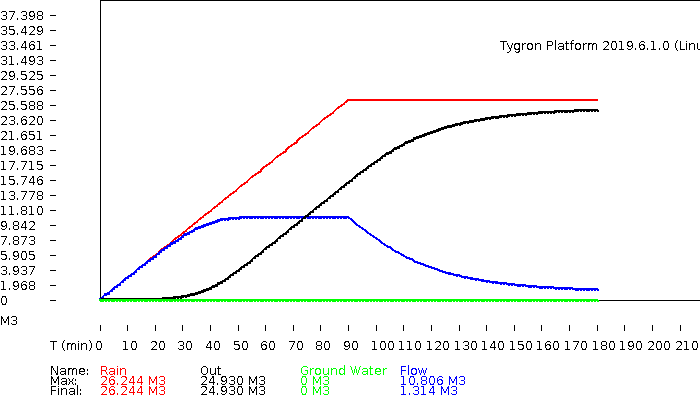 volumes


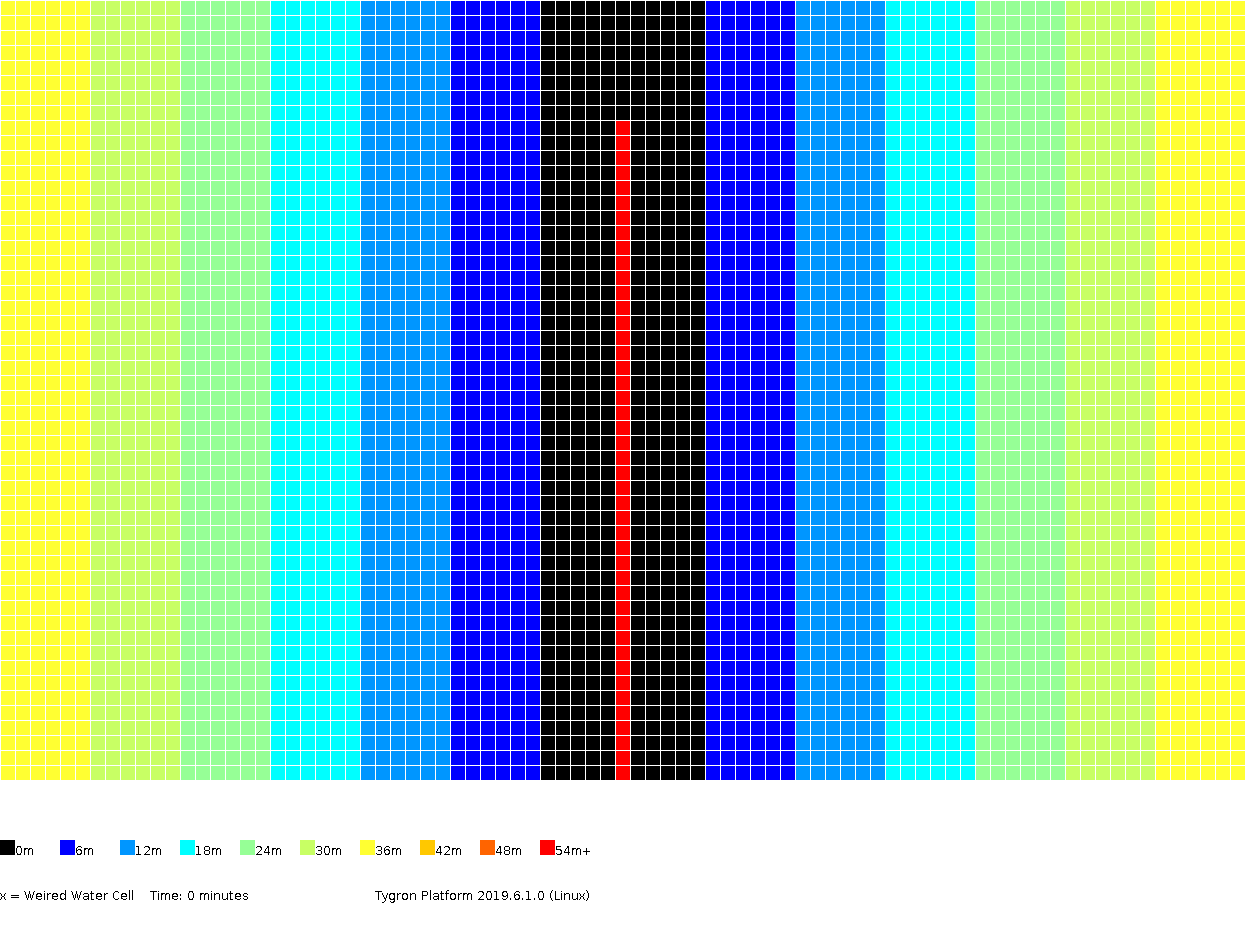
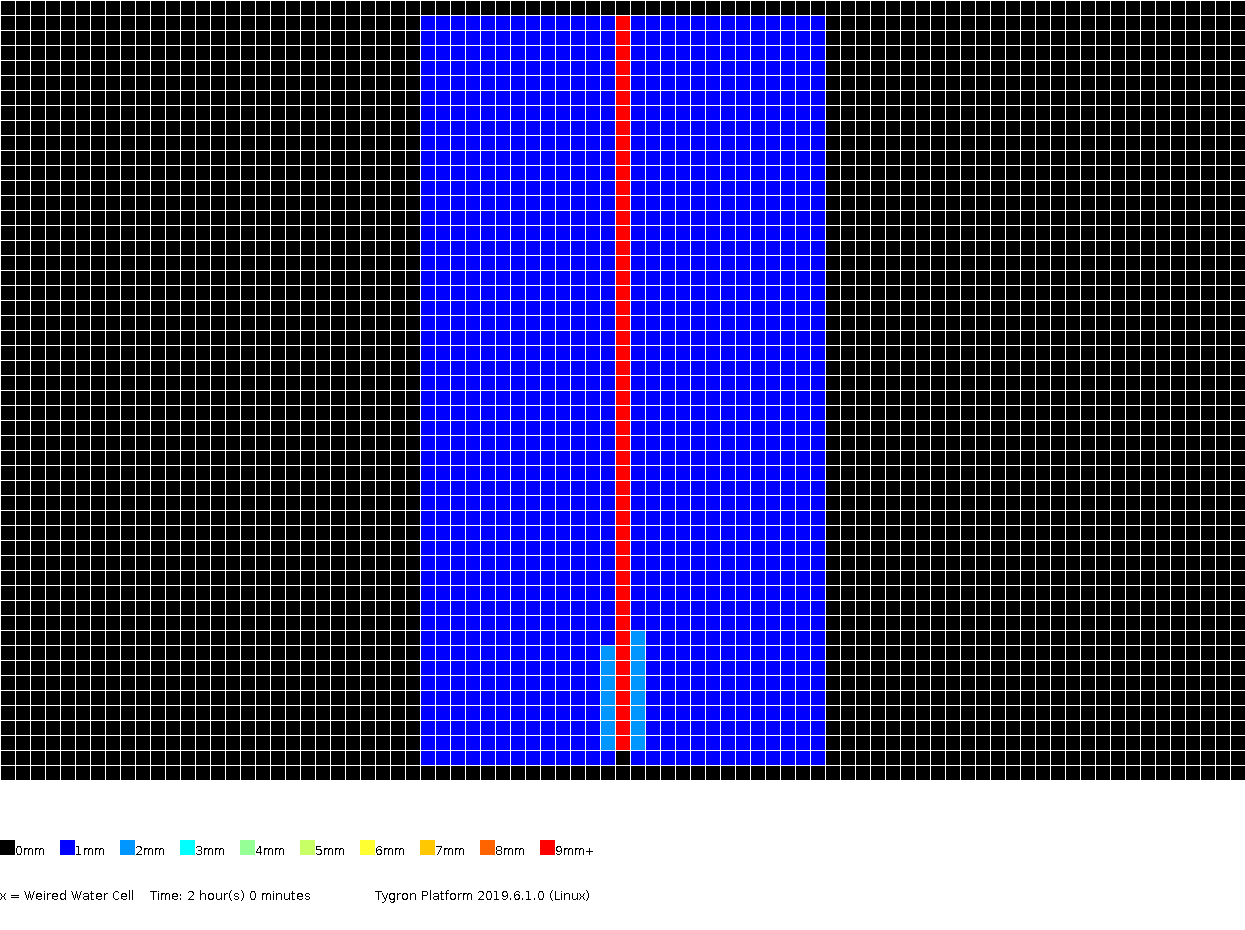
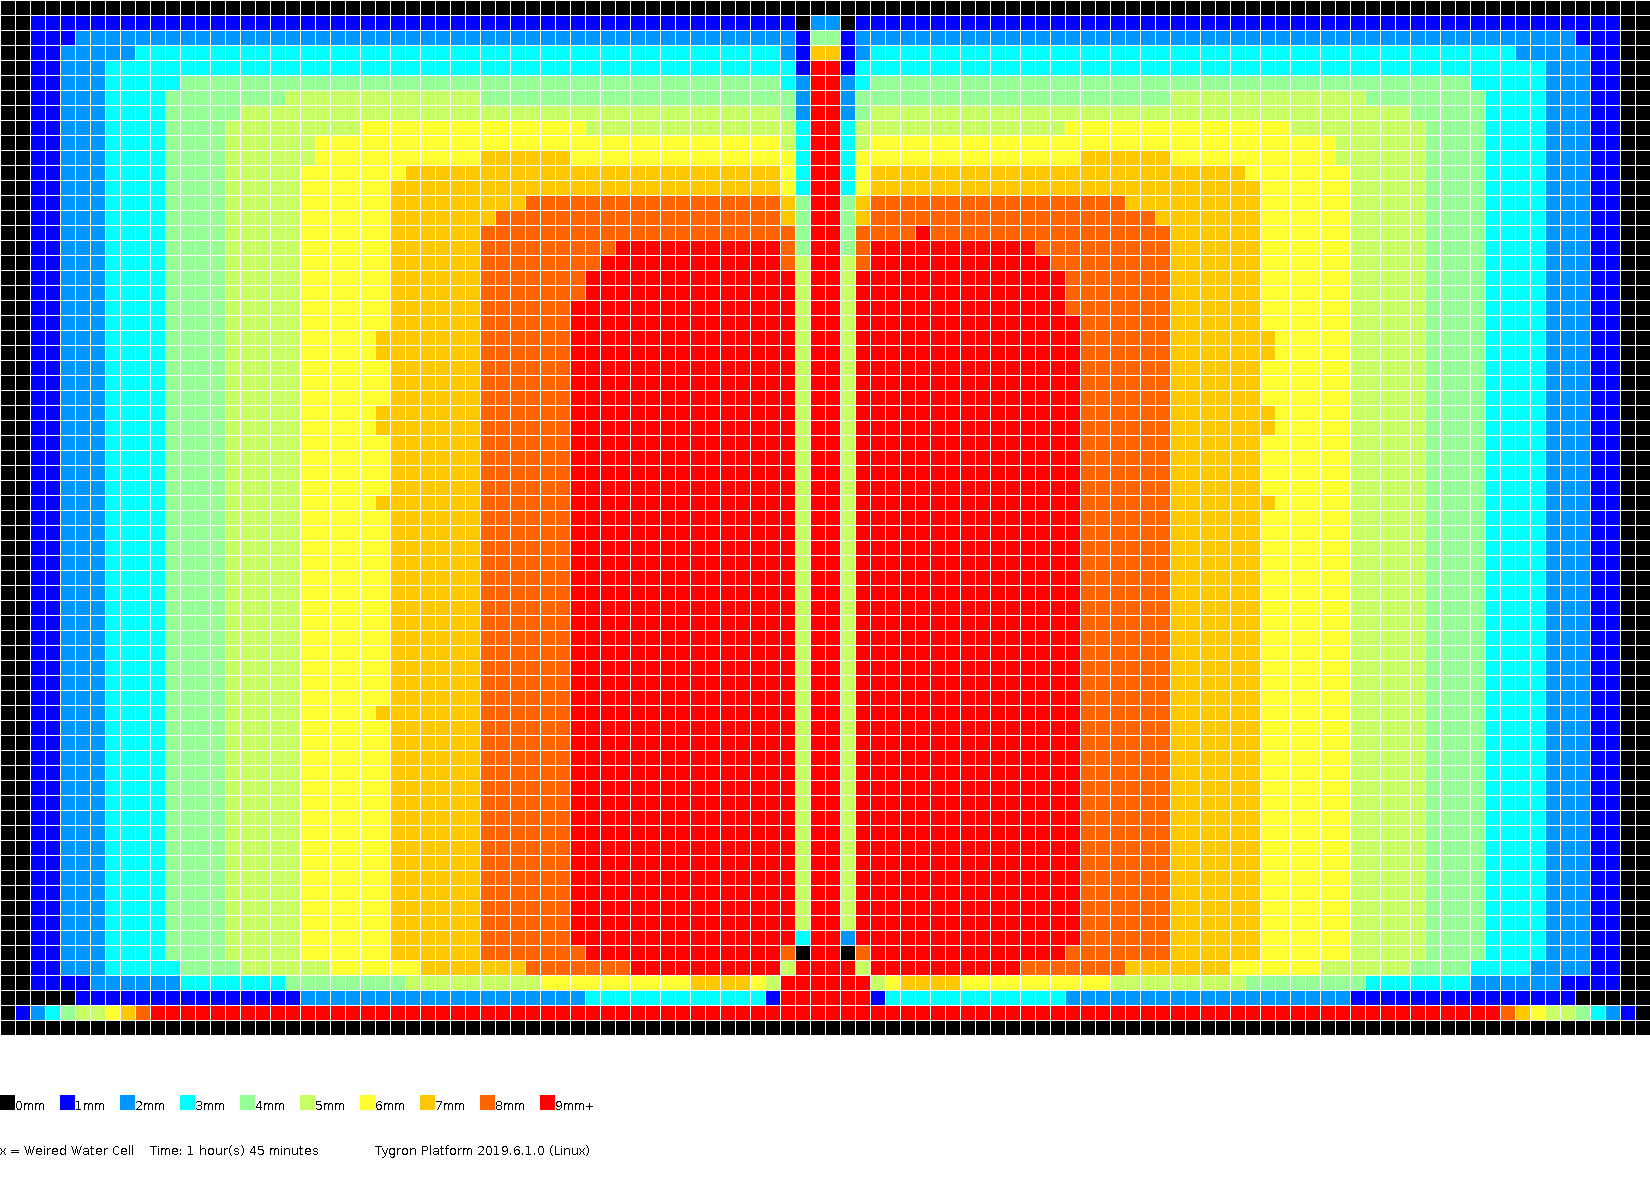
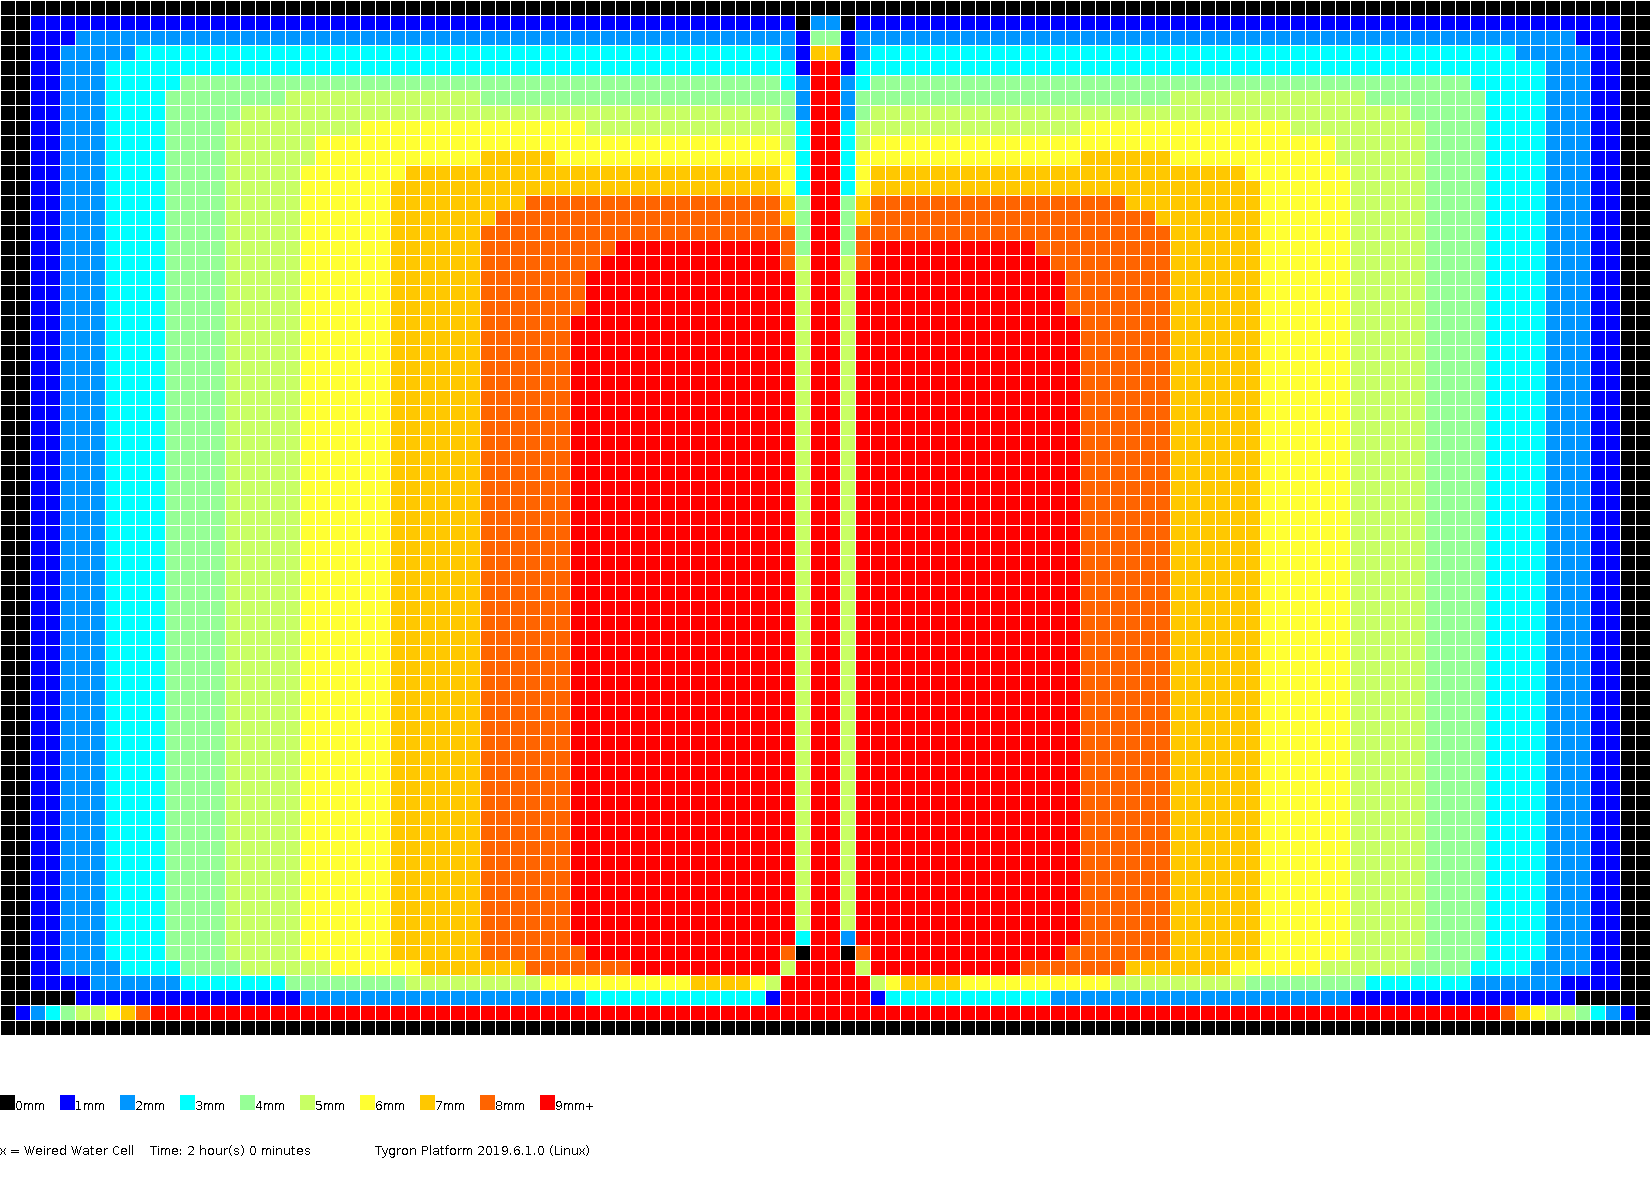
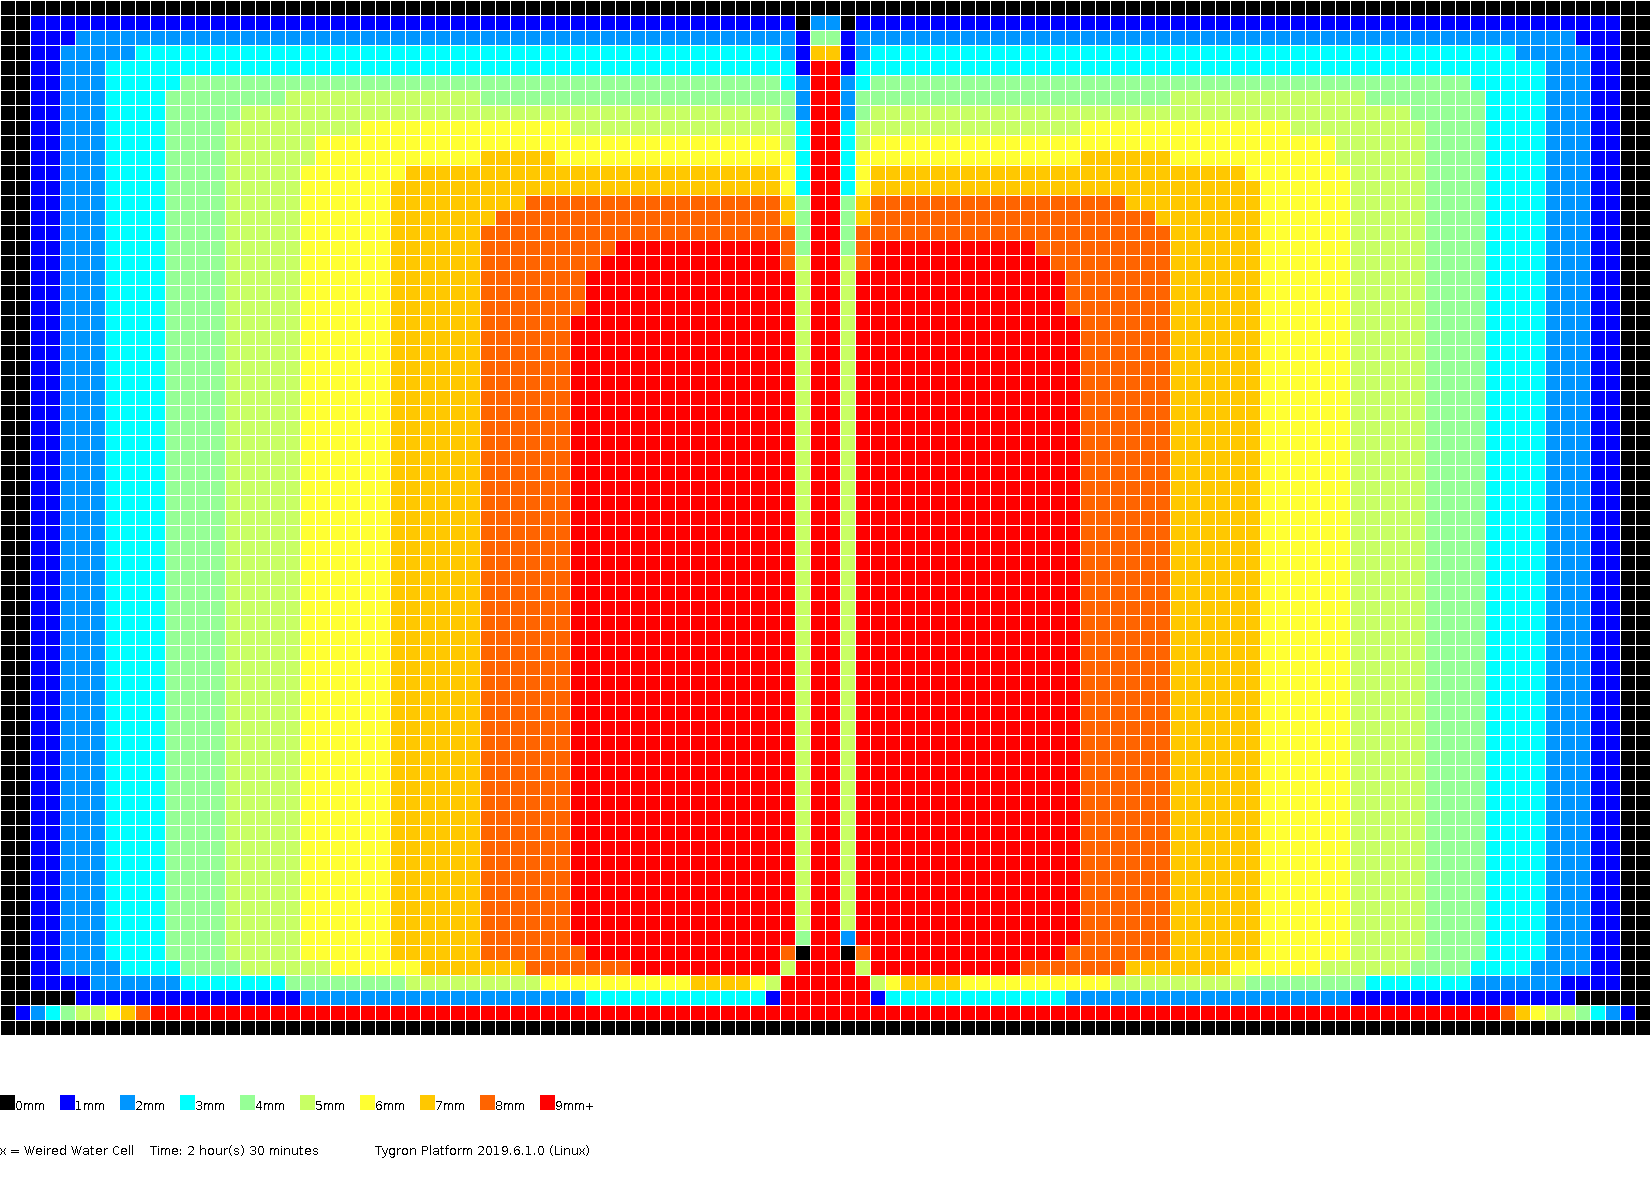
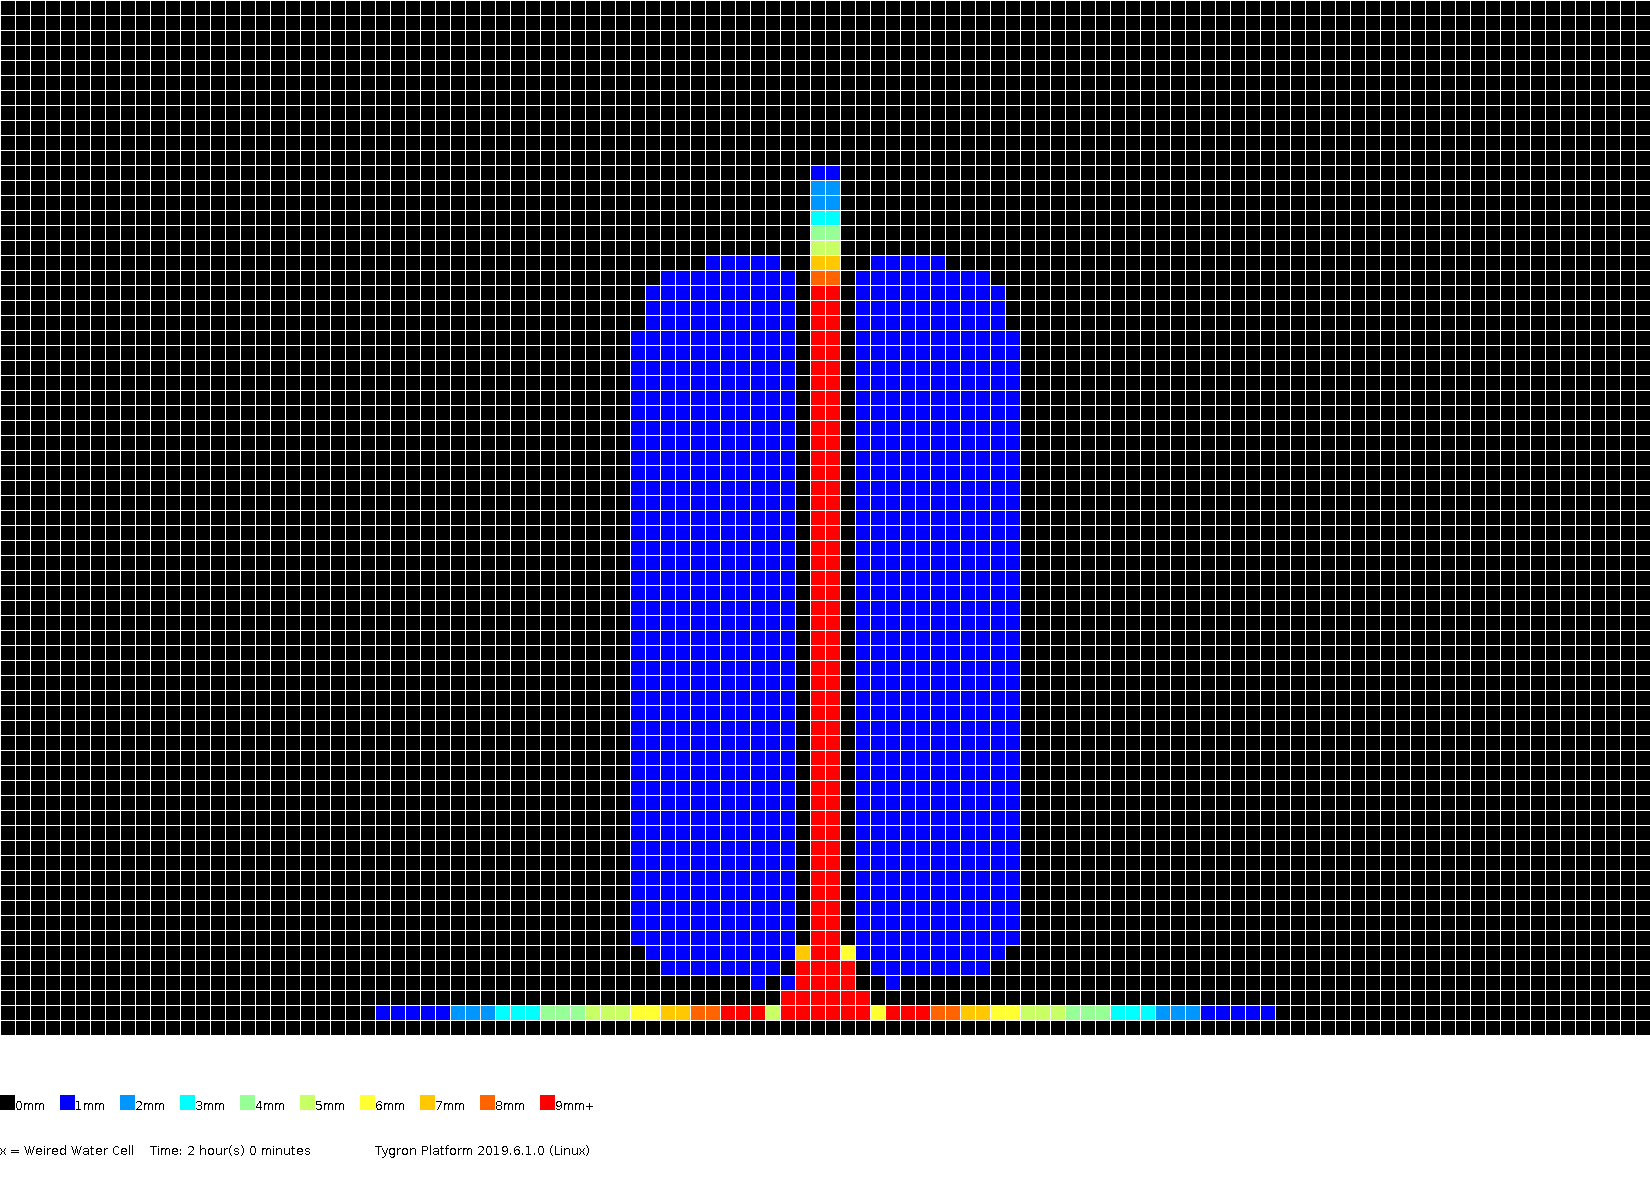
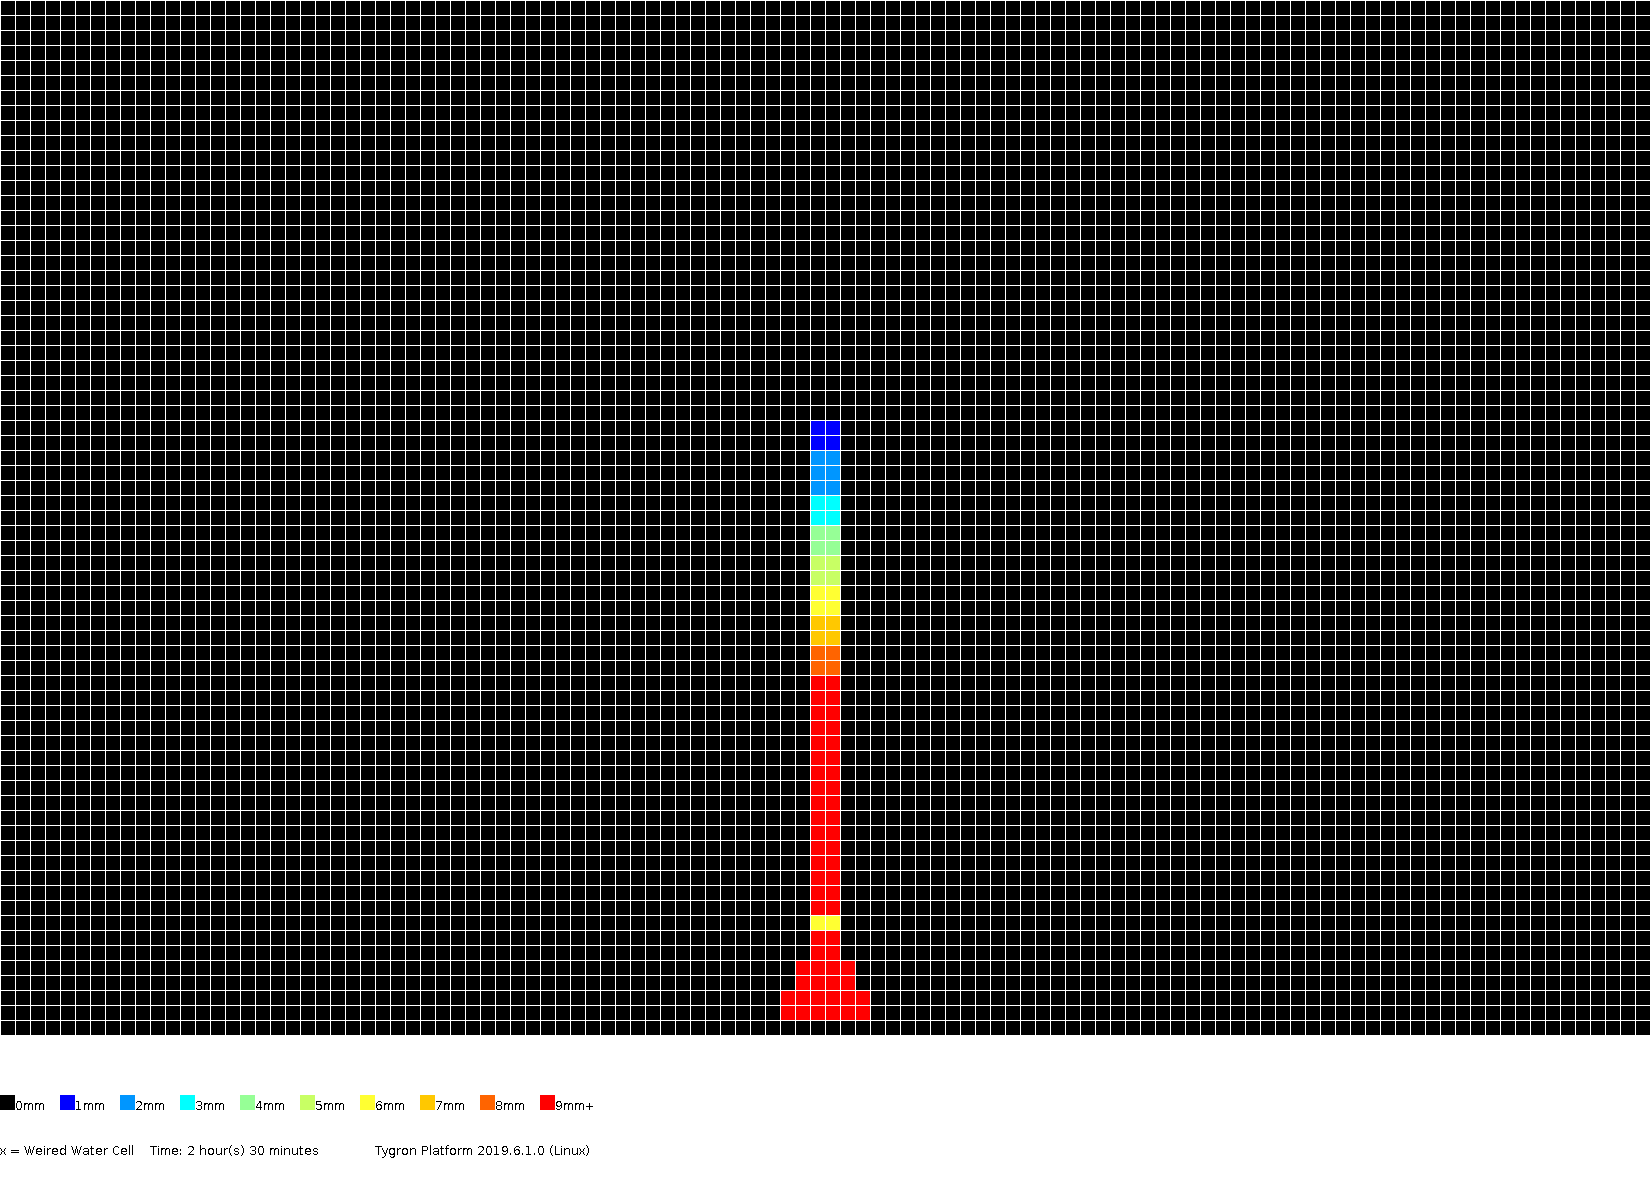
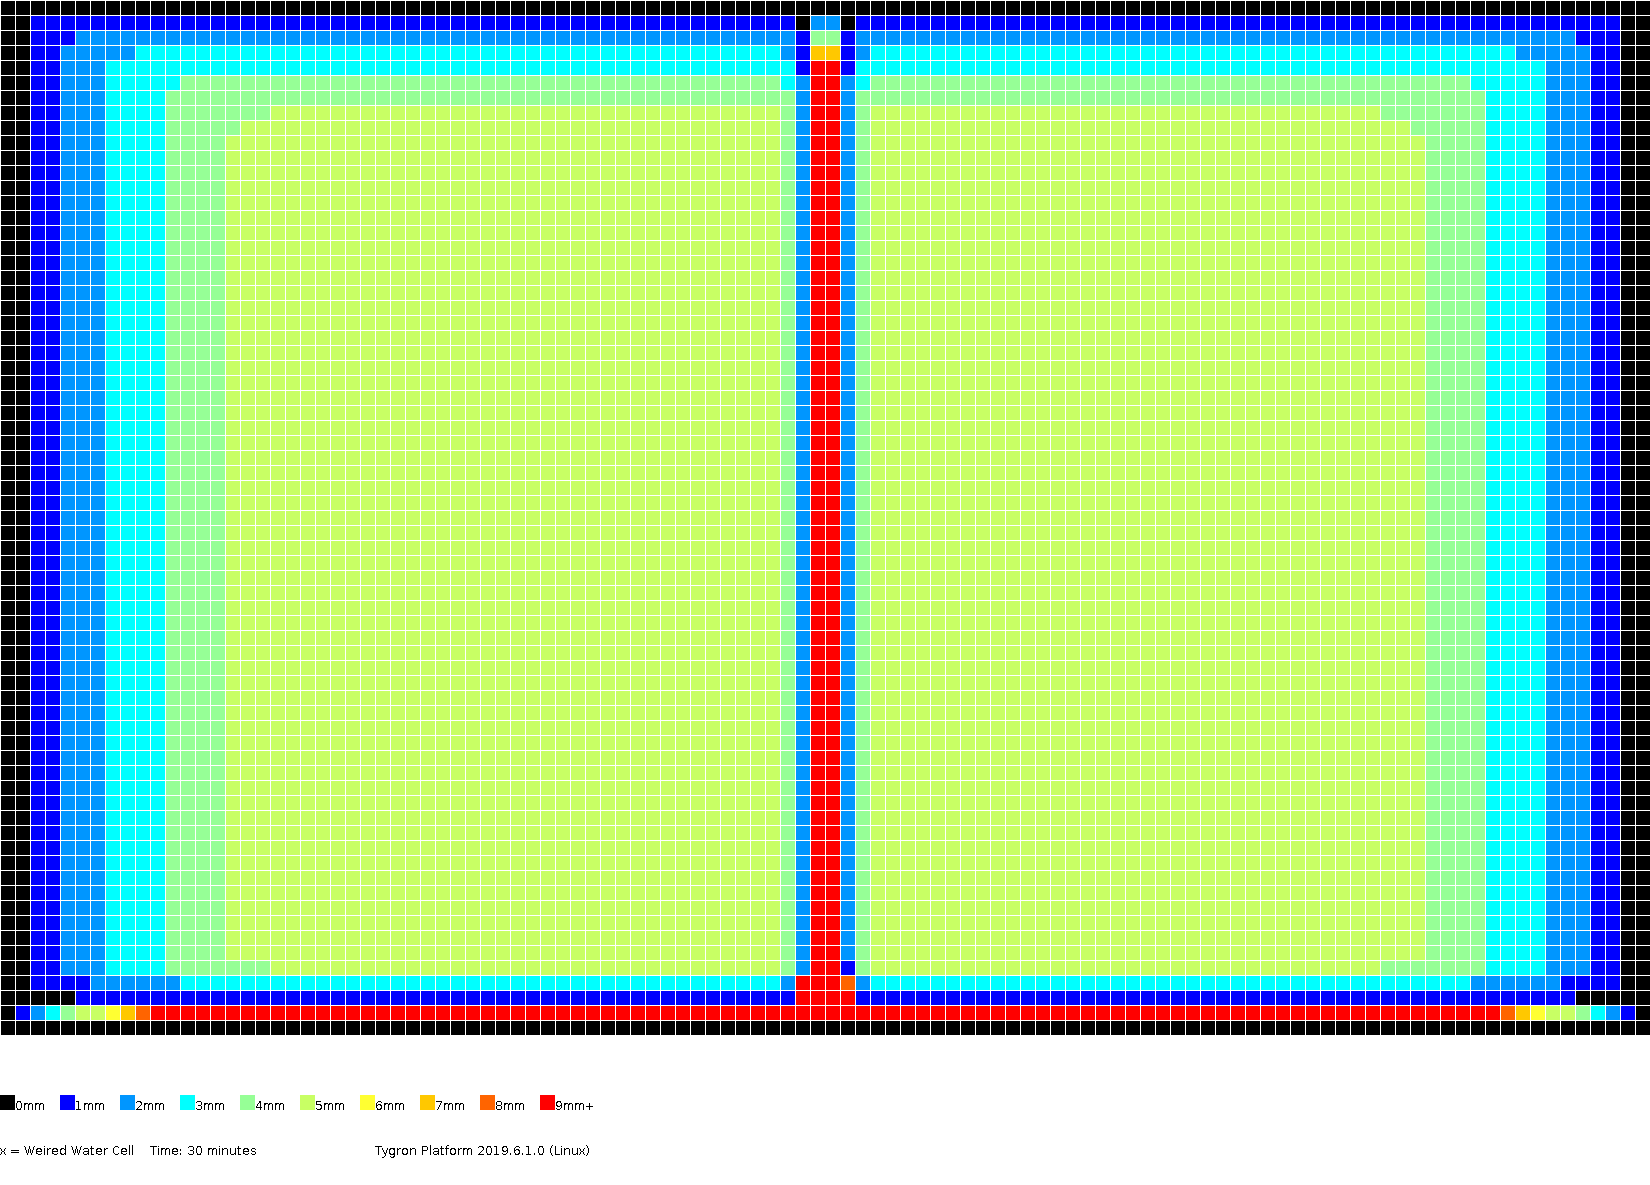
The amount of surface water (in meters), color coded per grid cell, presented for several timeframes.
-
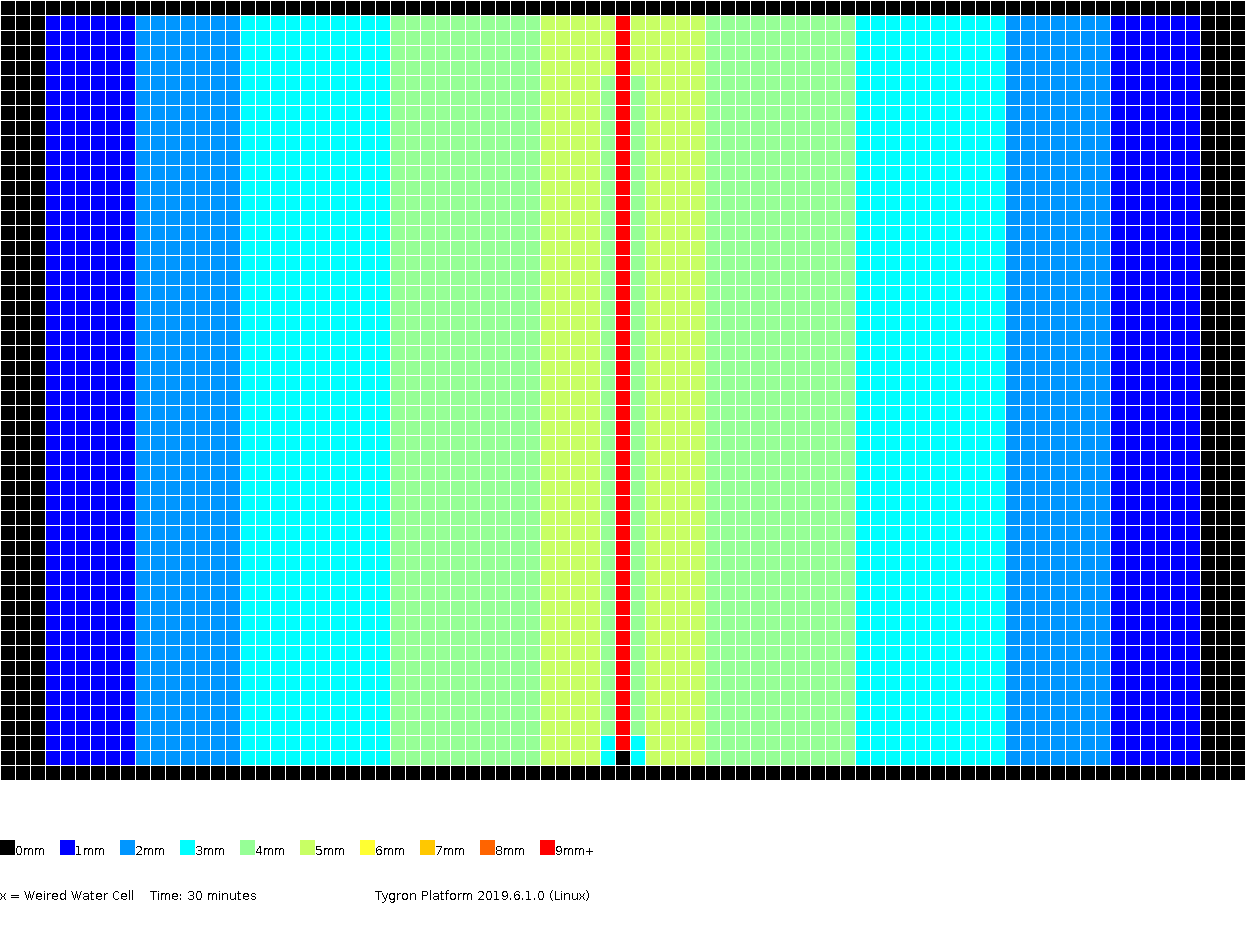 0h30m
0h30m -
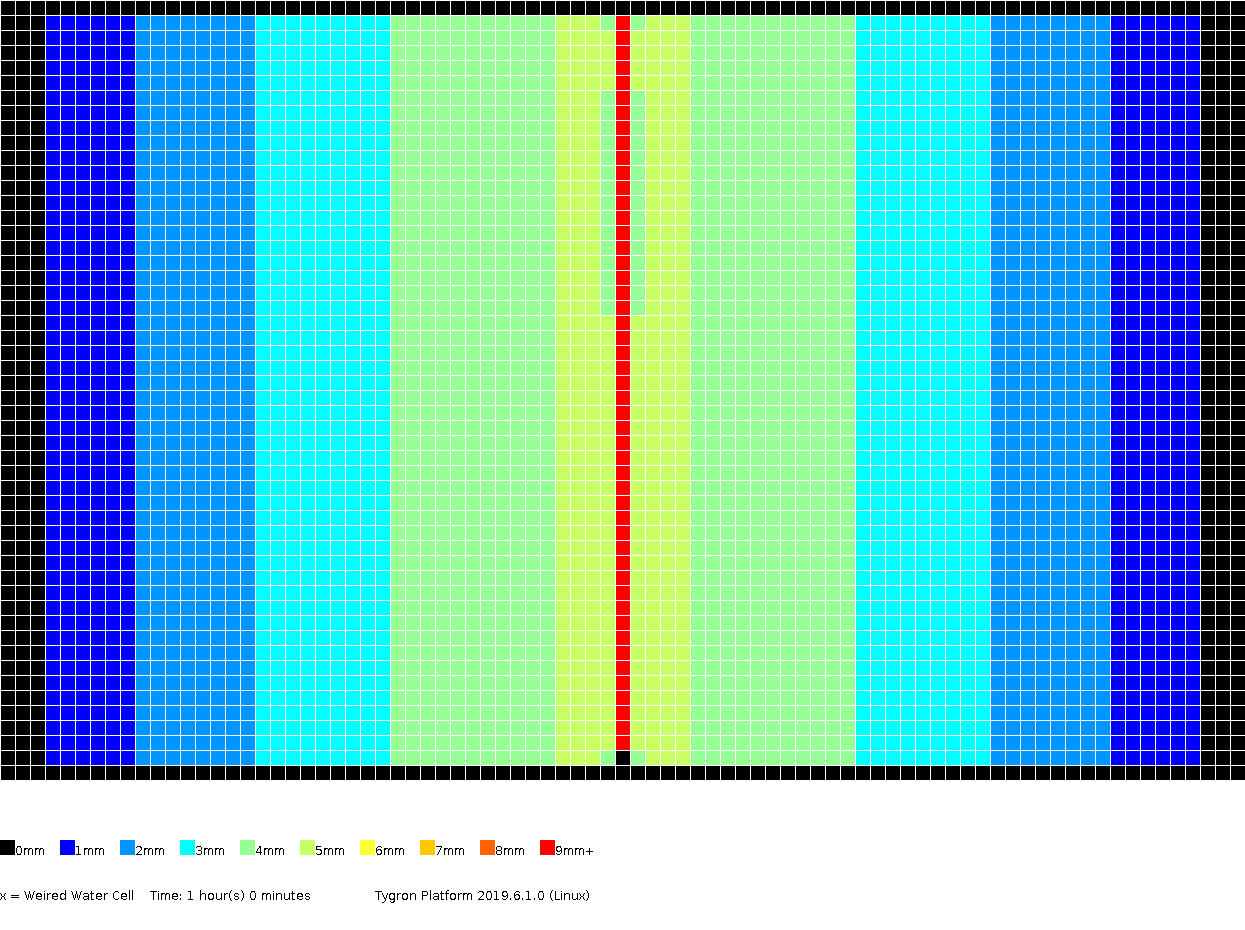 1h00m
1h00m -
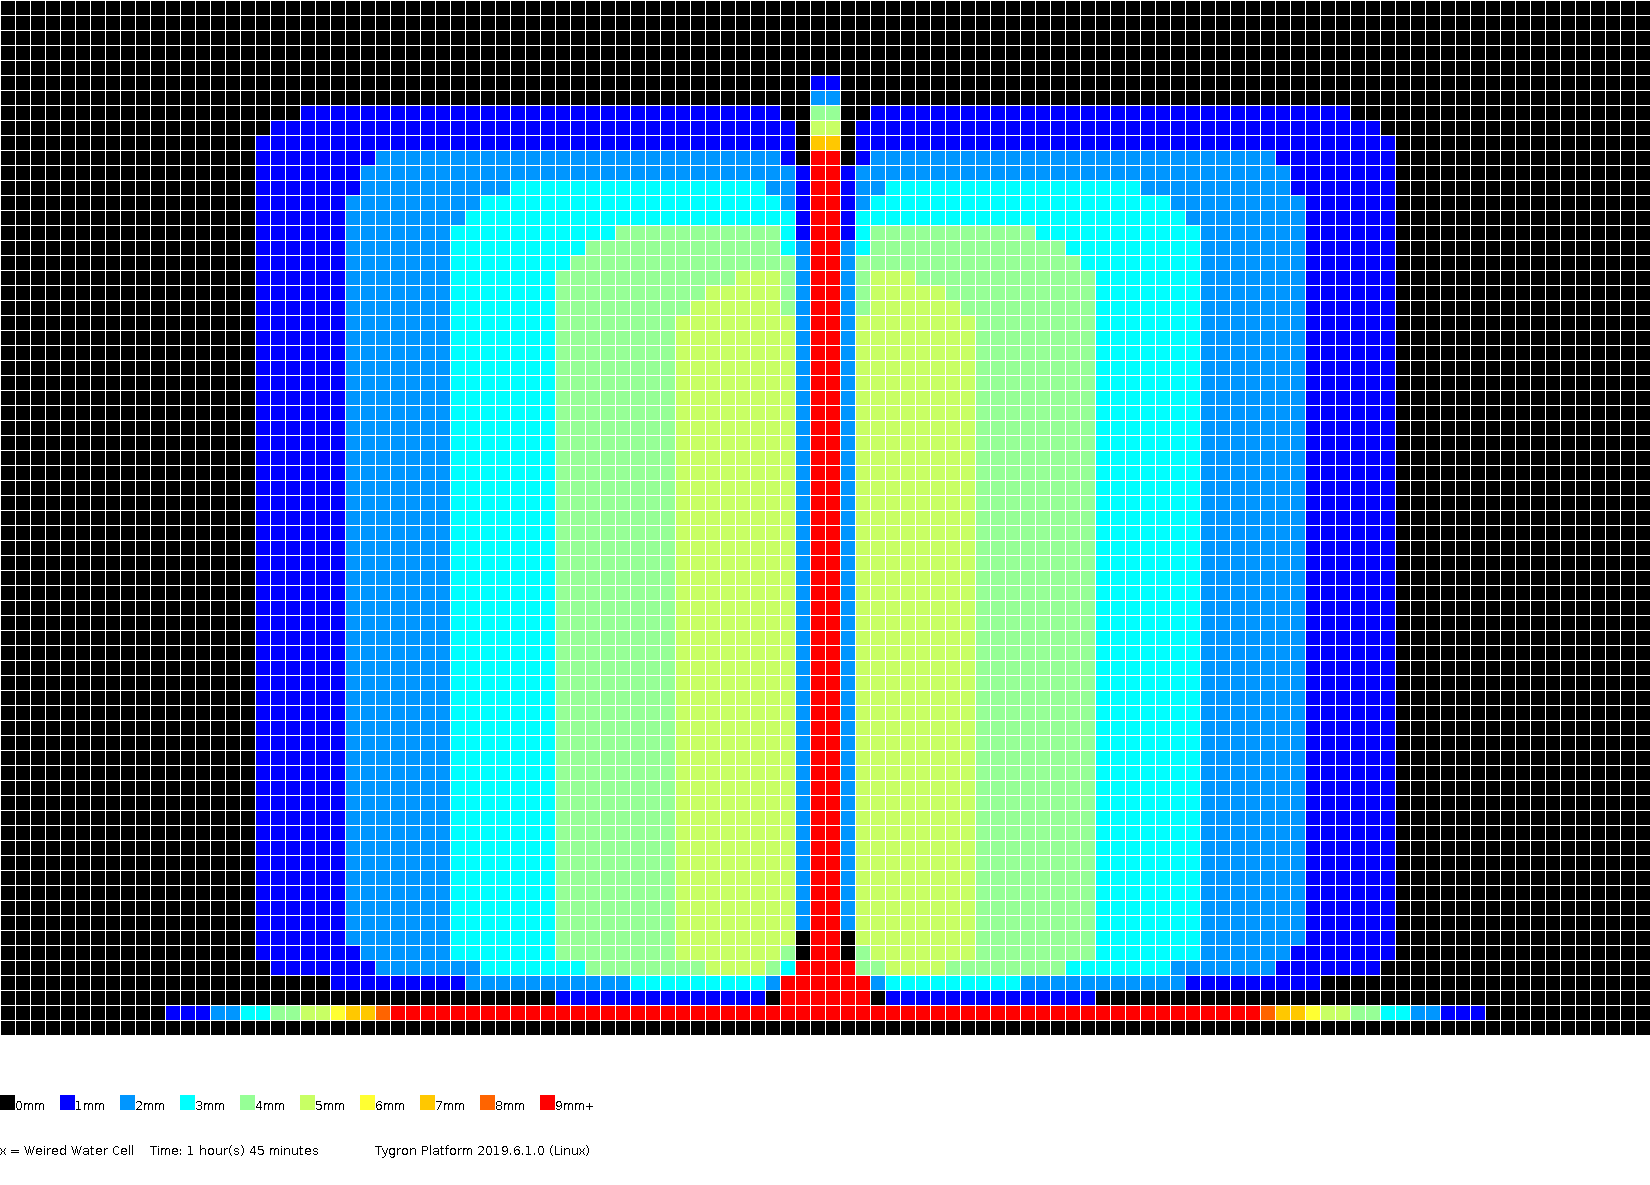
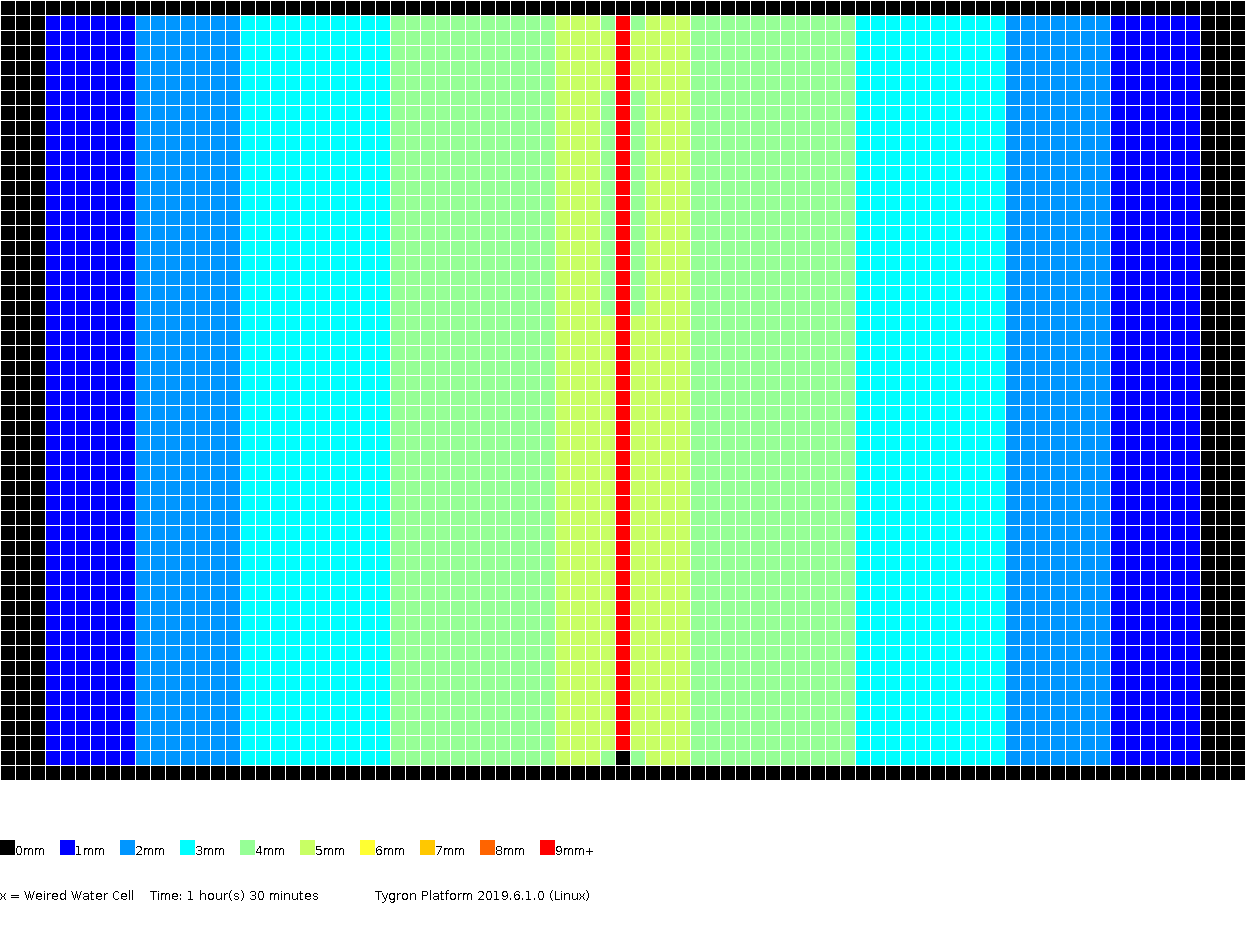 1h30m
1h30m -
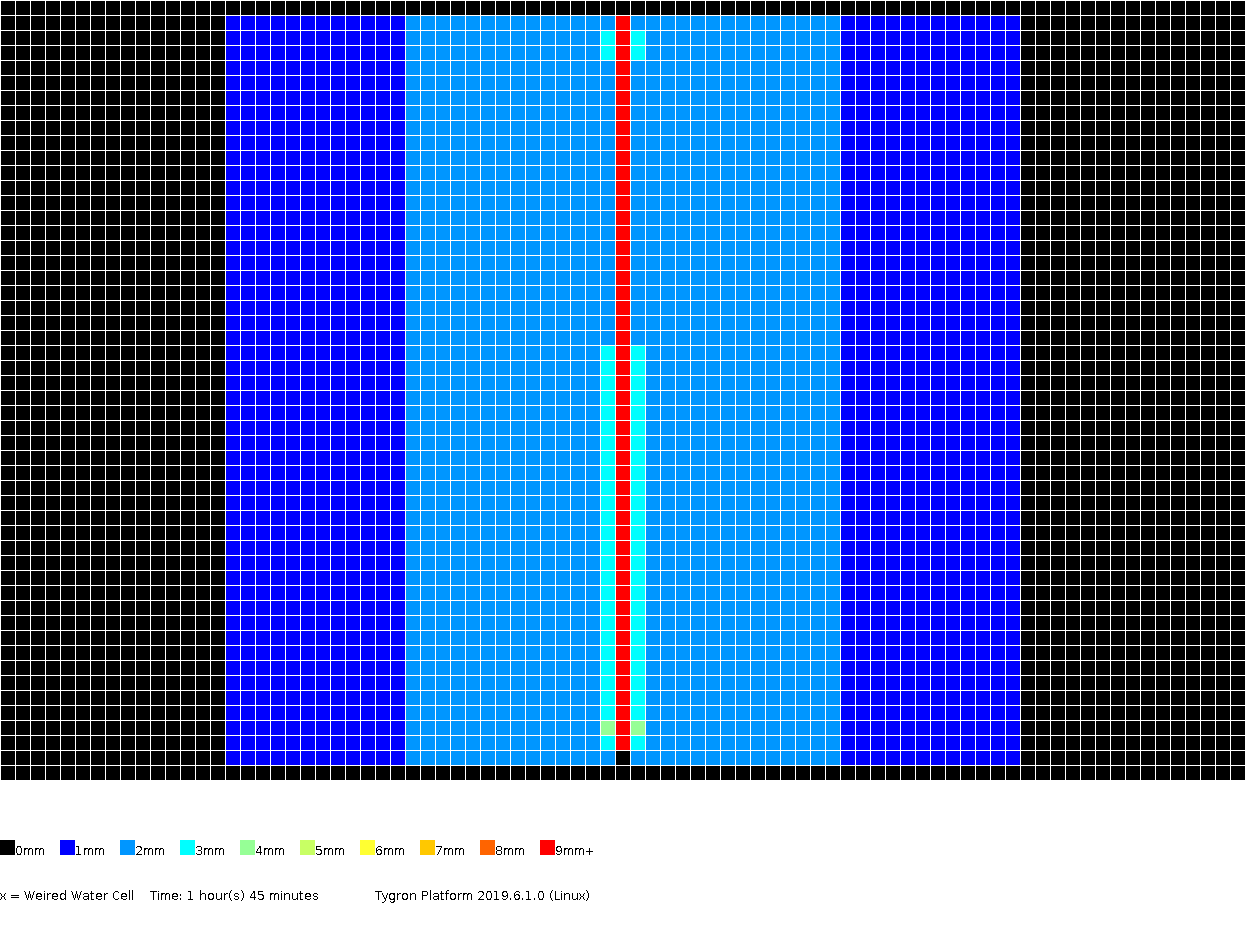 1h45m
1h45m -
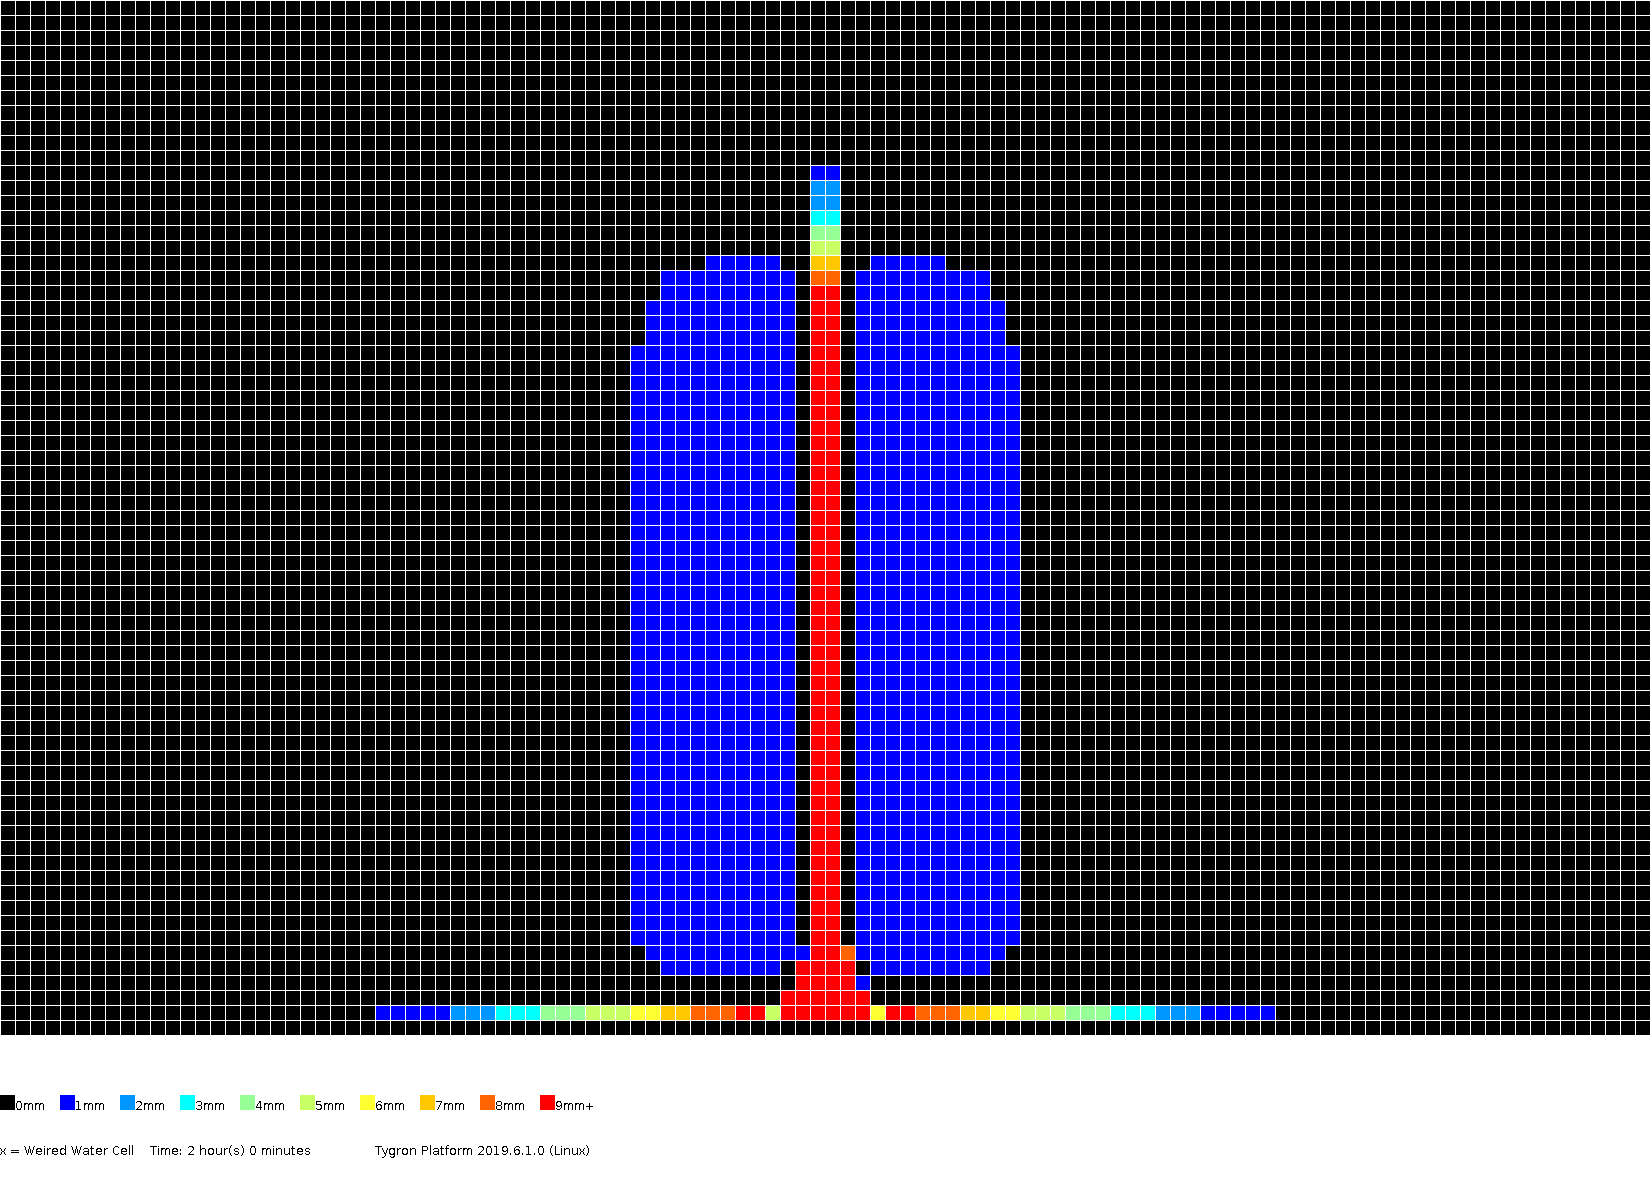
 2h00m
2h00m -
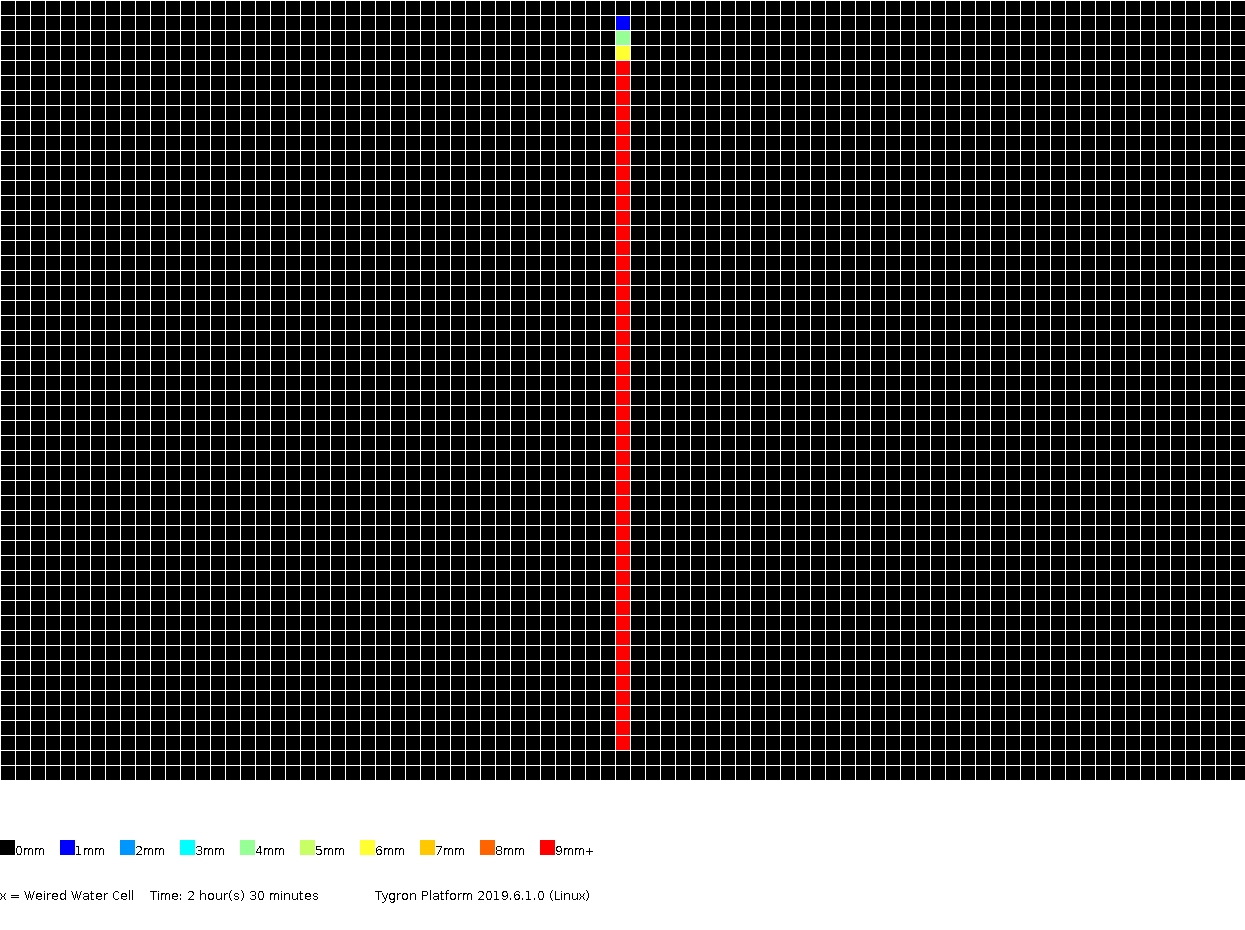 2h30m
2h30m -
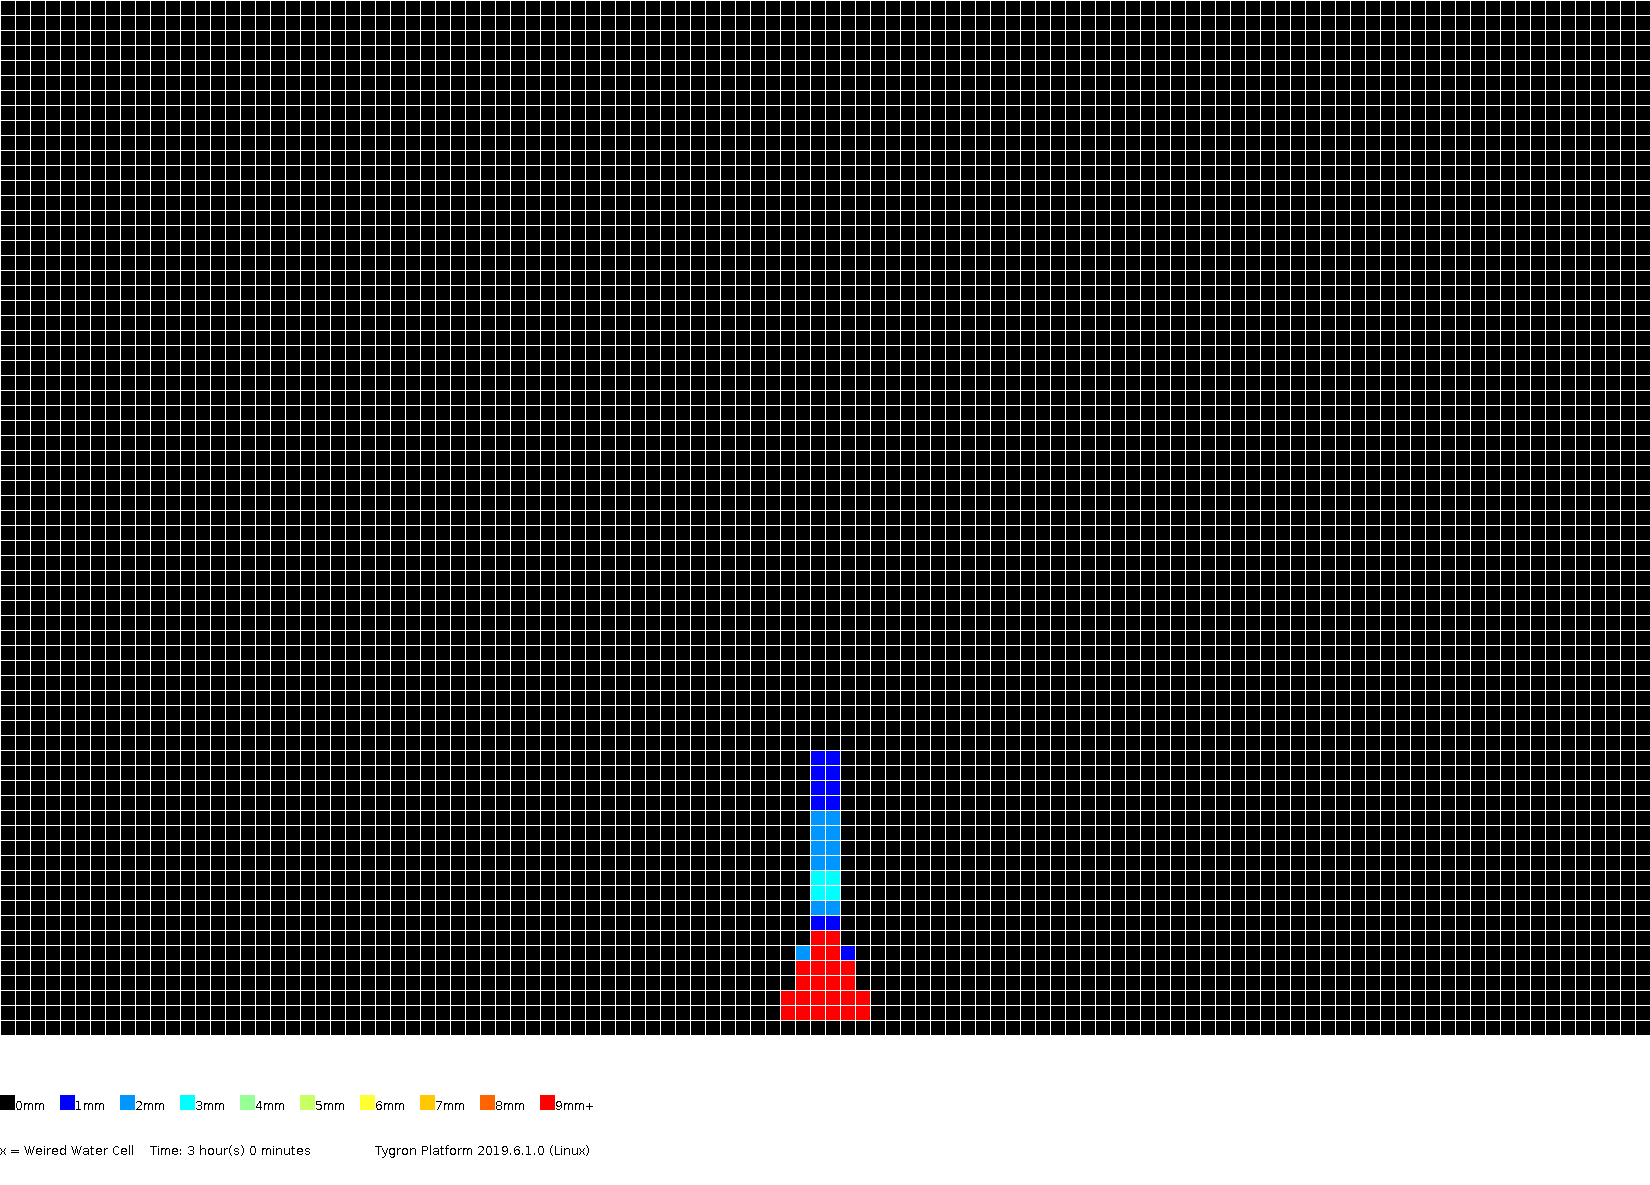
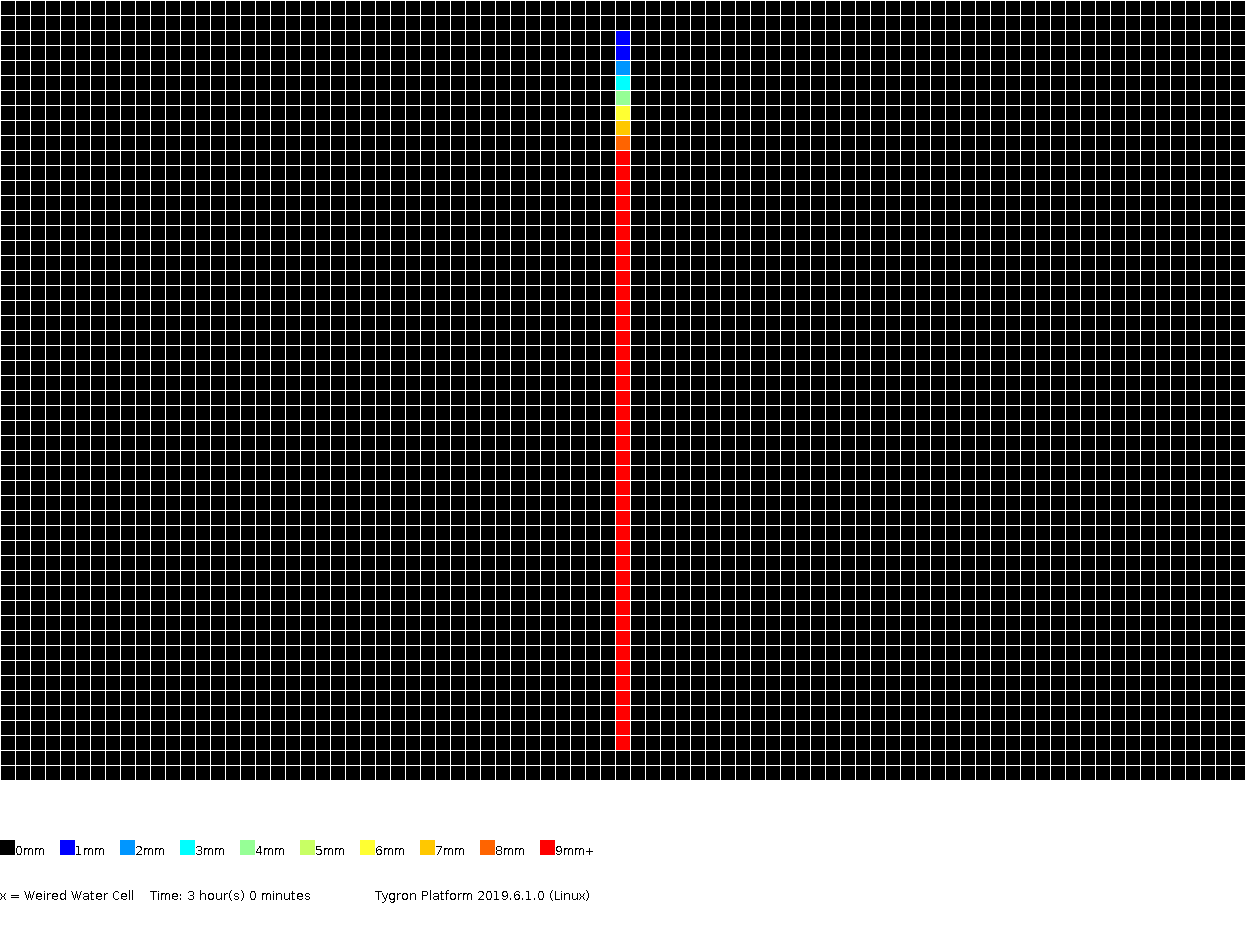 3h00m
3h00m


Test case 3
This test case adds a slope in the y-direction as well. Due to this extra slope, the flow directions will not be perpendicular anymore to the sides of the grid cells. Instead, the flow direction will vary per grid cell and this is what this test case will validate.


Setup
The lay-out of the terrain has a slanted V-shape. In the middle is a ditch, which is horizontal in the x-direction but slanted downwards in the y-direction. The terrain around the ditch is slanted downwards in the x-direction with a value of 0.05. In the y-direction is is slanted similar to the ditch, with a value of 0.02. For the exact measurements see figure 5.9 above. A graphical impression of the height map in this testcase is given below. Again first the original height map and next the height map adjusted for ensuring a constant slope per grid cell x- and y-direction.
Initial 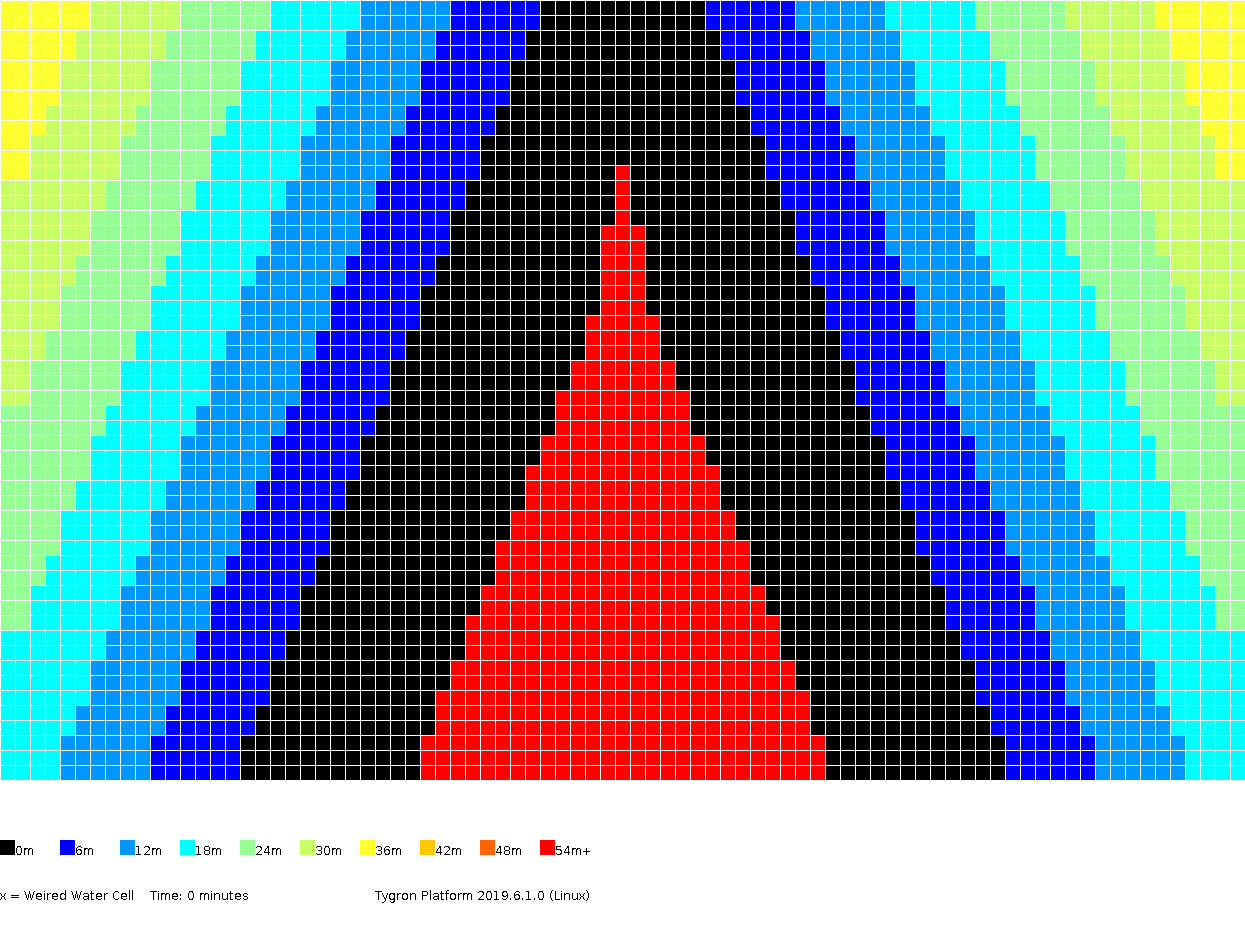
After slope adjustments


Results
The hydrograph and volumes.
-
 hydrograph
 -
 volumes


The amount of surface water (in meters), color coded per grid cell, presented for several timeframes.
-
 0h30m
0h30m -
 1h00m
1h00m -
 1h30m
1h30m -
 1h45m
1h45m -
 2h00m
2h00m -
 2h30m
2h30m -
 3h00m
3h00m


Test case 4
This testcase contains a ponding problem. This testcase is subdivided into 3 sub-testcases in order to investigate several aspects of this ponder problem. Each is described below. See image 5.11 for the layout of the problem. Each of the surfaces in this test case have a Manning roughness value of 0.05. A weir is situated at the bottom of the sloped terrain, causing the creation of a pond during the simulation.

Setup
For each test case the base setup is the same. A graphical impression of the height map in this testcase is given below. Again first the original height map and next the height map adjusted for ensuring a constant slope per grid cell x- and y-direction.
Initial 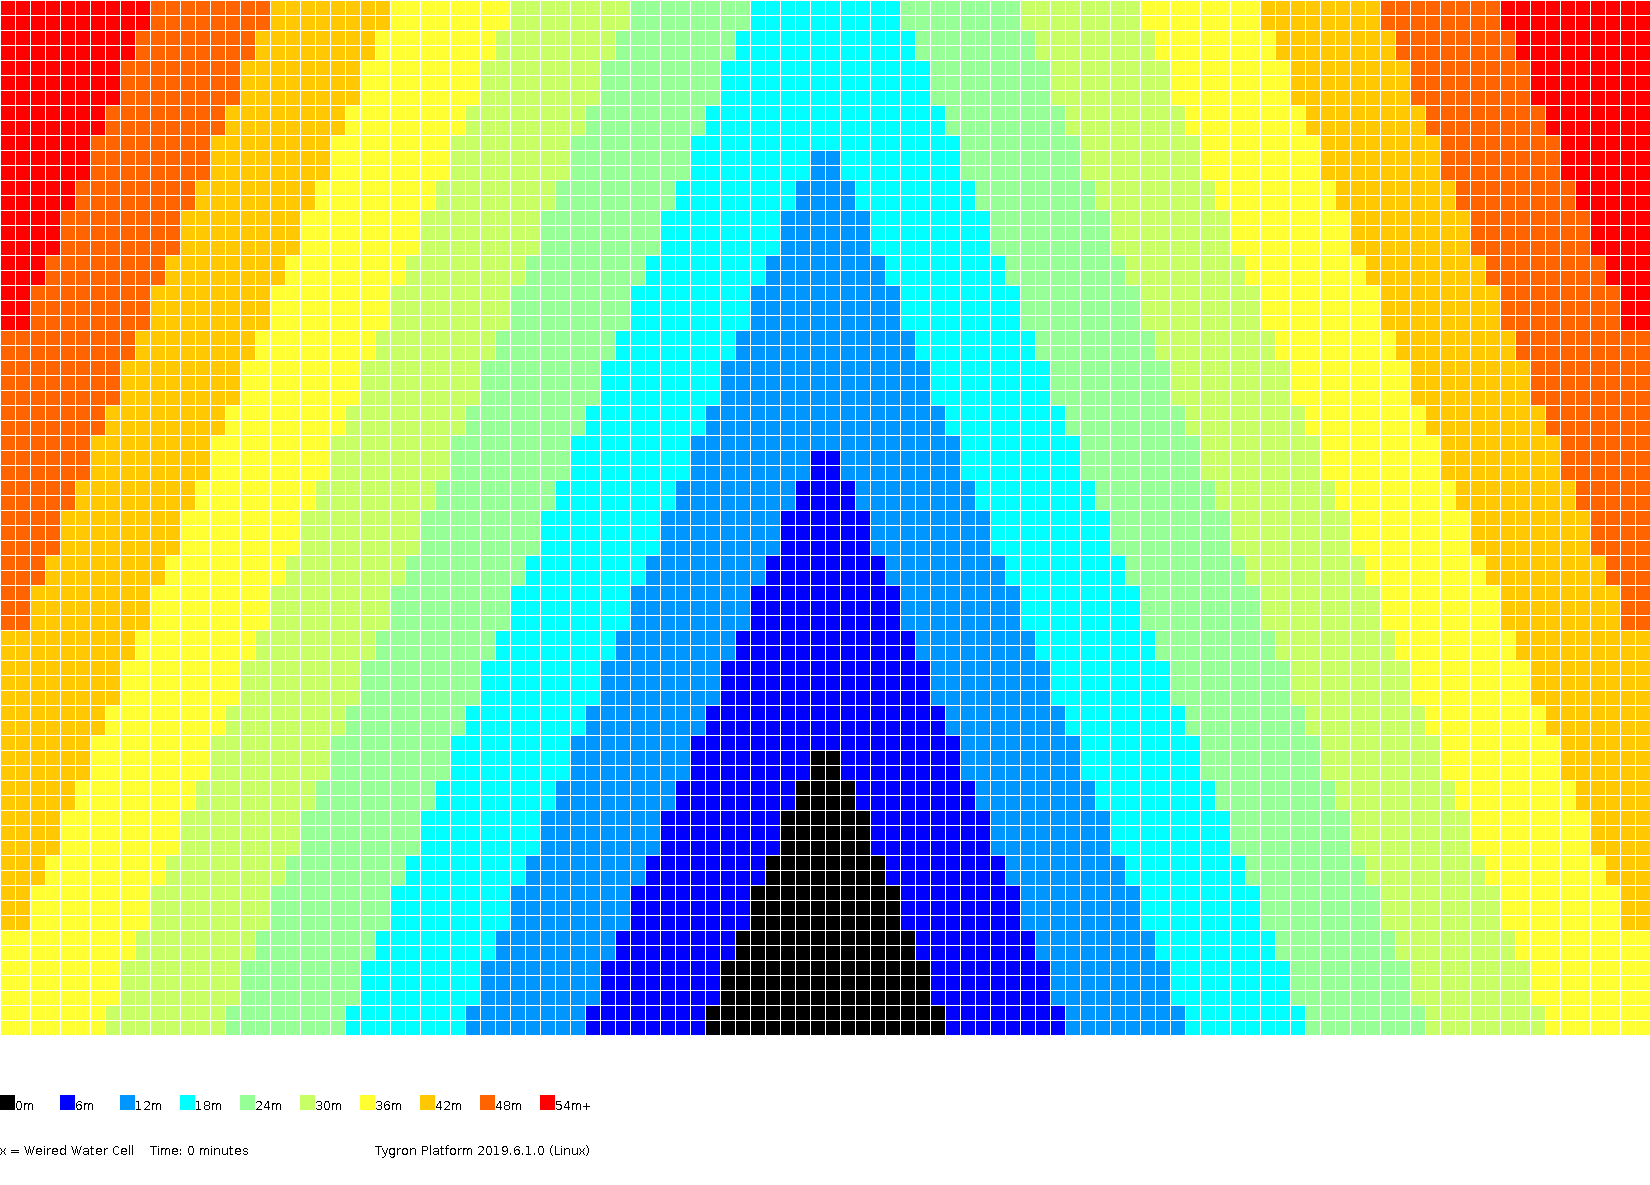
After slope adjustments


Test case 4A
In this testcase, the amount of rainfall is similar to testcase 3. However, it continues to rain until the end of the simulation. The surface and underground are impenetrable. And the weir is considered to be 'perfect'.

Results
The hydrograph and volumes.
-
 hydrograph
 -
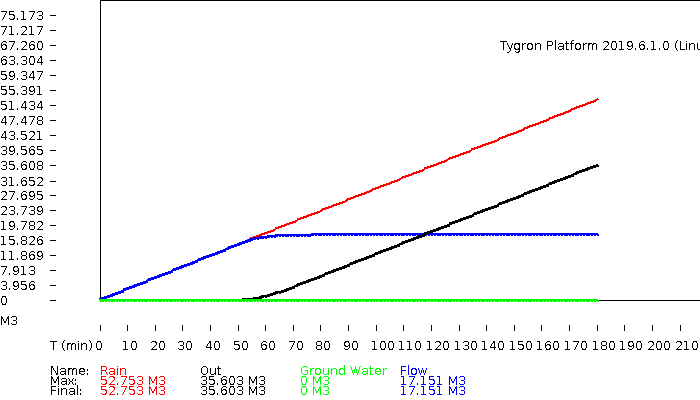 volumes


The amount of surface water (in meters), color coded per grid cell, presented for several timeframes.
-
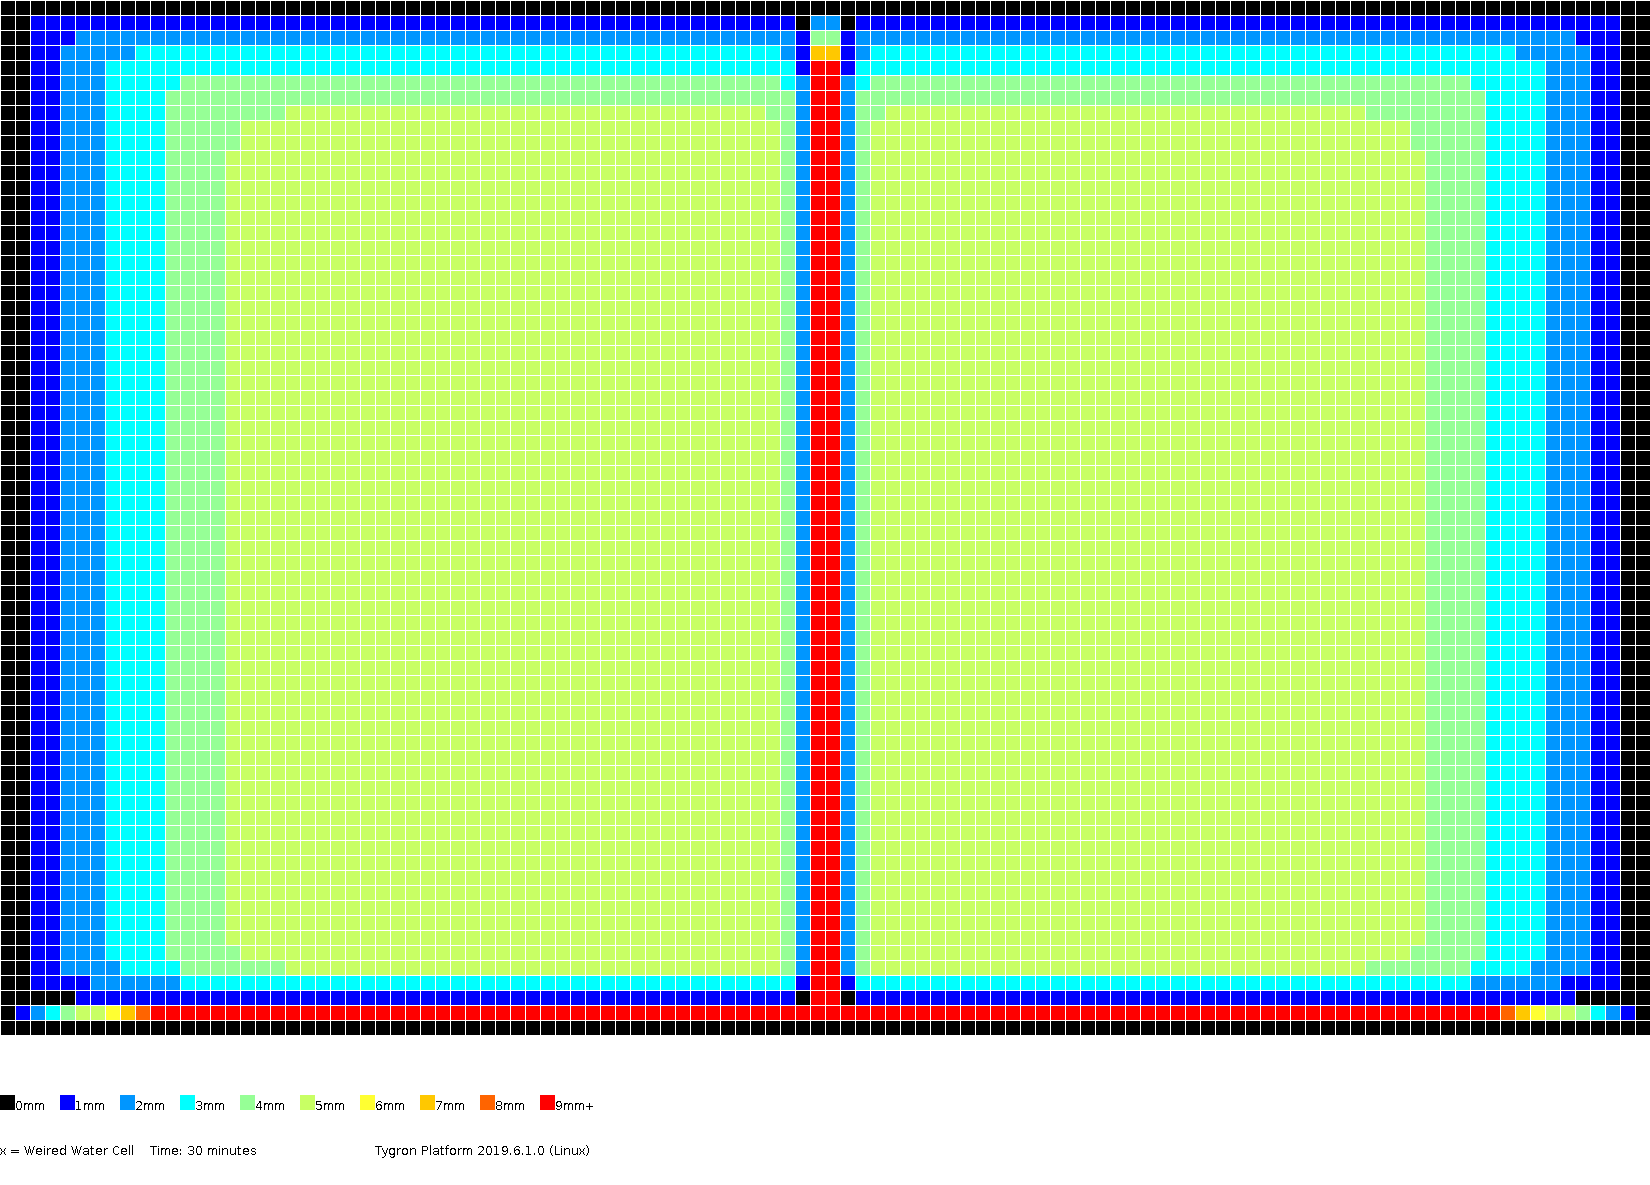 0h30m
0h30m -
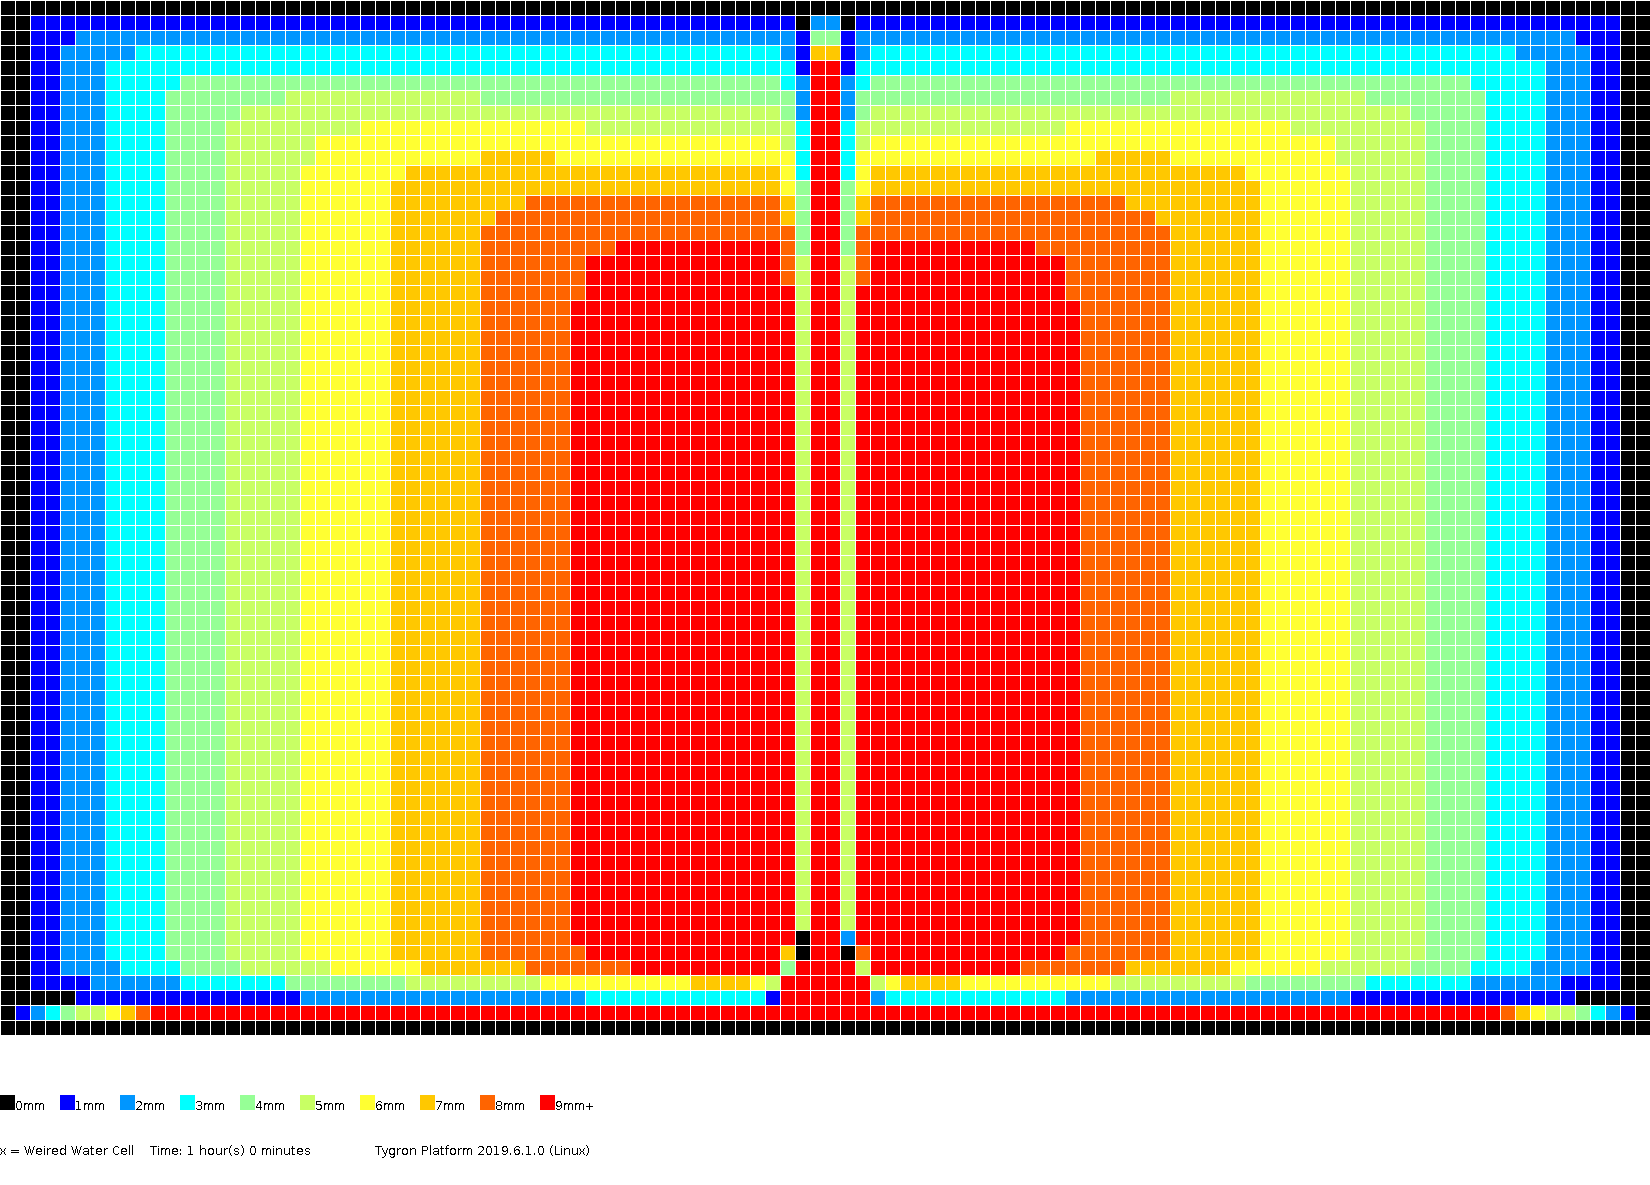 1h00m
1h00m -
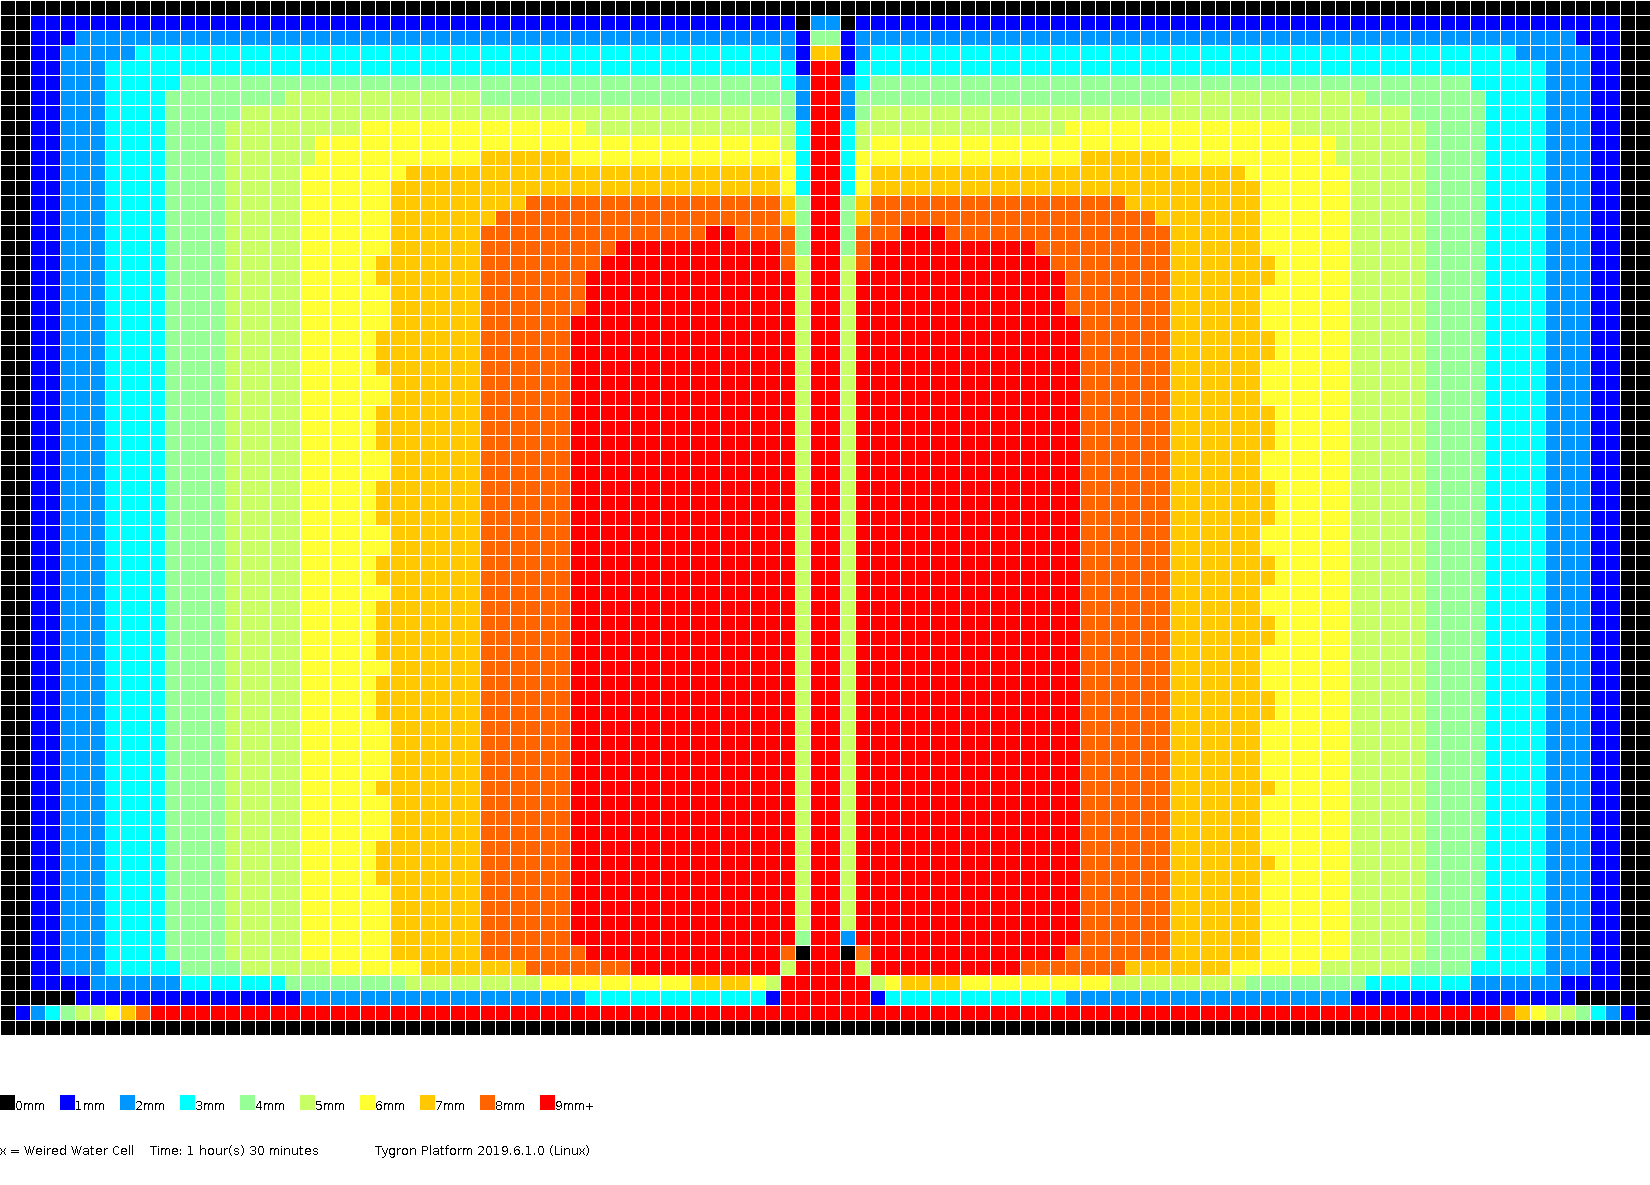 1h30m
1h30m -
 1h45m
1h45m -
 2h00m
2h00m -
 2h30m
2h30m -
 3h00m
3h00m


Test case 4B
In this testcase the amount of rainfall is 21.6 mm per hour and lasts for 90 minutes. The underground has an infiltration capacity of 10.8 mm per hour. The simulation runs until the water level has lowered to about +/- 2cm below the crest of the weir. The effects of the groundwater table can be ignored.

Results
The hydrograph and volumes.
-
 hydrograph
 -
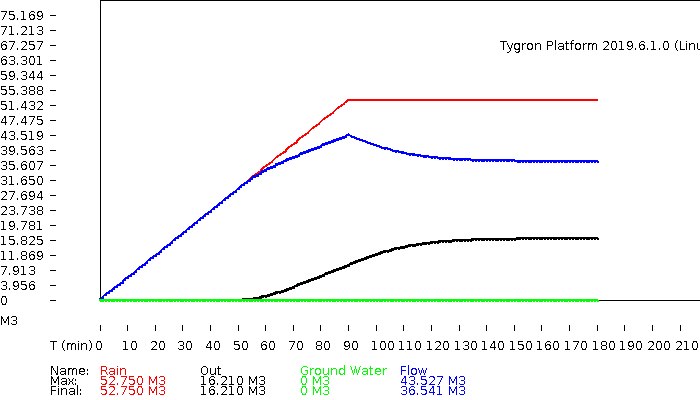 volumes


The amount of surface water (in meters), color coded per grid cell, presented for several timeframes.
-
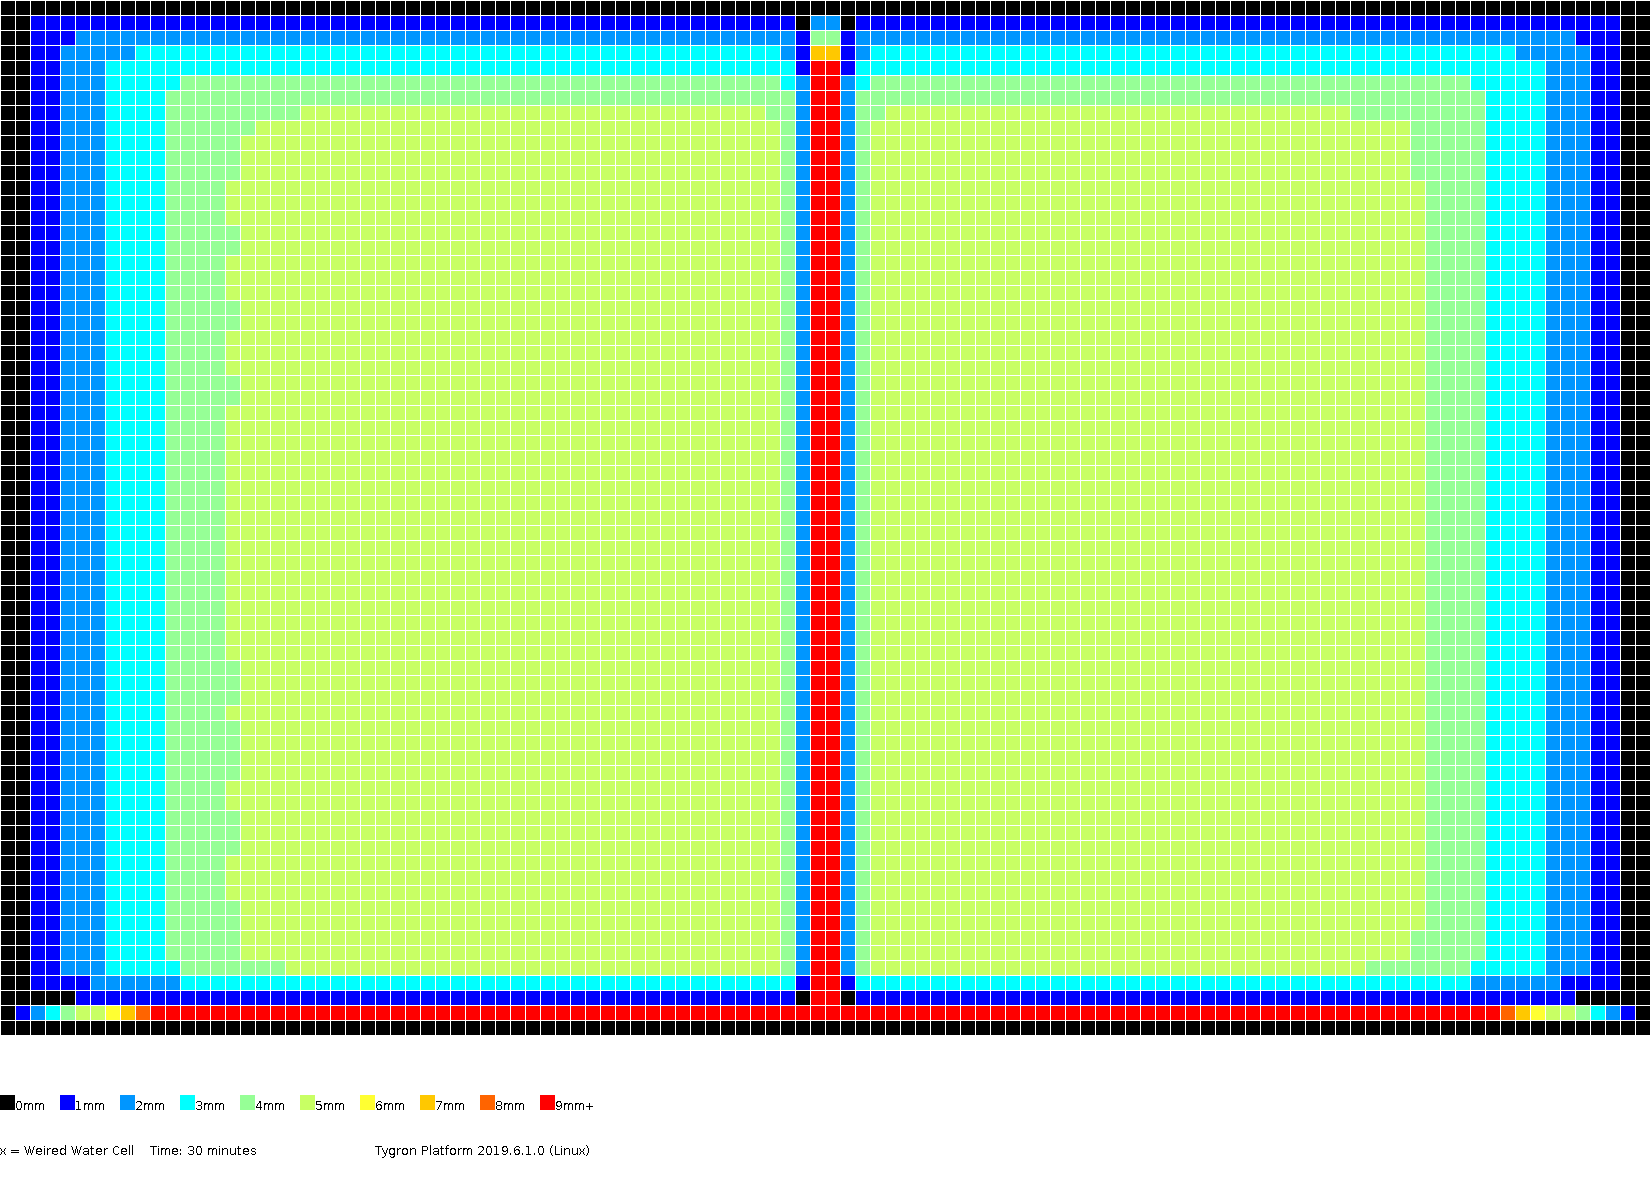 0h30m
0h30m -
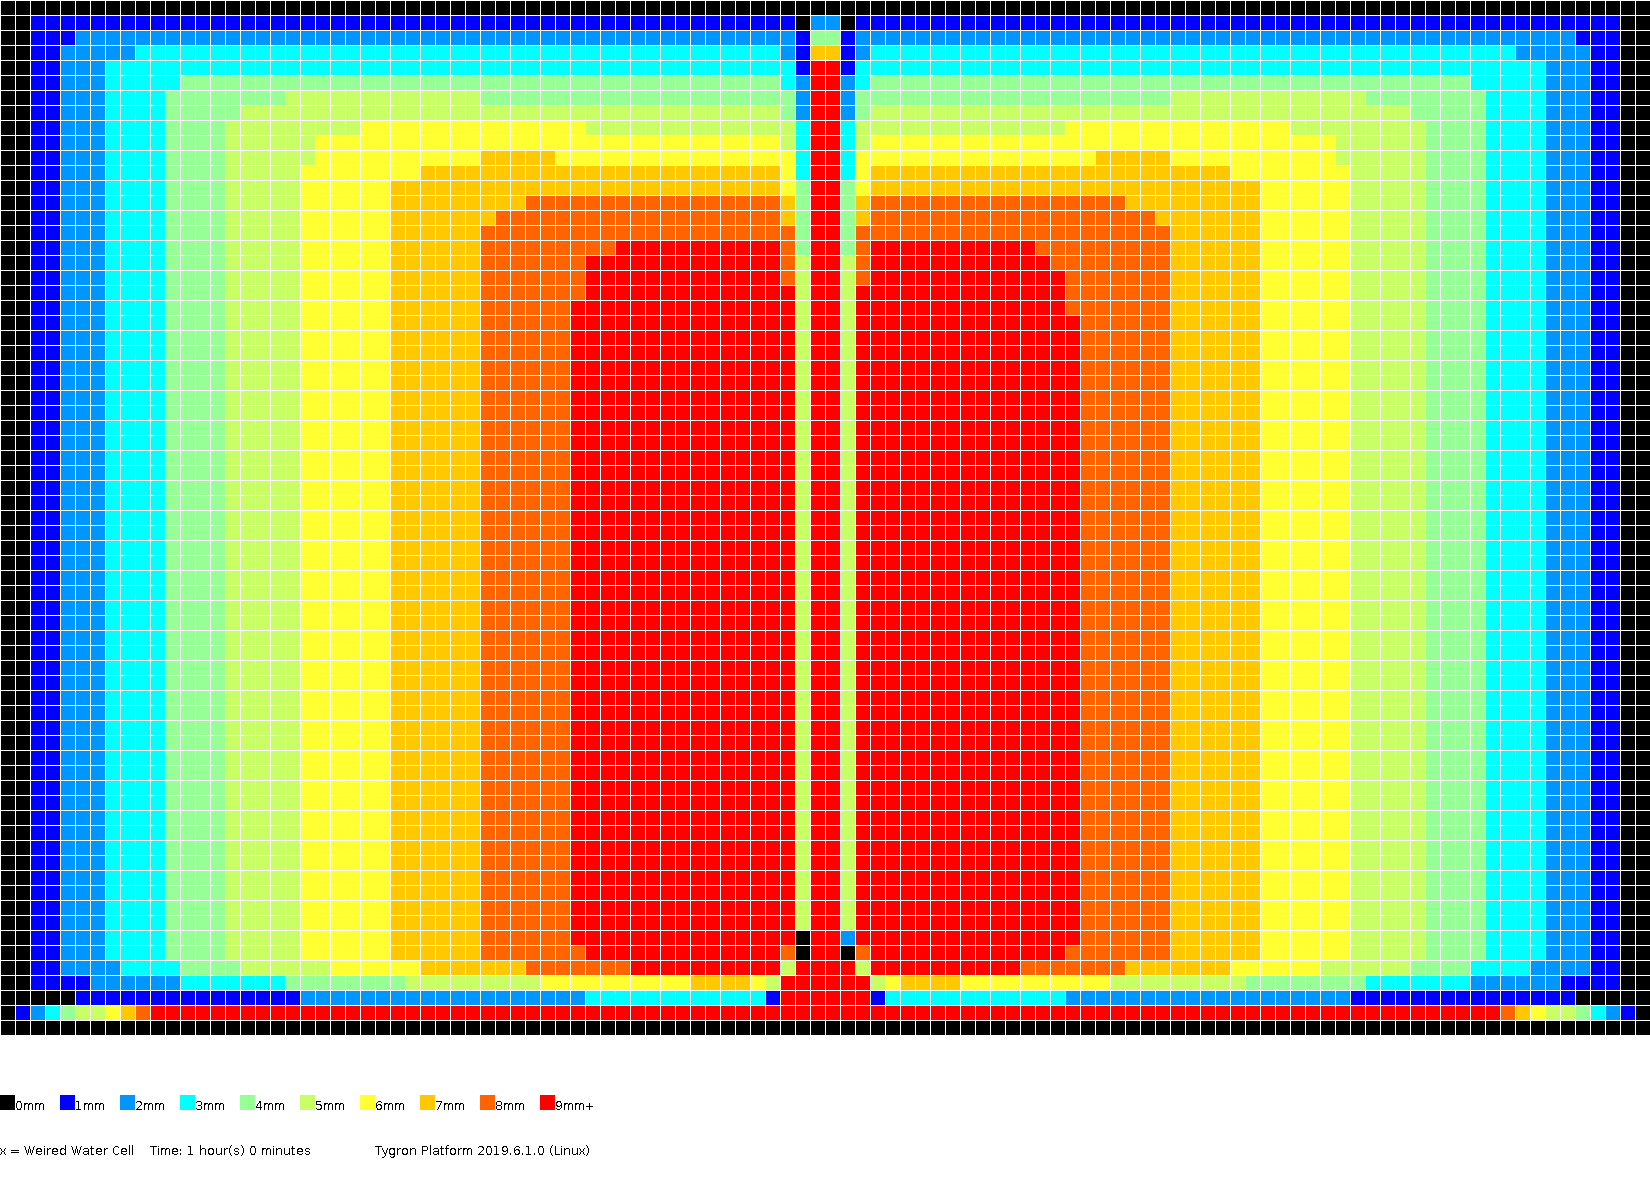 1h00m
1h00m -
 1h30m
1h30m -
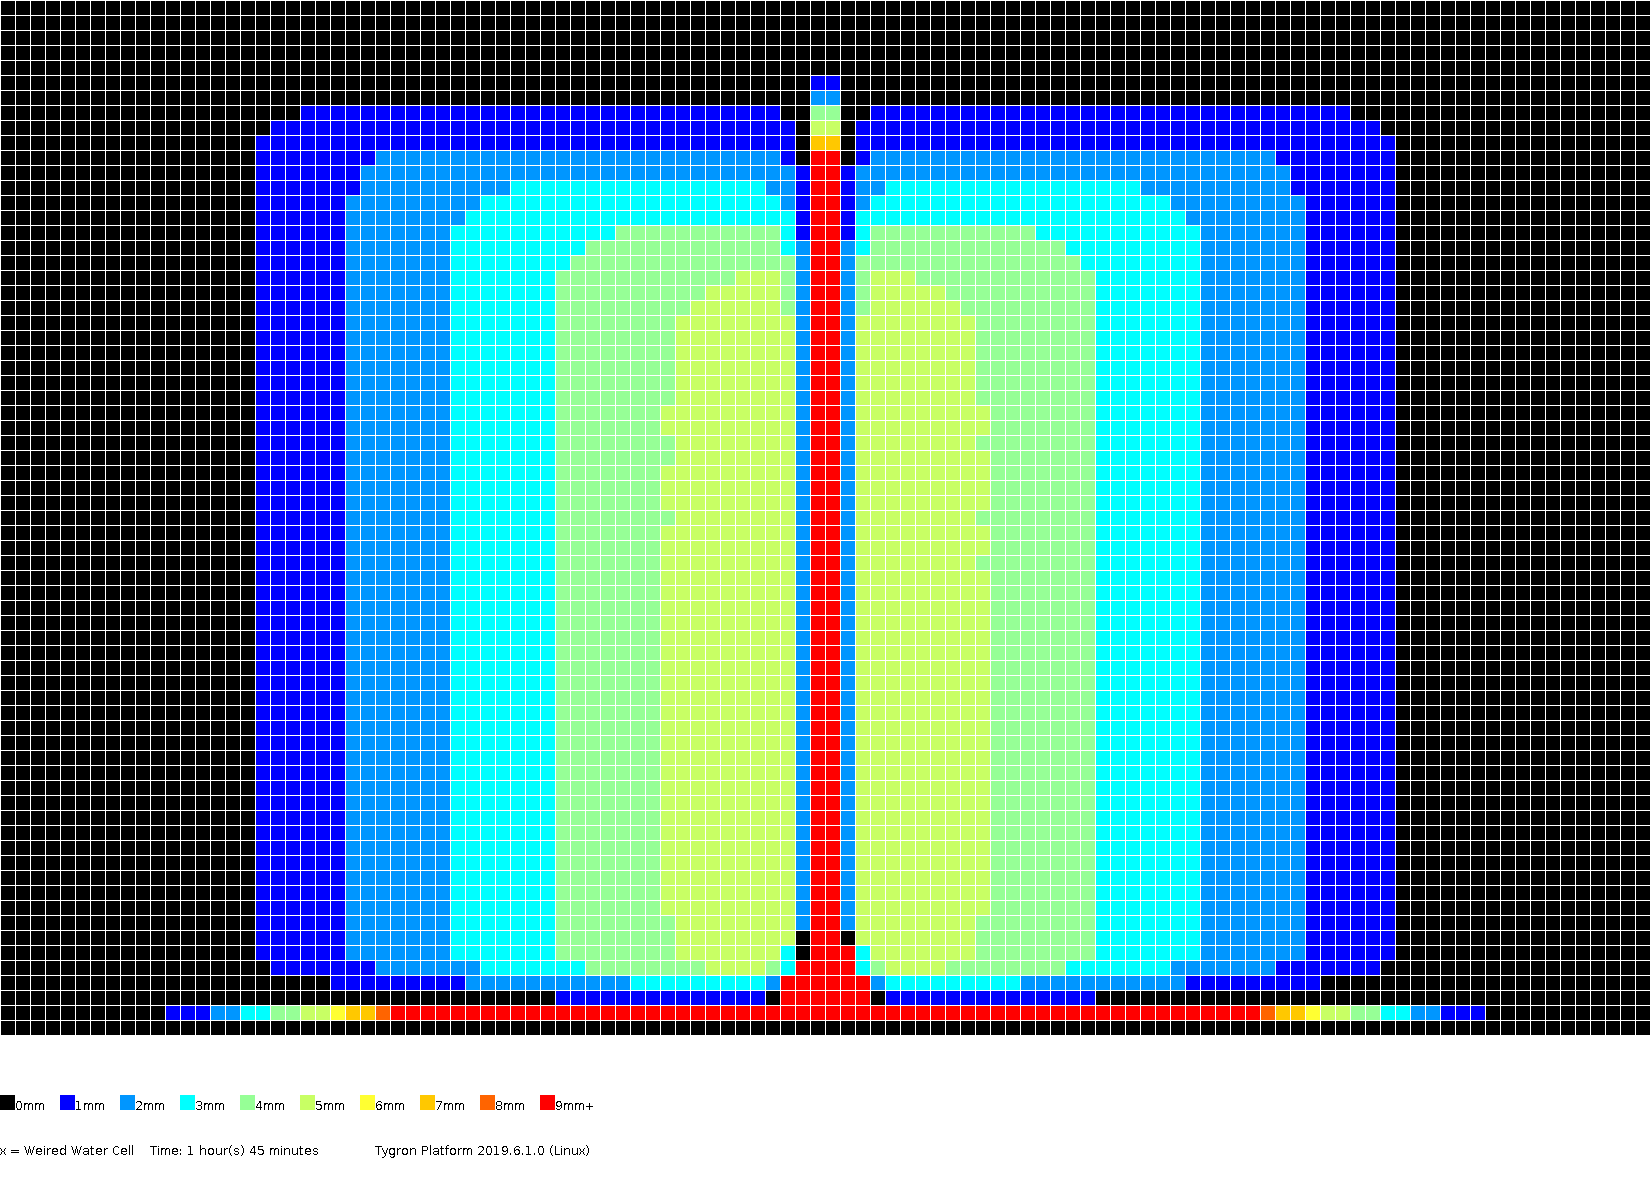 1h45m
1h45m -
 2h00m
2h00m -
 2h30m
2h30m -
 3h00m
3h00m


Test case 4C
In this testcase, the amount of rainfall and the infiltration capacity are equal to testcase 4B. The porosity of the soil is now set to 0.25. The impenetrable layer is strictly horizontal and 10 meters below the lowest surface height. The groundwatertable at t=0 is horizontal, 50 cm below the height of the weir. The initial surface water level is equal to the initial groundwatertable. The hydraulic condictivity is 5x10⁻⁵ for water infiltration from the surface to the underground. The simulation time is equal to testcase 4B.

Results
The hydrograph and volumes.
-
 hydrograph
 -
 volumes


The amount of surface water (in meters), color coded per grid cell, presented for several timeframes.
-
 0h30m
0h30m -
 1h00m
1h00m -
 1h30m
1h30m -
 1h45m
1h45m -
 2h00m
2h00m -
 2h30m
2h30m -
 3h00m
3h00m


Test case 5 to 7
Currently not implemented.


