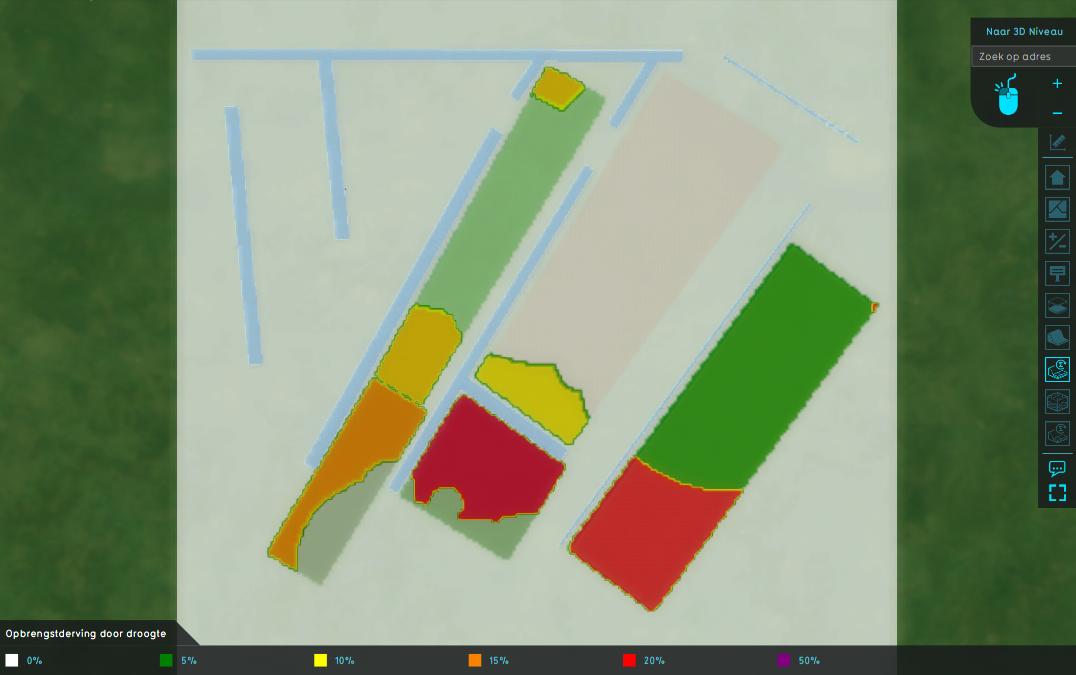
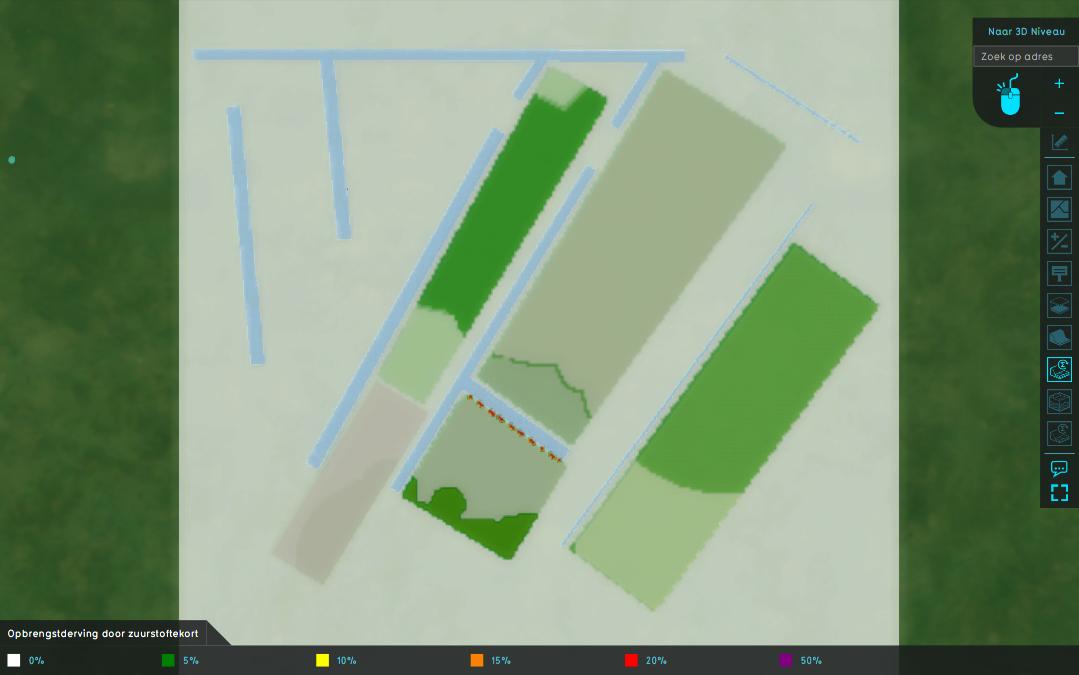
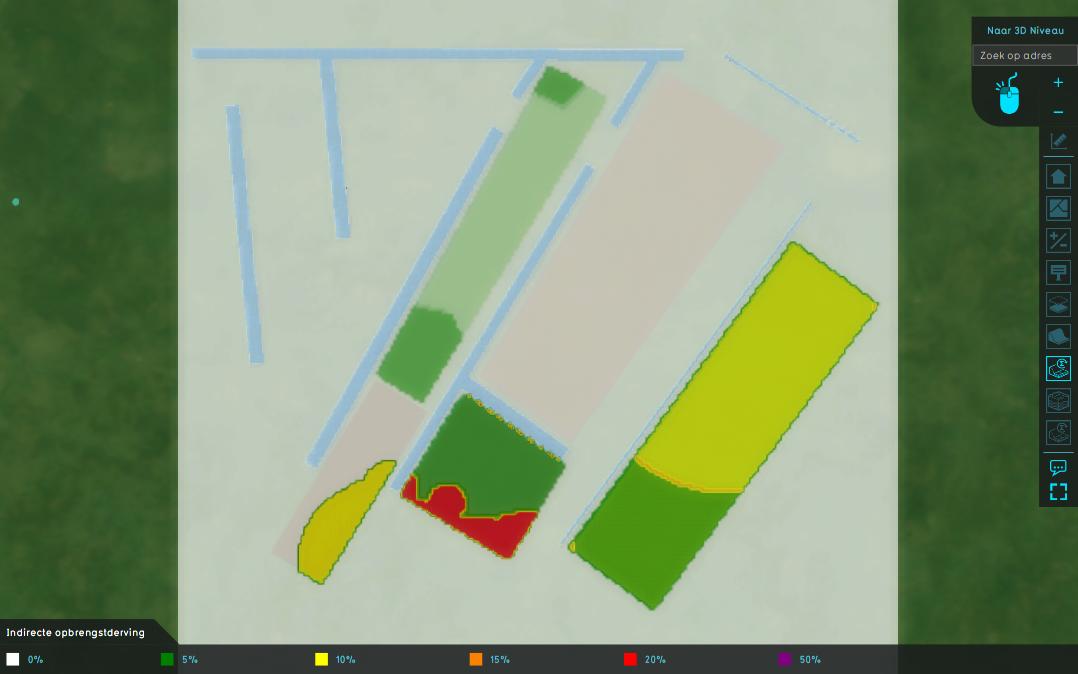
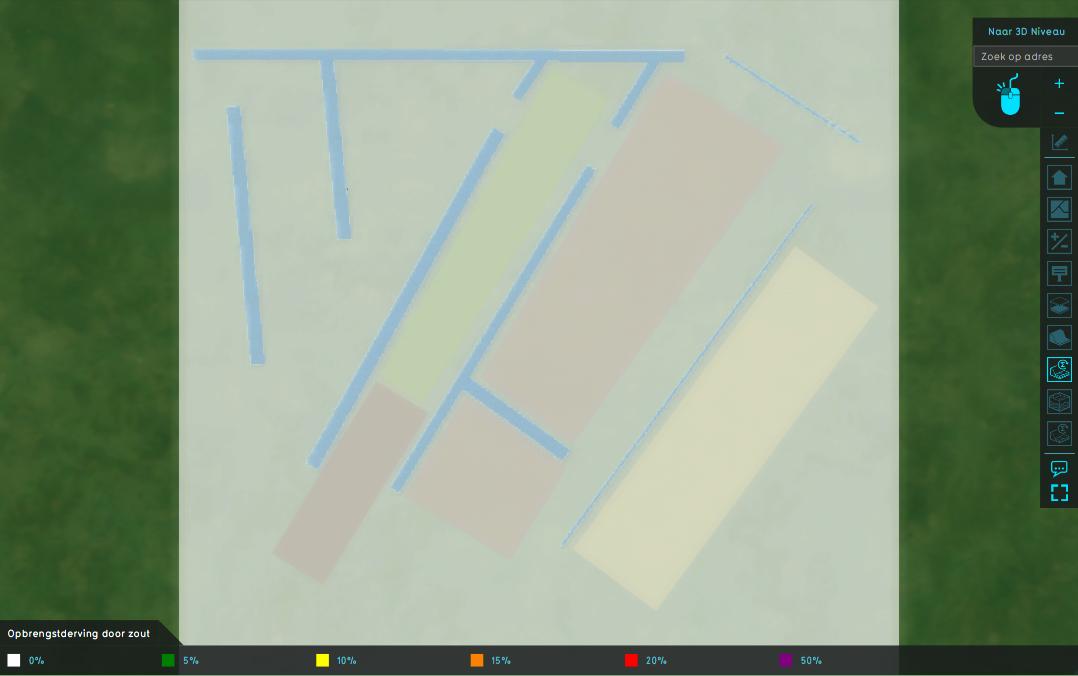
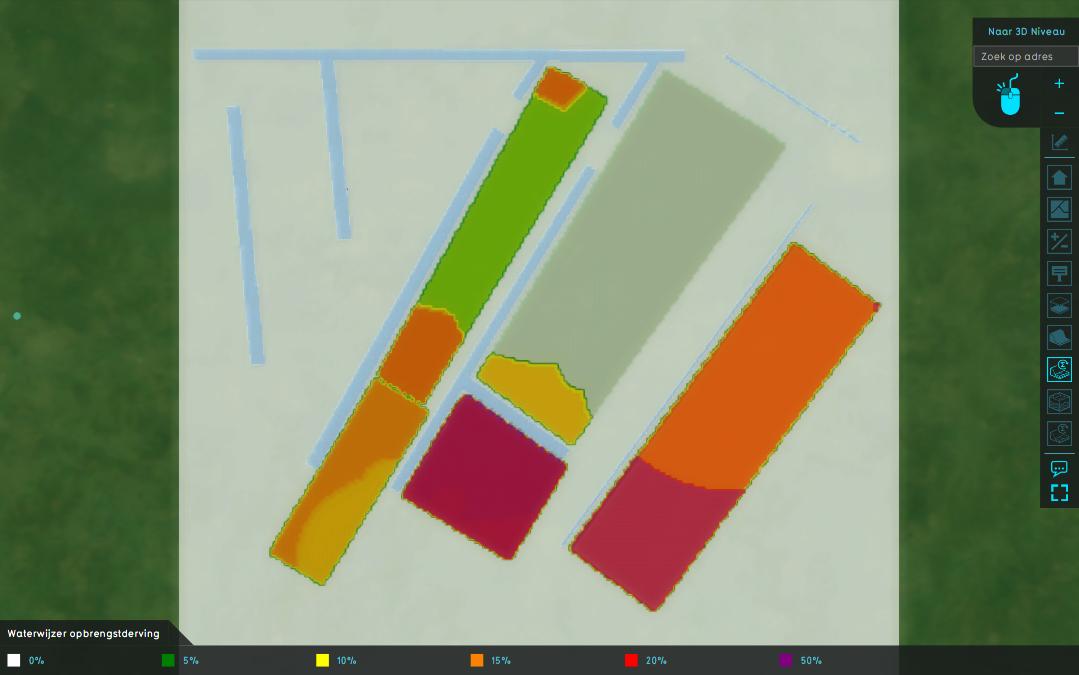
Waterwijzer Module overview
The Waterwijzer Overlay communicates with the Waterwijzer API to calculate the yield loss for agriculture crops.
Concept
- User generates a project for an area in the Netherlands using the Tygron Platform.
- The Dutch BRP geo-plugin retrieves the known agriculture plots. Each agriculture plot has an identification number for the type of plot, which is stored in the BRP_CODE attribute.
- The Dutch BRO geo-plugin retrieves the known soil types, stored as underground terrain. The simplified BOFEK_ID is configured by default for each terrain type of these terrain.
- User adds a Waterwijzer Overlay and configures:
- The climate scenario and weather station are configured using the Waterwijzer Overlay Wizard
- The groundwater levels can also be configured using the Waterwijzer Overlay Wizard. These ground water levels can be provided as:
- A GeoTIFF containing groundwater depths;
- A result type of the Subsidence Overlay; See high and low ground water depths.
- A result type of the Groundwater Overlay; See last ground water depth and max depth
- User triggers the calculation of the overlay. The Waterwijzer Module sends the data to Waterwijzer API and receives data on yield losses.
- The Waterwijzer module then stores the grid data under following result type overlays, categorized as:
Calculation
The Waterwijzer Overlay is a Grid Overlay. The project area is rasterized into grid cells, each containing a value for:
- the type of crop, identified by their BRP Code.
- the soil: BOFEK_ID
- the lowest (average) groundwater depth: distance to surface, from GeoTIFF or result overlay.
- the highest (average) groundwater depth: distance of surface, from GeoTIFF or result overlay.
The climate scenario and weather station are a defined for the overlay and therefore the same for each grid cell.
Each unique combination of crop, soil, groundwater depths, climate scenario and weather station leads to four yield loss values, one for each category, which were described above. To make it more efficient, we send each combination only once. The groundwater levels have the most variance. However, the Waterwijzer API interprets the groundwater levels with a precision of 0.1 meter.
Once the yield loss has been sent back for each combination, we process all grid cells and store it's yield loss, depending on the result types configured for the Waterwijzer Overlay.
Notes
- Currently we round the groundwater values to the nearest value based on the 0.1 meter precision. However, in the near future we will replace this with bi-linear interpolation between the 4 combinations of floored and ceiled groundwater levels, which is similar to the calculation done by the Waterwijzer's standalone application.
