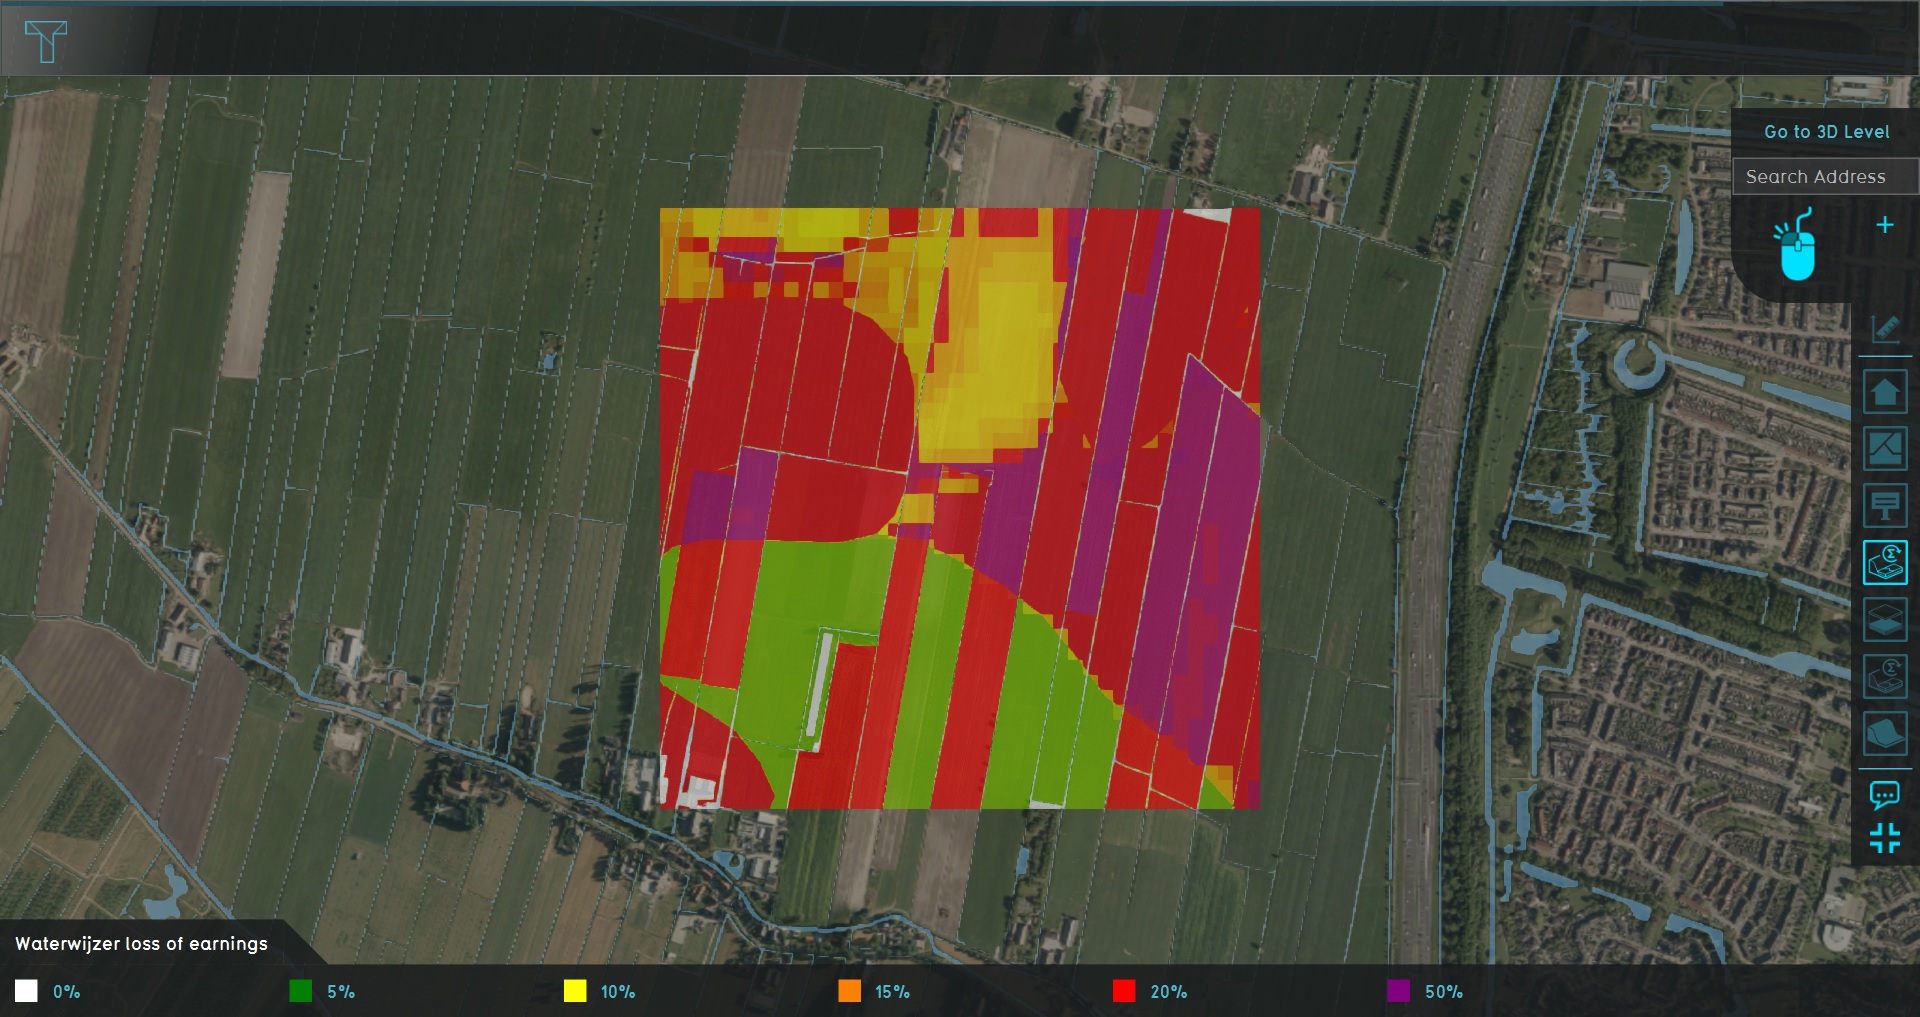
Demo Ww Agriculture Project

The Demo Ww Agriculture project is available for all users and can be found in the main menu under Edit projects. This project does not count towards your license.
This project is intended for waterboards, urban planners in rural environments, and agricultural engineers.
This project showcases the results of the Waterwijzer's calculations spatially, through the connection with their API.
The demo is a project in which a location in The Netherlands used for agriculture, and with a variation of underground Terrain Types and groundwater levels. The Waterwijzer Overlay provides insight into how to what degree earnings are lost as a result of hydrological conditions in the soil and subsoil.
Exploring the project
To begin exploring the project, take the following steps:
- Click anywhere in the 3D world, and use the arrow keys on your keyboard to move around in the world. You can also drag the camera around by right-clicking (and holding the right mouse button down) in the 3D world and dragging the world around. Use the scroll wheel to zoom in- and out.
- On the right-hand side of the session interface you can see the overlays menu. Hover over the various icons to see a tooltip with their name. Find the Overlay named "Waterwijzer loss of earnings", and click on it. This will show the Overlay in the 3D World. This Overlay shows the loss of earnings as a result of hydrological conditions.
- At the bottom of the interface a legend will now appear. The legend relates the meaning of the various colors in the 3D World to the specific underlying values.
- Hover over the icon for the Overlay again, and notice that more options appear for Overlays related to the same calculation. These are the child overlays, which can display more specific types of results from the Waterwijzer calculation.
- Finally, notice a number of icons floating in the world. The orange icons denote points-of-interest which you can take a closer look at. You can click on any to open a panel with more information.