Aerius Module overview: Difference between revisions
Jump to navigation
Jump to search
No edit summary |
|||
| (31 intermediate revisions by 5 users not shown) | |||
| Line 1: | Line 1: | ||
{{unavailable}} | |||
==Overview== | ==Overview== | ||
The RIVM [https://www.aerius.nl/nl Aerius] calculation tool calculates the impact of various emission sources on nitrogen deposition on Natura 2000 areas in the Netherlands. | |||
<br> | |||
The general concept is: <br> | |||
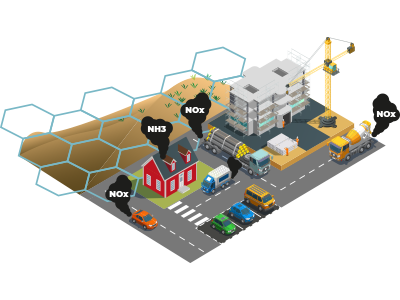
# Various sources, such as traffic and industry, emit NOx and NH3 into the air. The NOx and NH3 in the air eventually ends up on the ground, which is called nitrogen deposition. Nitrogen deposition is especially bad for the plants in nature reserves (Natura 2000 areas). For more information, see this [https://www.rivm.nl/stikstof page of the RIVM](in Dutch). | |||
# These sources of emissions are categorized by the Aerius Calculator into different (specific) sectors. | |||
# Aerius calculate for these different sectors the corresponding emissions and the amount of nitrogen deposition on Natura 2000 areas. | |||
[[File:aerius_introduction.png]] | [[File:aerius_introduction.png]] | ||
==Supported Sectors== | |||
The Aerius Calculator tool can calculate emissions for various sectors. | |||
Currently supported sectors in the {{software}} are: | |||
* Traffic (''Wegverkeer''): | |||
** Sector 3113: local roads (''Binnen bebouwde kom'') | |||
** Sector 3112: rural roads (''Buitenwegen'') | |||
** Sector 3111: highways (''Snelwegen'') | |||
* Mobile machines (''Mobiele werktuigen''): | |||
** Sector 3220: Construction and industrial machines (''Bouw en industrie'') | |||
* Plan (''Plan''): | |||
** All categories (''Alle categorieën'') | |||
* Work and living (''Wonen en werken''): | |||
** 8640: Work (''Kantoren en winkels'') | |||
** 8200: Living (''Woningen'') | |||
** 8210: Recreation (''Recreatie'') | |||
==Input== | ==Input== | ||
* Traffic intensities for [[Light_traffic_num_(Aerius Overlay)|light]], [[Medium_traffic_num_(Aerius Overlay)|medium]] and [[Heavy_traffic_num_(Aerius Overlay)|heavy traffic]]. Optionally also [[Bus_traffic_num_(Aerius Overlay)|bus traffic]] | The input needed to make a calculation and visualize the results in the [[Aerius Overlay]], depends on the use case and the available data. Below an overview of the different datasets that can serve as input: | ||
* [[Traffic sector (Aerius Overlay)|Traffic sector]] the road belongs to | * Traffic intensities for [[Light_traffic_num_(Aerius Overlay)|light]], [[Medium_traffic_num_(Aerius Overlay)|medium]] and [[Heavy_traffic_num_(Aerius Overlay)|heavy traffic]] per 24 hours. Optionally also [[Bus_traffic_num_(Aerius Overlay)|bus traffic]] and the [[Light_traffic_percentage_(Aerius Overlay)|congestion]] percentages. | ||
* The [[Traffic sector (Aerius Overlay)|Traffic sector]] the road belongs to (type of road, for example a highway). See the different [[Aerius_module_overview#Supported_sectors|types]]. | |||
* [[ | * [[Machine_fuel_usage_(Aerius Overlay)|Fuel usage]] in liter per year of construction machines, specified per [[Machine_category_index_(Aerius_Overlay)#Construction machine categories|construction machine category]]. | ||
* NOX and NH3 emissions for the [[Nox_work_(Aerius_Overlay)|work]], [[Nox_living_(Aerius Overlay)|living]] and [[Nox_living_(Aerius Overlay)|recreation]] sectors. | * NOX and NH3 emissions for the [[Nox_work_(Aerius_Overlay)|work]], [[Nox_living_(Aerius Overlay)|living]] and [[Nox_living_(Aerius Overlay)|recreation]] sectors. | ||
* [[Calculation year (Aerius Overlay)|Calculation year]], a value between 2014 and 2030. | * [[Calculation year (Aerius Overlay)|Calculation year]], a value between 2014 and 2030. | ||
==Output== | ==Output== | ||
* Emissions per building. | * Emissions per [[building]]. The emissions are added as attributes to the [[building]] with the [[Nox_(Aerius_Overlay)|NOX]] and [[Nh3_(Aerius_Overlay)|NH3]] attributes. If the building is a road, the traffic emissions are shown. Otherwise, the emissions for plan, work and living and mobile machines are summed and shown here. | ||
* | * Two result types ([[Grid_Overlay|grid overlays]]) showing the NOX or NH3 deposition in Natura 2000 areas as hexagon areas. | ||
* An array of hexagon | * An array of NOx or NH3 values in mol/hectare/year per hexagon area stored in the Aerius Overlay under the [[Nox_overlay_attribute_(Aerius_Overlay)|NOX]] and [[Nh3_overlay_attribute_(Aerius_Overlay)|NH3]] keys. | ||
* The Aerius results, including the entered values per emission source, can be [[How_to_download_Aerius_results|downloaded]] as a GML file. This file can be uploaded in the [[https://calculator.aerius.nl/calculator/?locale=nl# Aerius Calculator]]. | |||
==Result Types== | ==Result Types== | ||
The [[Aerius Overlay]] shows the following result types: | |||
* [[NOX result type (Aerius Overlay)|NOX]] | * [[NOX result type (Aerius Overlay)|NOX]] | ||
* [[NH3 result type (Aerius Overlay)|NH3]] | * [[NH3 result type (Aerius Overlay)|NH3]] | ||
| Line 24: | Line 48: | ||
</ul> | </ul> | ||
== | ==How-to's== | ||
* [[How to download Aerius results]] | |||
{{Template:Aerius Module buttons}} | {{Template:Aerius Module buttons}} | ||
Latest revision as of 13:55, 3 November 2023
This functionality is currently unavailable or non-functional.
Overview
The RIVM Aerius calculation tool calculates the impact of various emission sources on nitrogen deposition on Natura 2000 areas in the Netherlands.
The general concept is:
- Various sources, such as traffic and industry, emit NOx and NH3 into the air. The NOx and NH3 in the air eventually ends up on the ground, which is called nitrogen deposition. Nitrogen deposition is especially bad for the plants in nature reserves (Natura 2000 areas). For more information, see this page of the RIVM(in Dutch).
- These sources of emissions are categorized by the Aerius Calculator into different (specific) sectors.
- Aerius calculate for these different sectors the corresponding emissions and the amount of nitrogen deposition on Natura 2000 areas.
Supported Sectors
The Aerius Calculator tool can calculate emissions for various sectors. Currently supported sectors in the Tygron Platform are:
- Traffic (Wegverkeer):
- Sector 3113: local roads (Binnen bebouwde kom)
- Sector 3112: rural roads (Buitenwegen)
- Sector 3111: highways (Snelwegen)
- Mobile machines (Mobiele werktuigen):
- Sector 3220: Construction and industrial machines (Bouw en industrie)
- Plan (Plan):
- All categories (Alle categorieën)
- Work and living (Wonen en werken):
- 8640: Work (Kantoren en winkels)
- 8200: Living (Woningen)
- 8210: Recreation (Recreatie)
Input
The input needed to make a calculation and visualize the results in the Aerius Overlay, depends on the use case and the available data. Below an overview of the different datasets that can serve as input:
- Traffic intensities for light, medium and heavy traffic per 24 hours. Optionally also bus traffic and the congestion percentages.
- The Traffic sector the road belongs to (type of road, for example a highway). See the different types.
- Fuel usage in liter per year of construction machines, specified per construction machine category.
- NOX and NH3 emissions for the work, living and recreation sectors.
- Calculation year, a value between 2014 and 2030.
Output
- Emissions per building. The emissions are added as attributes to the building with the NOX and NH3 attributes. If the building is a road, the traffic emissions are shown. Otherwise, the emissions for plan, work and living and mobile machines are summed and shown here.
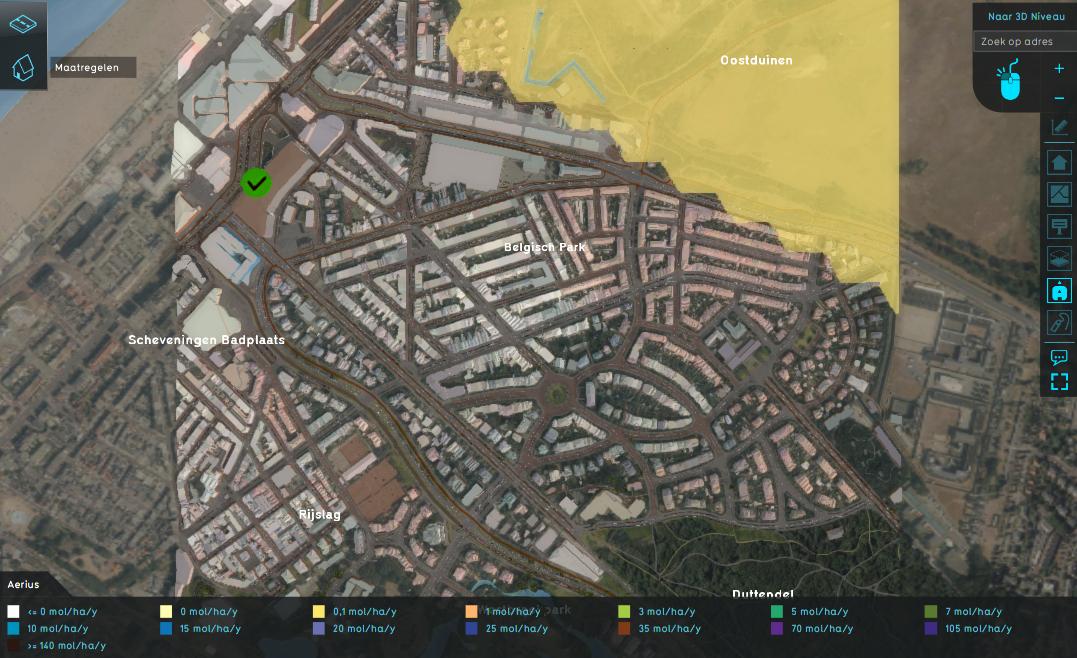
- Two result types (grid overlays) showing the NOX or NH3 deposition in Natura 2000 areas as hexagon areas.
- An array of NOx or NH3 values in mol/hectare/year per hexagon area stored in the Aerius Overlay under the NOX and NH3 keys.
- The Aerius results, including the entered values per emission source, can be downloaded as a GML file. This file can be uploaded in the [Aerius Calculator].
Result Types
The Aerius Overlay shows the following result types:
How-to's


