Demo Aerius Project: Difference between revisions
No edit summary |
No edit summary |
||
| Line 10: | Line 10: | ||
This project showcases '''the [[Aerius Module]]'''. | This project showcases '''the [[Aerius Module]]'''. | ||
The ''Demo Aerius'' project demonstrates the [[Aerius Overlay]] in a project of the Hague. It can serve as a working demo to explore the [[Aerius Module]] and the configurable parameters. | The ''Demo Aerius'' project demonstrates the [[Aerius Overlay]] in a project of the Hague. It can serve as a working demo to explore the [[Aerius Module]] and the configurable parameters. By following the steps below, an example plan will be constructed. The effect on the nitrogen deposition on Natura 2000 areas will be calculated by the [[Aerius Module]] and visualized. | ||
==Exploring the project== | ==Exploring the project== | ||
==== | ====Future design==== | ||
# Click on the '' | # Click on the tab ''Future Design'' and click in the Action bar on the house icon (see image below). | ||
# | # In the new panel that opens, select the Office measure and click on the ''Apply'' button. The new office building is constructed. Click on the Confirm button and close the panel by clicking on the close icon. | ||
# Notice the arrow above the new Office. Click on the arrow to open another panel. If the arrow is not visible, try zooming out and in with your scroll wheel mouse button to update the visualization. | |||
# Click on the ''Plan'' button and enter 7500 m2 for the Office and Shops category. Then click on the ''Bouw'' button. | |||
# Scroll down to the bottom and enter for the last construction machine category a fuel usage of 20000 liter per year. Then click on ''Verstuur''. | |||
# Go to the [[Rainfall_(Overlay)|Rainfall Overlay]] and play the Overlay. This Overlay shows the [[Surface_last_value_result_type_(Water_Overlay)|Surface last value]] result type of a heavy short rainfall. The blue with red lines are [[Culvert_(Water_Overlay)|culverts]], which connect the [[Terrain#Surface|water terrains]]. The blue with orange lines are the [[Inlet_(Water_Overlay)|outlets]]. | # Go to the [[Rainfall_(Overlay)|Rainfall Overlay]] and play the Overlay. This Overlay shows the [[Surface_last_value_result_type_(Water_Overlay)|Surface last value]] result type of a heavy short rainfall. The blue with red lines are [[Culvert_(Water_Overlay)|culverts]], which connect the [[Terrain#Surface|water terrains]]. The blue with orange lines are the [[Inlet_(Water_Overlay)|outlets]]. | ||
# Select the [[Surface_elevation_result_type_(Water_Overlay)|Surface elevation]] result type and notice the forest area is higher than the rest of the project area. | # Select the [[Surface_elevation_result_type_(Water_Overlay)|Surface elevation]] result type and notice the forest area is higher than the rest of the project area. | ||
# Take a look at the [[Surface_avg_direction_result_type_(Water_Overlay)|Surface avg direction result]] result type. The arrows show the average flow direction of the water. Notice that in the forest area, the arrows point inwards. Zoom out a bit and play the Surface average direction result type and notice that around timeframe 25 the direction of the arrows stay the same. This result type is used as input for the [[Watershed_Module|Watershed Module]] for the direction of the [[Watershed_Module#Calculation|rainwater flow]] on the terrain. | # Take a look at the [[Surface_avg_direction_result_type_(Water_Overlay)|Surface avg direction result]] result type. The arrows show the average flow direction of the water. Notice that in the forest area, the arrows point inwards. Zoom out a bit and play the Surface average direction result type and notice that around timeframe 25 the direction of the arrows stay the same. This result type is used as input for the [[Watershed_Module|Watershed Module]] for the direction of the [[Watershed_Module#Calculation|rainwater flow]] on the terrain. | ||
<gallery mode=nolines> | <gallery mode=nolines> | ||
File: | File:Future design house.PNG|Step 1. Click in the Future design tab on the house icon. | ||
File: | File:Apply office.PNG|Step 2. Click on the Office measure and Apply. | ||
File: | File:Confirm.PNG|Step 2. Click on Confirm and close the panel. | ||
File: | File:Icon building.PNG|Step 3. Click on the blue arrow. | ||
File: | File:Office space panel.PNG|Step 4. Fill in the amount of office space in m2. | ||
File:Fuel usage bouw.PNG|Step 5. Fill in the fuel usage per year and click on Verstuur. | |||
</gallery> | </gallery> | ||
====Results==== | ====Results==== | ||
<gallery mode=nolines> | <gallery mode=nolines> | ||
</gallery> | </gallery> | ||
===Analyse=== | ===Analyse=== | ||
<gallery mode=nolines> | <gallery mode=nolines> | ||
</gallery> | </gallery> | ||
Revision as of 14:36, 1 September 2020
| Next page>> |

The Demo Watershed project is available for all users with Preview access and can be found in the main menu under Edit projects. This project does not count towards your license.
This project is intended for plans, spatial development, environmental regulations, building policy.
This project showcases the Aerius Module.
The Demo Aerius project demonstrates the Aerius Overlay in a project of the Hague. It can serve as a working demo to explore the Aerius Module and the configurable parameters. By following the steps below, an example plan will be constructed. The effect on the nitrogen deposition on Natura 2000 areas will be calculated by the Aerius Module and visualized.
Exploring the project
Future design
- Click on the tab Future Design and click in the Action bar on the house icon (see image below).
- In the new panel that opens, select the Office measure and click on the Apply button. The new office building is constructed. Click on the Confirm button and close the panel by clicking on the close icon.
- Notice the arrow above the new Office. Click on the arrow to open another panel. If the arrow is not visible, try zooming out and in with your scroll wheel mouse button to update the visualization.
- Click on the Plan button and enter 7500 m2 for the Office and Shops category. Then click on the Bouw button.
- Scroll down to the bottom and enter for the last construction machine category a fuel usage of 20000 liter per year. Then click on Verstuur.
- Go to the Rainfall Overlay and play the Overlay. This Overlay shows the Surface last value result type of a heavy short rainfall. The blue with red lines are culverts, which connect the water terrains. The blue with orange lines are the outlets.
- Select the Surface elevation result type and notice the forest area is higher than the rest of the project area.
- Take a look at the Surface avg direction result result type. The arrows show the average flow direction of the water. Notice that in the forest area, the arrows point inwards. Zoom out a bit and play the Surface average direction result type and notice that around timeframe 25 the direction of the arrows stay the same. This result type is used as input for the Watershed Module for the direction of the rainwater flow on the terrain.
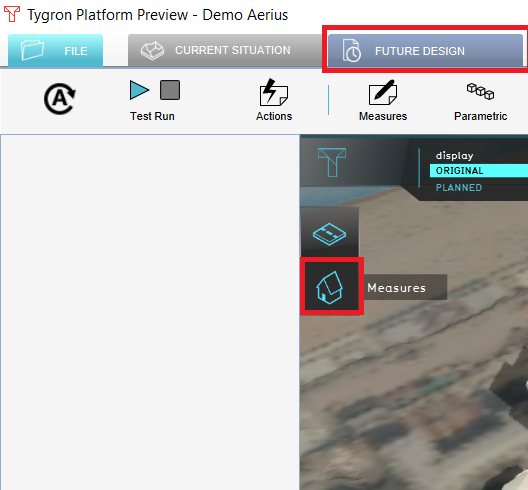
Step 1. Click in the Future design tab on the house icon.
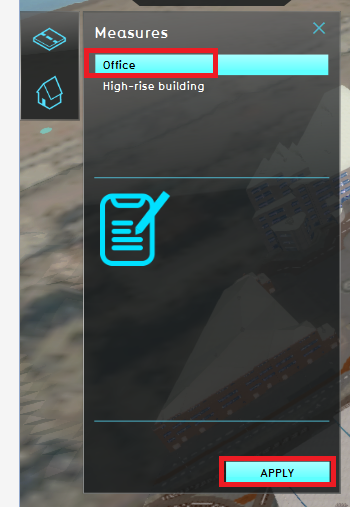
Step 2. Click on the Office measure and Apply.
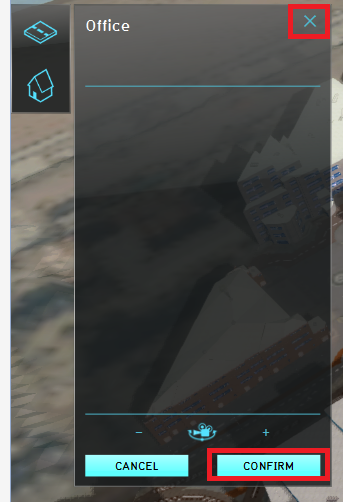
Step 2. Click on Confirm and close the panel.
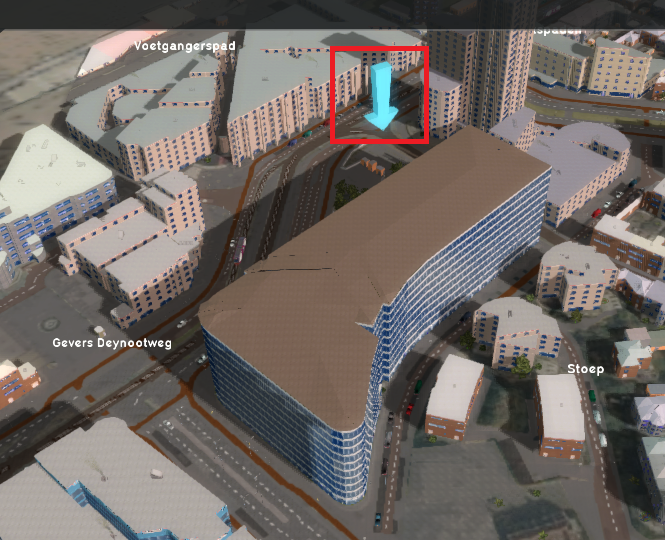
Step 3. Click on the blue arrow.
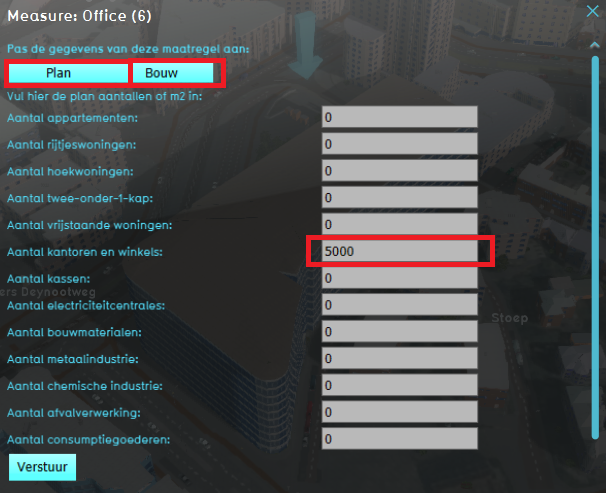
Step 4. Fill in the amount of office space in m2.
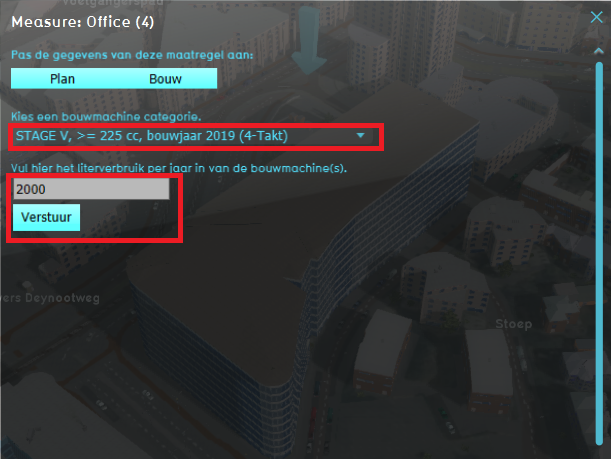
Step 5. Fill in the fuel usage per year and click on Verstuur.


Results
Analyse
| Next page>> |


