How to configure an Average Overlay to gain insight into grid cell values
Revision as of 15:55, 10 January 2024 by Frank@tygron.nl (talk | contribs)
How to create an Average Overlay based on another Grid Overlay:
- Select Current Situation in the ribbon bar of the editor.
- Hover over Overlays, and under Grid Calculation, select Avg & Interpolation.
- With the Overlay selected, open the Configuration Wizard by clicking on the button in the detail panel.
- Once the wizard is ready, select next.
- In the operator step, select the option named AVG.
- In the type step, select the option named The overlay's input is based on feature attributes.
- In the layer step, select the option that is best applicable: when the feature attribute is in multiple layers, select the "First occurence", "Minimum value" or "Maximum value" option. If the attribute should only be obtained from a specific layer, select the Specific Layer only option. In that case you also have to select a particular layer, such as Buildings.
- Close the wizard by clicking on the finish button.
- Adjust the averaging distance by selecting the Cell averaging distance (m) field.
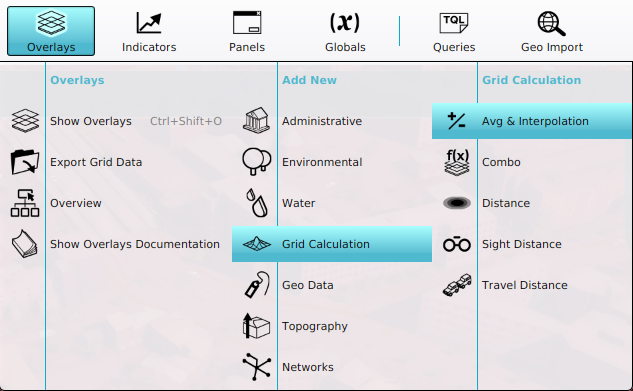
2. Add a new Average Overlay.
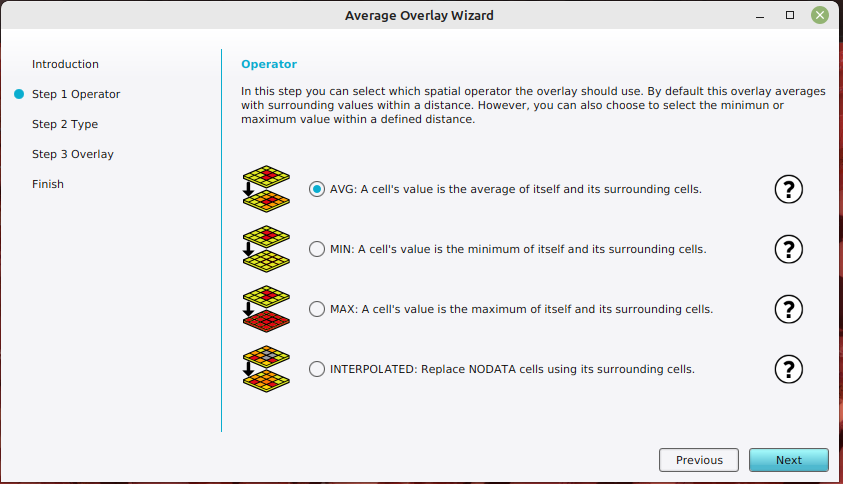
5. Select the AVG option.
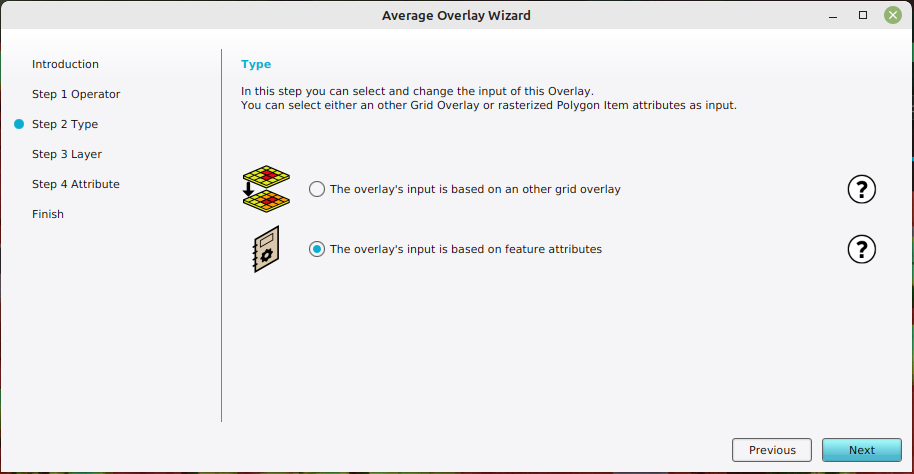
6. Select the The overlay's input is based on feature attributes option.
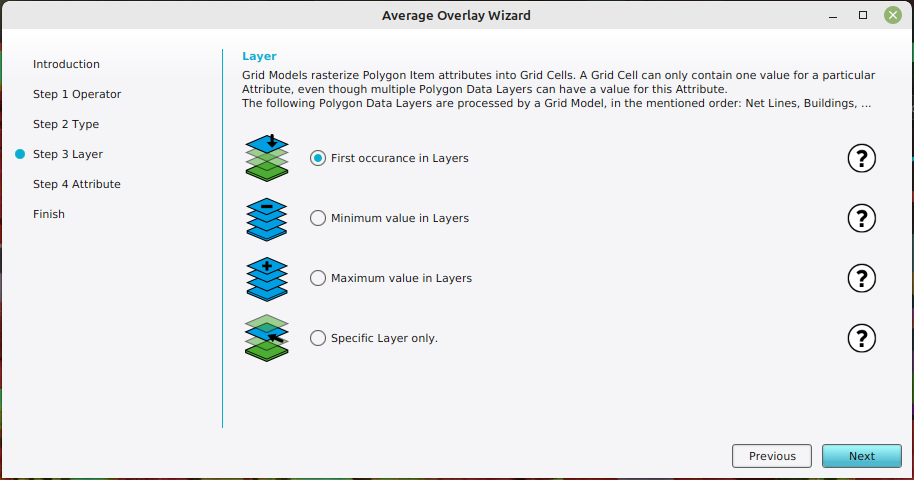
7. Select the method how to obtain the feature attribute from layers.
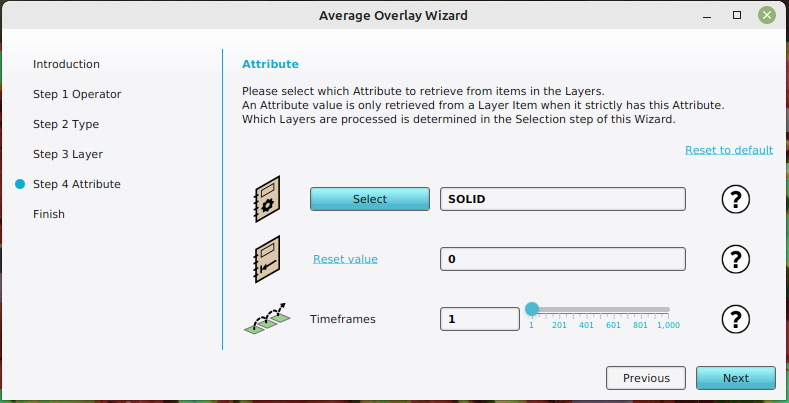
8. Select the attribute, and optionally define the NO_DATA value.
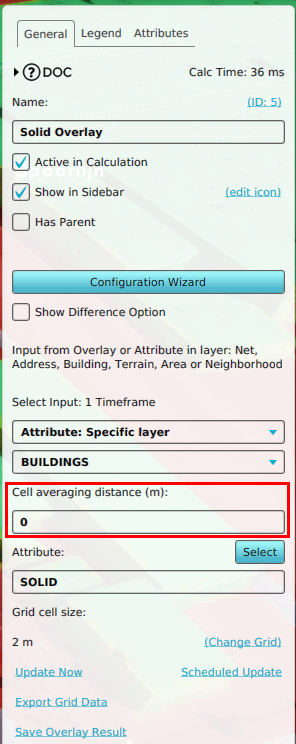
9. Specify the averaging distance.


Notes
- The layer sequence of first occurrence is defined in Rasterization model.
- In the attribute step, the amount of timeframes can be increated when the attribute is represented by an array of values.