Radial well freatic benchmark (Water Module)
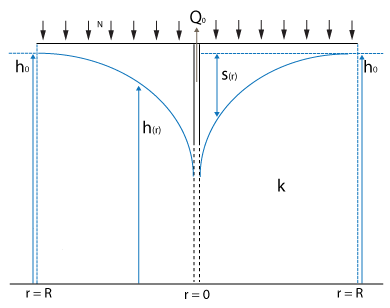
This testcase demonstrates a situation where a well is extracting ground water in a confined freatic layer. There is no aquifer present. A characteristic ground water level curve will form over time.
Formulas
The lowering of the ground water table in a closed freatic layer, without additional rainfall, can be described by the following formula [1]
where:
- : stable water level at the considered stable water table edge
- : water level between the considered stable water table edge and the well
- : water level in the well
- : hydraulic conductivity of the freatic layer in m / day
- : distance to the well
- : distance of the considered stable water table edge to the well
- : amount of water pumped out in m³ / day
Setup
We use the following setup in our tests. The grid size used is 51 by 51, with a configurable cell size of in meters. There is one underground outlet, which pumps water away continuously with a default amount per second.
The terrain height is set to 0 meters (datum).
The outlet is placed on the cells x = 25 and y = 25 as an inlet with a negative inlet.
- INLET Q is set to
- UNDERGROUND is set to true (1.0) to place the outlet below the surface.
To stabilized the water levels on the edges of the test case , an additional underground inlet is used. It is located on all cells equal to or further away than the chosen R. This inlet is configured as followed:
- Inlet Q set to 0, such that is unlimited.
- UNDERGROUND is set to true (1.0) to place the outlet below the surface.
- UPPER_THRESHOLD set to -2 m.
- LOWER_THRESHOLD set to -2 m.
The ground bottom distance is configured as 10 meters, which places the bottom at -10 meters (datum).
The water storage fraction is set to 0.25.
The infiltration m / day is set to 0.05.
The simulation is run for 64 days with 0 rainfall, which is configured in the weather's rain attribute as:
Test results
Important in all these tests in the chosen R, which is the distance to the well that is considered a stable water level. Additionally, the measurements are done relative to the impenetrable soil, which is situated 10 meters below the surface.
Test case 1
- cell size: 5 m;
- : m/day;
- : 110;
- : 50;
- Simulation days : 64 days;
Test case 2
- cell size: 5 m;
- : m/day;
- : 110;
- : 50;
- Simulation days : 64 days;
Test case 3
- cell size: 5 m;
- : m/day;
- : 110;
- : 50;
- Simulation days : 64 days;
Test case 4
- cell size: 5 m;
- : m/day;
- : 110;
- : 50;
- Simulation days : 64 days;
Test case 5
- cell size: 5 m;
- : m/day;
- : 110;
- : 25;
- Simulation days : 64 days;
Test case 6
- cell size: 5 m;
- : m/day;
- : 110;
- : 100;
- Simulation days : 64 days;
Test case 7
- cell size: 2 m;
- : m/day;
- : 110;
- : 1;
- Simulation days : 64 days;
Test case 8
- cell size: 2 m;
- : m/day;
- : 110;
- : 16;
- Simulation days : 64 days;
Test case 9
- cell size: 2 m;
- : m/day;
- : 110;
- : 4;
- Simulation days : 64 days;
Test case 10
- cell size: 2 m;
- : m/day;
- : 110;
- : 4;
- Simulation days : 64 days;
Test case 11
- cell size: 2 m;
- : m/day;
- : 110;
- : 4;
- Simulation days : 64 days;
References
- ↑ Verruijt, A. (1970). Theory of Groundwater Flow. Macmillan, London.


![{\displaystyle [64\cdot 24\cdot 3600,0]}](https://wikimedia.org/api/rest_v1/media/math/render/svg/df14d65216144e1a7ada4e57939be32f8807b4c2)


