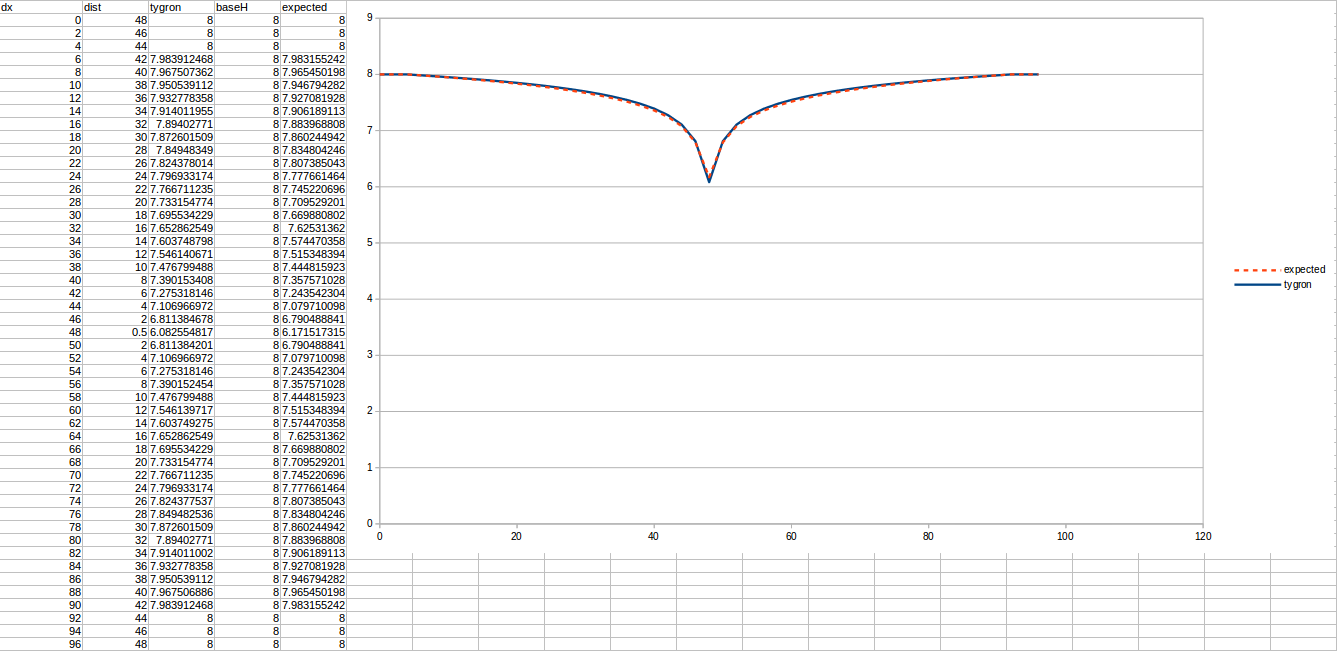
Radial well freatic benchmark (Water Module)
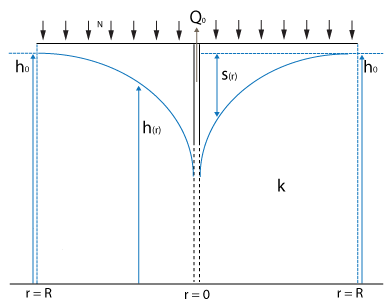
This testcase demonstrates a situation where a well is extracting ground water in a confined freatic layer. There is no aquifer present. A characteristic ground water level curve will form over time.
Formulas
The lowering of the ground water table in a closed freatic layer, without additional rainfall, can be described by the following formula [1]
where:
- : stable water level at the considered stable water table edge
- : water level between the considered stable water table edge and the well
- : hydraulic conductivity of the freatic layer in m / day
- : distance to the well
- : distance of the considered stable water table edge to the well
- : amount of water pumped out in m³ / day
Setup
We use the following setup in our tests. The grid size used is 51 by 51, with a configurable cell size of in meters. There is one underground outlet, which pumps water away continuously with a default amount per second.
The terrain height is set to 0 meters (datum).
The outlet is placed on the cells x = 25 and y = 25 as an inlet with a negative inlet.
- INLET Q is set to
- UNDERGROUND is set to true (1.0) to place the outlet below the surface.
To stabilized the water levels on the edges of the test case , an additional underground inlet is used. It is located on all cells equal to or further away than the chosen R. This inlet is configured as followed:
- Inlet Q set to 0, such that is unlimited.
- UNDERGROUND is set to true (1.0) to place the outlet below the surface.
- UPPER_THRESHOLD set to -2 m.
- LOWER_THRESHOLD set to -2 m.
The ground bottom distance is configured as 10 meters, which places the bottom at -10 meters (datum).
The water storage fraction is set to 0.25.
The vertical infiltration is set to 0.05 m / day.
The hydraulic conductivity is set to k m / day.
The simulation is run for 64 days with 0 rainfall, which is configured in the weather's rain attribute as:
Test results
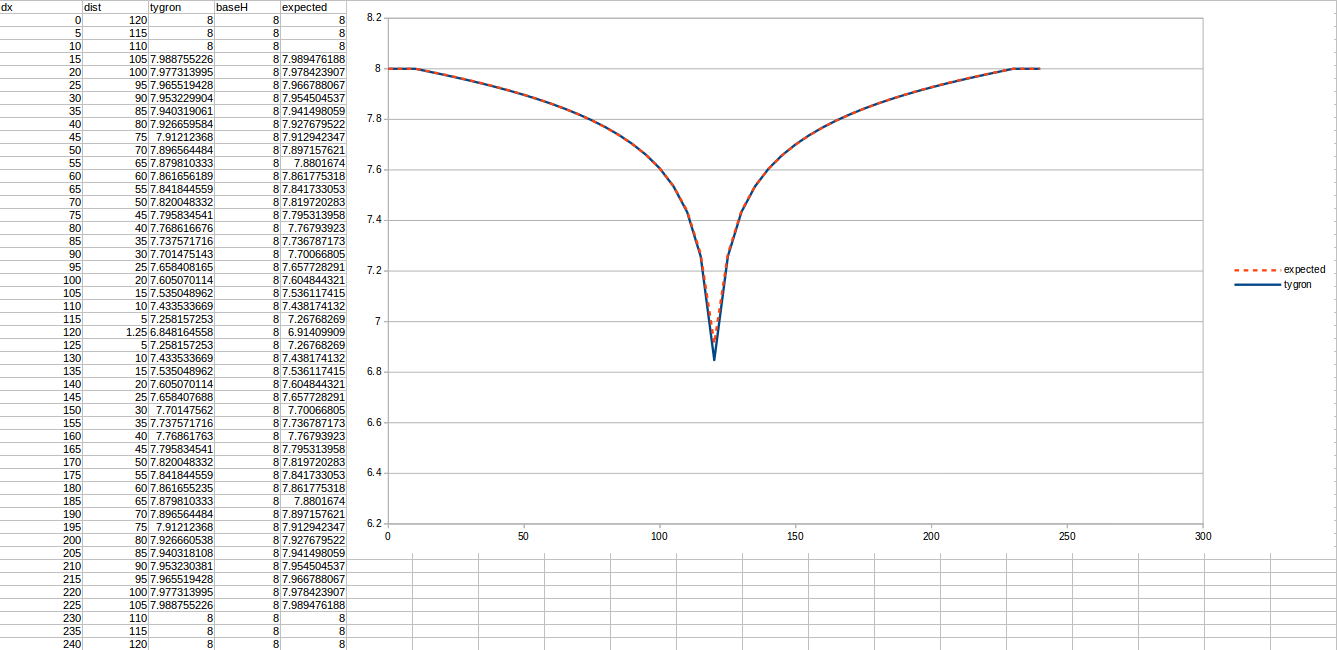
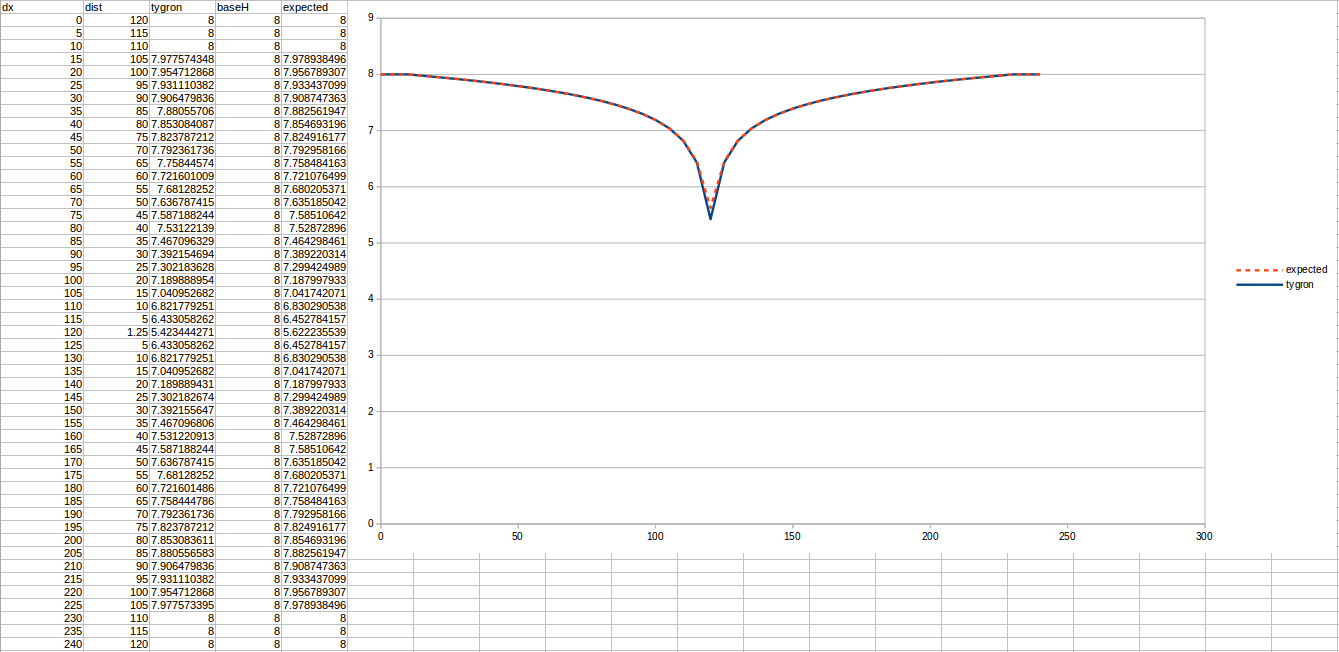
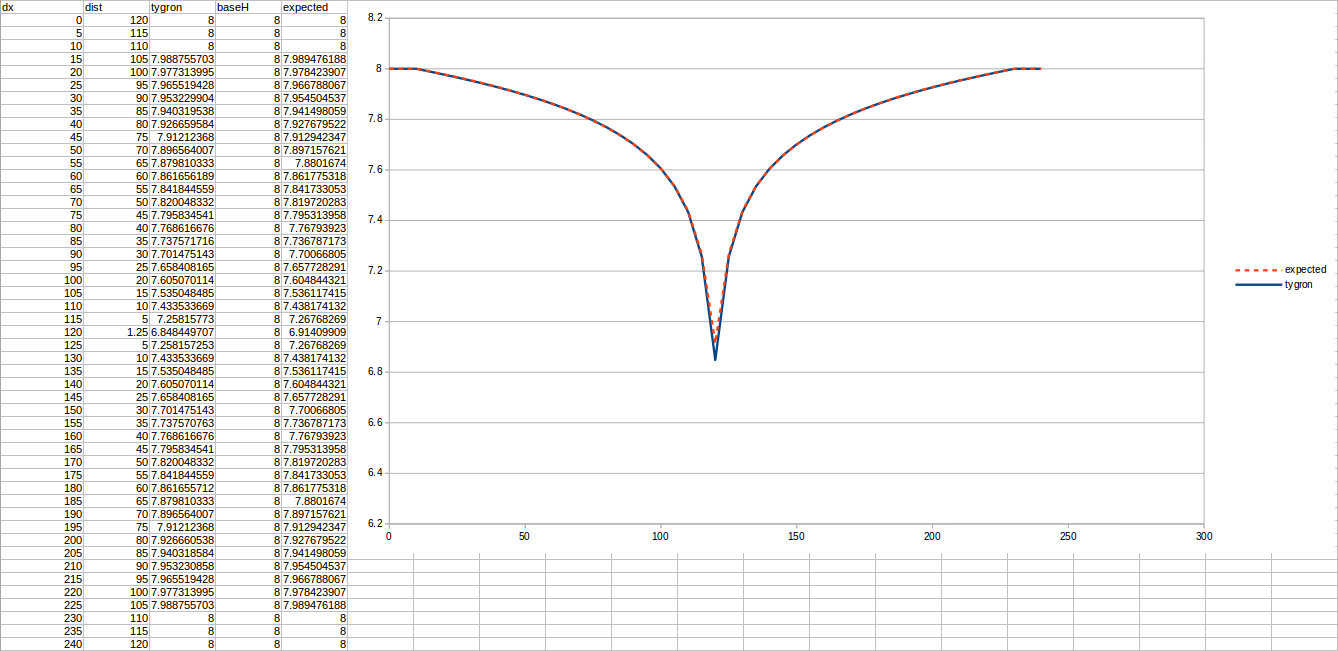
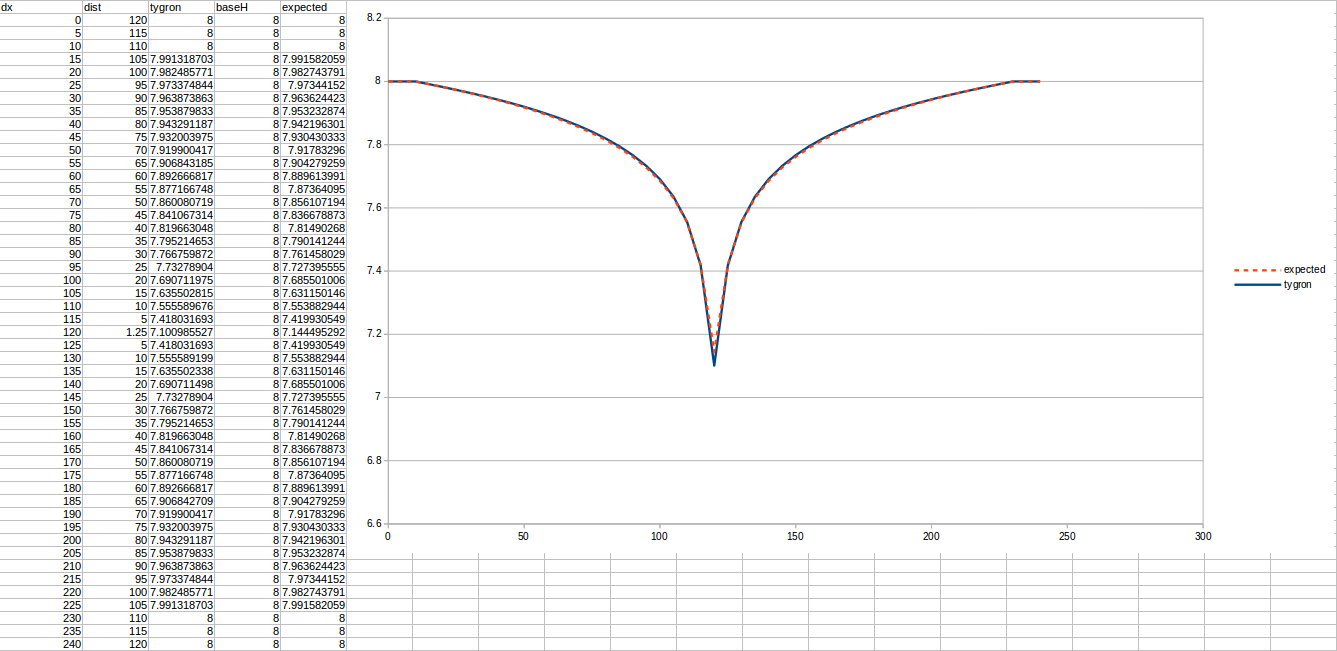
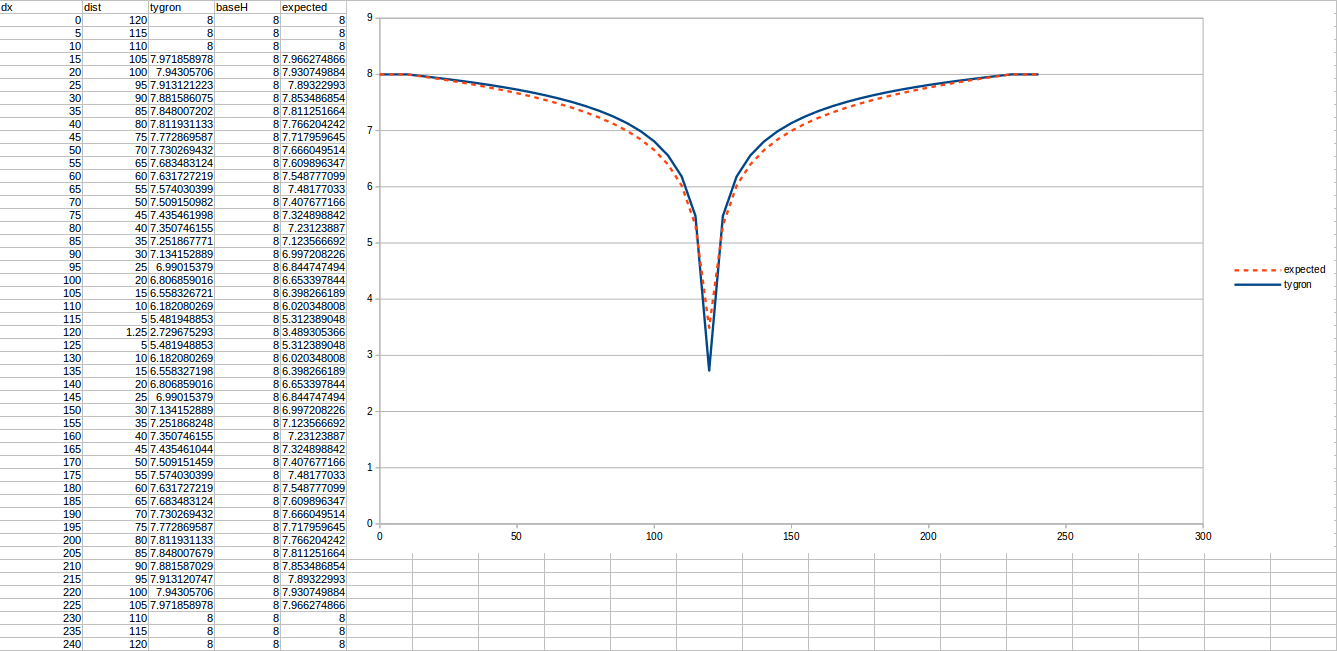
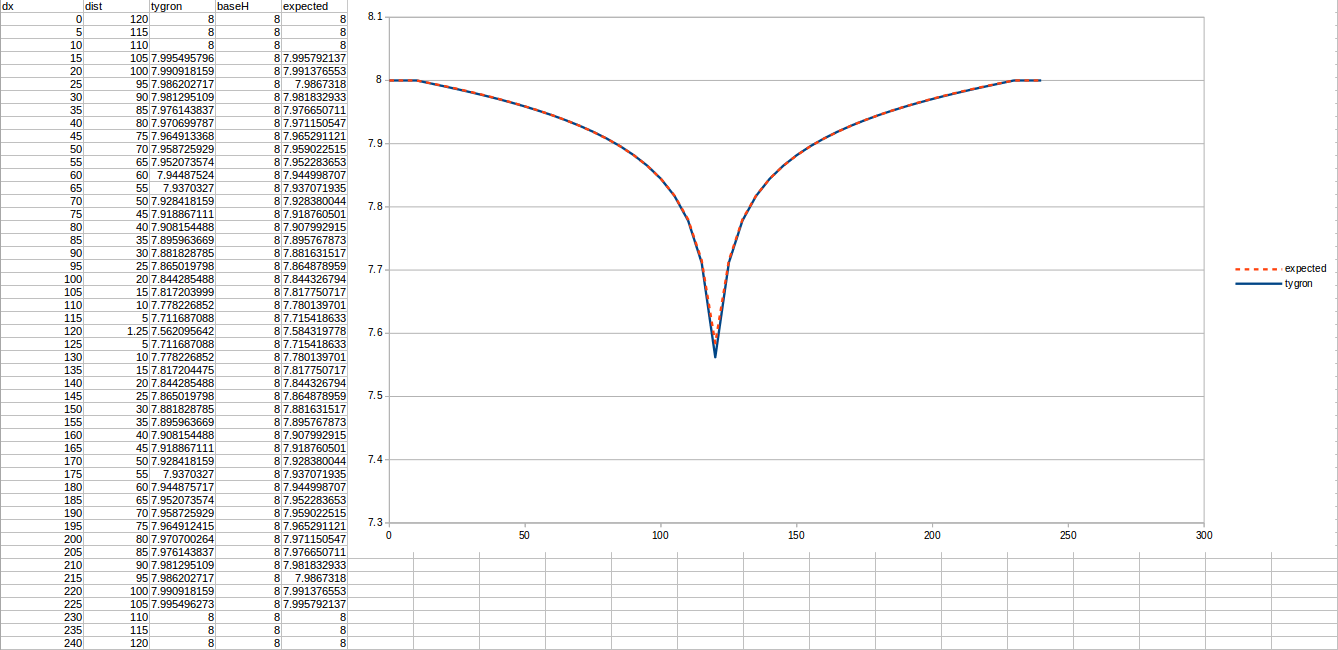
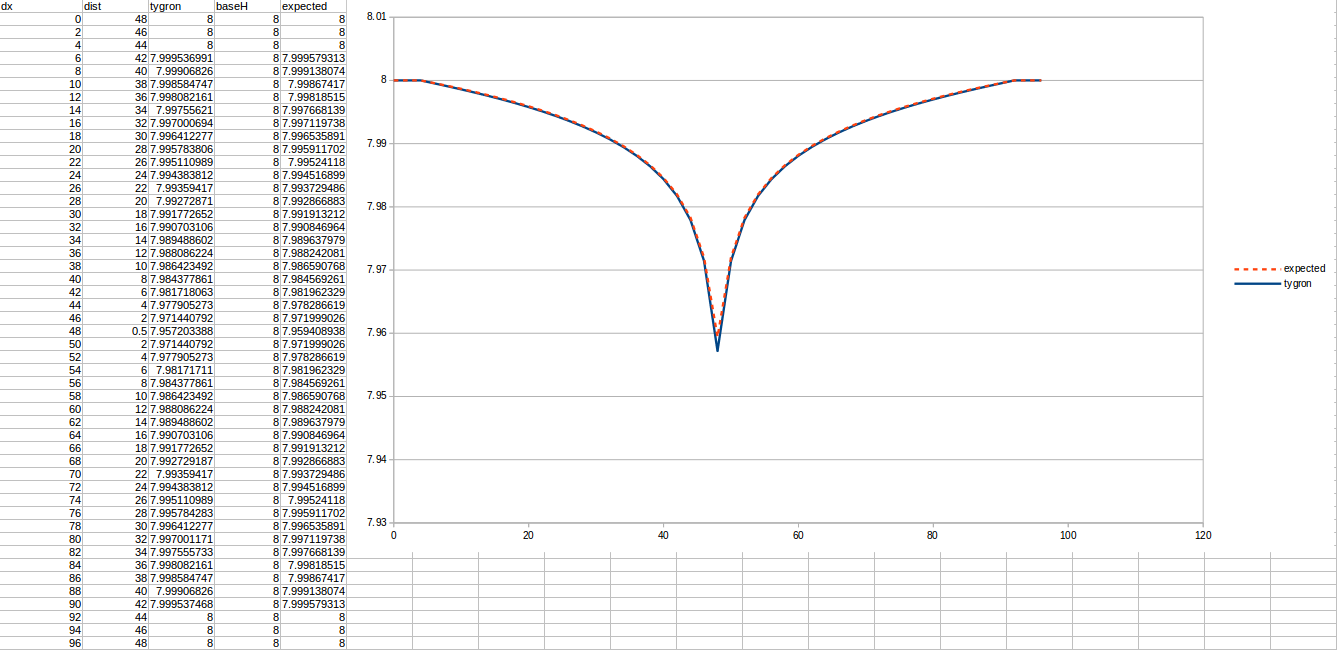
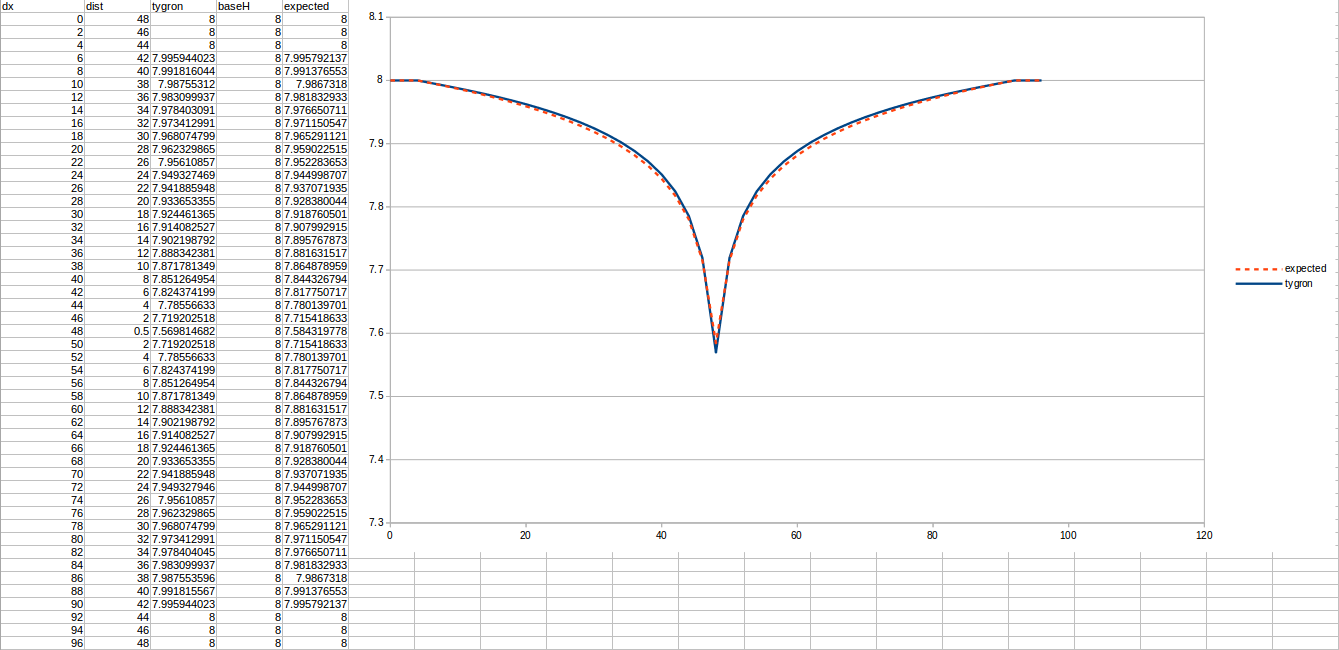
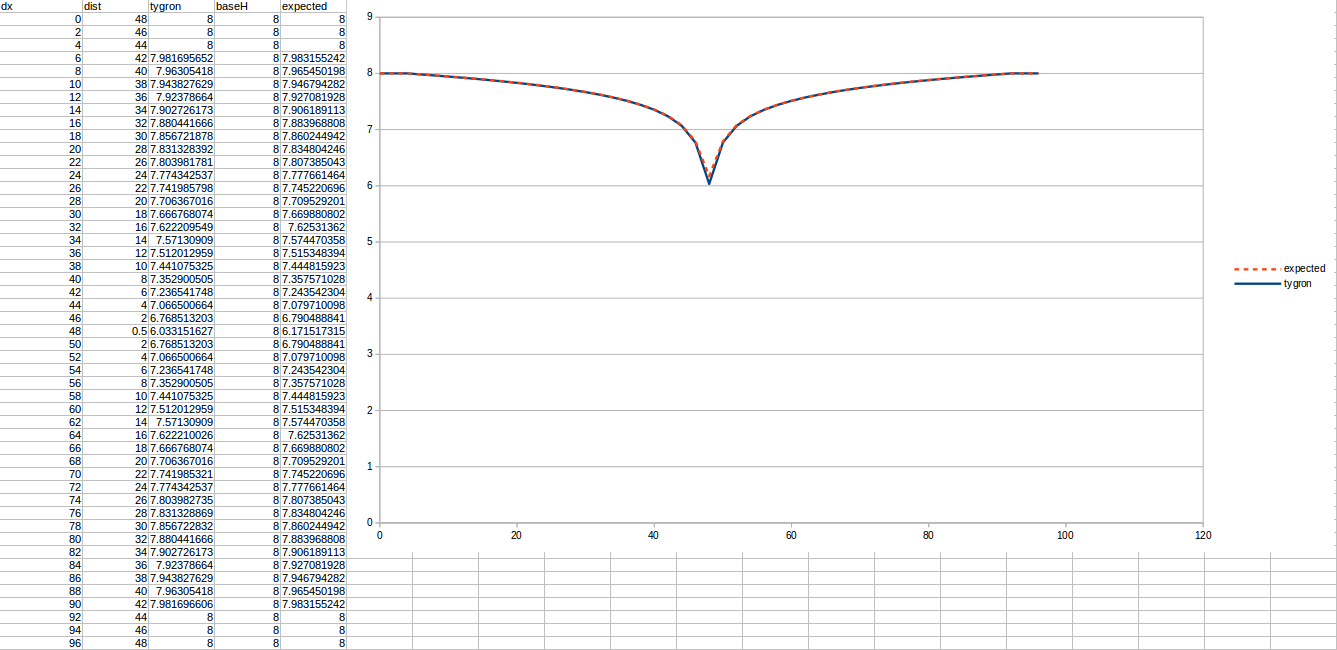
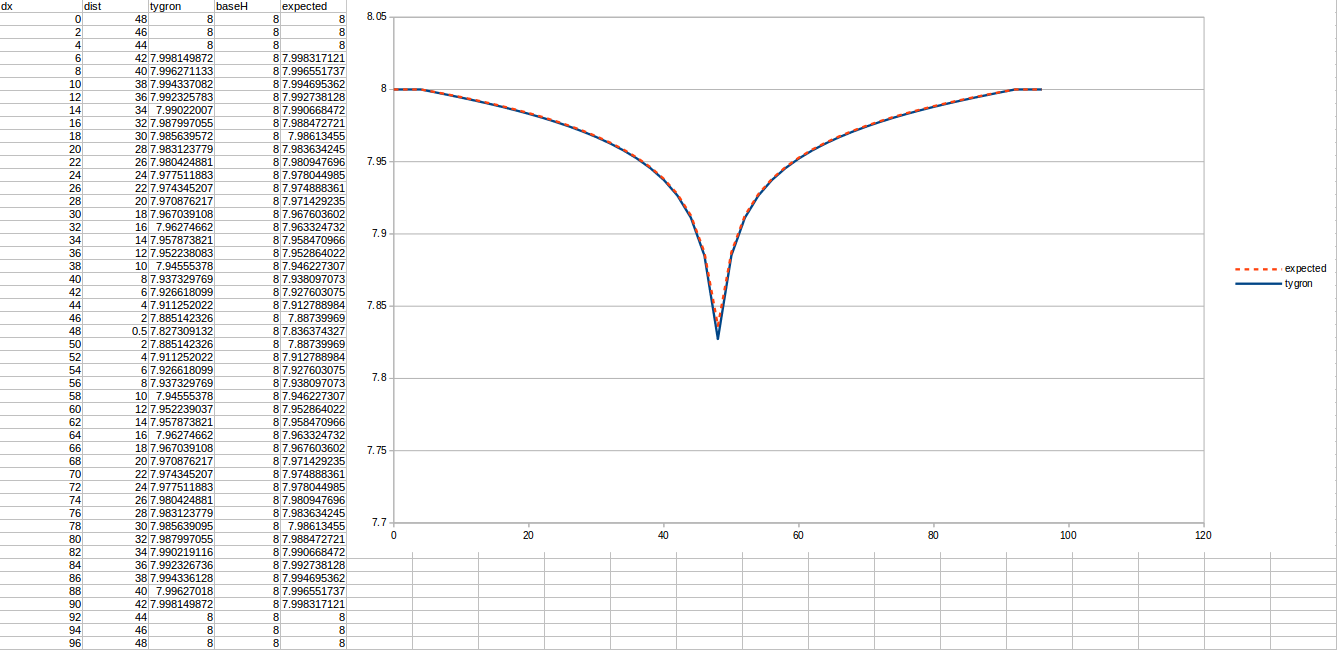
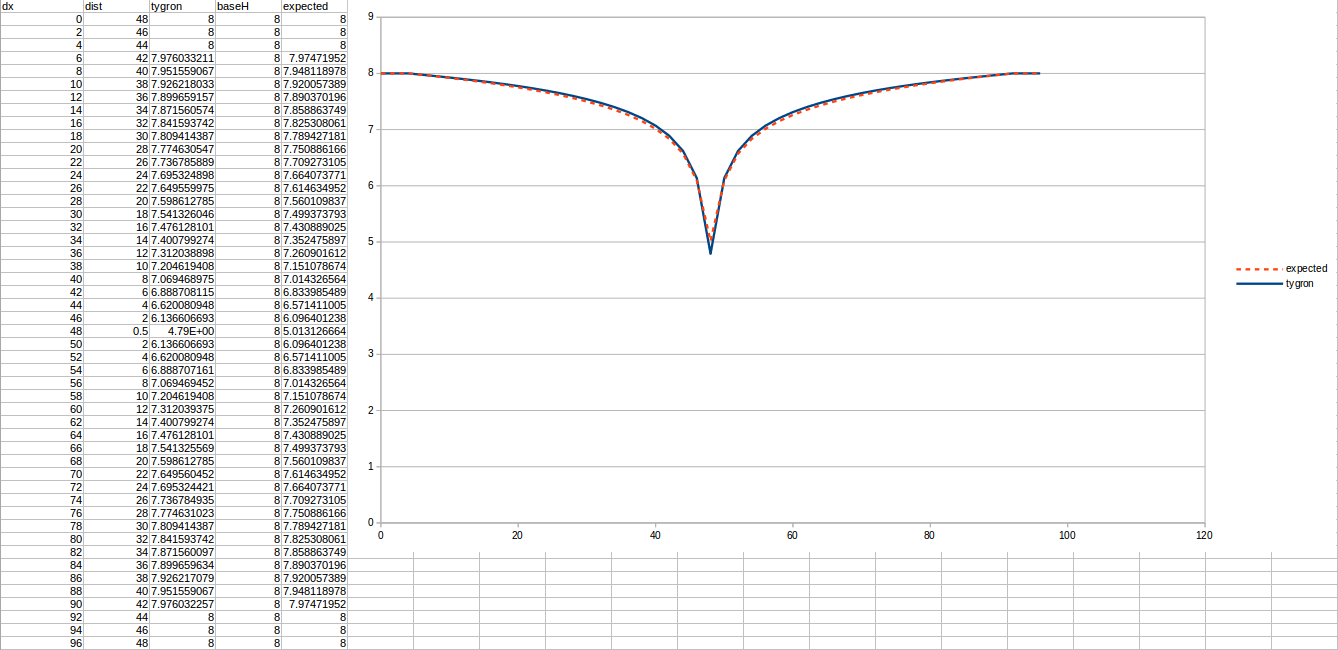
Important in all these tests is the amount of chosen days it was ran, because the formula says nothing on how long it should take until the stable situation is reached. Secondly, the measurements are done relative to the impenetrable soil, which is situated 10 meters below the surface.
Test case 1
- cell size: 5 m;
- : 4.4 m/day;
- : 110;
- : 50 m³ /day;
- Simulation days : 64 days;
Test case 2
- cell size: 5 m;
- : 2.2 m/day;
- : 110;
- : 50 m³ /day;
- Simulation days : 128 days;
Test case 3
- cell size: 5 m;
- : 2.2 m/day;
- : 110;
- : 25 m³/day;
- Simulation days : 128 days;
Test case 4
- cell size: 5 m;
- : 0.44 m/day;
- : 110;
- : 4 m³/day;
- Simulation days : 512 days;
Test case 5
- cell size: 5 m;
- : 0.11 m/day;
- : 110;
- : 4 m³/day;
- Simulation days : 1256 days;
Test case 6
- cell size: 5 m;
- : 2.2 m/day;
- : 110;
- : 10;
- Simulation days : 128 days;
Test case 7
- cell size: 2 m;
- : 2_2 m/day;
- : 110;
- : 1;
- Simulation days : 64 days;
Test case 8
- cell size: 2 m;
- : 0.22 m/day;
- : 110;
- : 1;
- Simulation days : 256 days;
Test case 9
- cell size: 2 m;
- : 0.22 m/day;
- : 110;
- : 4;
- Simulation days : 256 days;
Test case 10
- cell size: 2 m;
- : 2.2 m/day;
- : 110;
- : 4;
- Simulation days : 64 days;
Test case 11
- cell size: 2 m;
- : 0.22 m/day;
- : 110;
- : 6;
- Simulation days : 128 days;
Test case 12
- cell size: 2 m;
- : 0.44 m/day;
- : 110;
- : 8;
- Simulation days : 64 days;
References
- ↑ Theory of Groundwater Flow. Macmillan, London ∙ Verruijt, A. (1970)
