Tutorial SF Project: Difference between revisions
(Created page with " __NOTOC__ This page provides an overview and explanation about the Demo San Francisco project, available for all users. ===About the project=== The ''Demo San Francisco'' pr...") |
No edit summary |
||
| (29 intermediate revisions by 4 users not shown) | |||
| Line 5: | Line 5: | ||
===About the project=== | ===About the project=== | ||
The ''Demo San Francisco'' project is available for all users in the trial version and can be found in the main menu under Edit projects. | The ''Demo San Francisco'' project is available for all users in the trial version and can be found in the main menu under Edit projects. | ||
The demo is a working project in which an I3S Scene Layer is used in the new project generation wizard to create the 3D [[ | The demo is a working project in which an I3S Scene Layer is used in the new project generation wizard to create the 3D [[Buildings]]. This project can serve to further explore the 3D model and its contents. | ||
===Demo San Francisco=== | ===Demo San Francisco=== | ||
[[File: | [[File:San_francisco.png|thumb|right|300px|Project of San Francisco in the Tygron Platform]] | ||
The project | The project shows an area in the San Francisco financial district, created from an I3S Scene Layer and [[Project_Sources|OSM]] data. In this demo we will explore the contents of the 3D model, the used data to generate the model and add a map to analyze the different type of buildings. | ||
=== | ===Analyze the project=== | ||
# | # Zoom and click around in the project to inspect the 3D model. | ||
# | # To see from which datasets the 3D model is constructed, [[How_to_add_and_remove_an_Overlay|add]] the [[Source_(Overlay)|Source overlay]]. An overlay is a 2D map rendered on top of the 3D visualization. The [[Source_(Overlay)|Source overlay]] highlights the used datasets in a map. First check the I3S San Francisco dataset. Notice most of the buildings in the 3D model are highlighted. This means data from the I3S Scene Layer is used to create these buildings. | ||
# | # Uncheck the I3S San Francisco dataset and check the [[Project_Sources|OSM]] dataset. Notice that again almost all buildings are highlighted. This accentuates the effect that the {{software}} uses multiple data sources to create the 3D model. Take a look at the [[Project_Sources|project sources]] page to see all the (open) data we use to generate a new project. | ||
# | # Click on the [[City_Overlay|default overlay]] to see the default 3D model without a map. | ||
# | # Click on the [[Current_Situation|Current situation tab]] on the [[Buildings]] button and select the building that is referred to with the arrow icon. In the right panel, the attributes such as the name of the building and its [[Function|function]] are displayed. Notice that this building has the function office, which is known from the [[Project_Sources|OSM]] dataset. | ||
# Select the Details tab and scroll through the different attributes and values. These attributes are called [[Function_Value|function values]]. Notice that some attributes have values and some attributes have a value of 0. These values are used in calculation models of [[Grid Overlay]]s. | |||
# [[How_to_add_and_remove_an_Overlay|Add]] the [[Function Overlay]]. This overlay can highlight one or more functions in the [[3D Visualization]]. When added, the overlay consists of a white map. | |||
# We will now select the function we want to highlight. Therefore click in the right panel on the add button. A new panel pops up. | |||
# In the new panel, select the category Leisure and select the Hotel function. Then click on apply. | |||
# The [[Function Overlay]] will now show the buildings with the [[Function|function]] hotel highlighted red. | |||
# Zoom out a bit so that the whole [[project area]] is visible and click on the highlighted red buildings. Notice that a hover panel pops up which also contains some information about the building. | |||
<!--# Add an attribute overlay | |||
# Search in the scene layers for the San Francisco layer --> | |||
<br> | |||
<gallery mode=nolines> | |||
File:Add_source.JPG|2. Add the Source overlay. An overlay is a 2D map on top of the 3D model. | |||
File:Check_i3s.JPG|2. Check the I3S San Francisco data. | |||
File:Source_i3s.JPG|2. Notice that almost all buildings are created from this dateset. | |||
File:City_overlay.JPG|4. Click on the City overlay to go to the default view. | |||
File:Select_building_project.JPG|5. Click in the Current tab on the Buildings button and click on the building with the arrow. | |||
File:Attributes_building.JPG|5. The attributes of the building. | |||
File:Building_details.JPG| 6. Click on the Details tab to see the Function values. | |||
File:Add_function_higlight.JPG|8. Click on the Add button in the right panel. | |||
File:Select_hotel.JPG|9. Select from th category Leisure the Hotel function. | |||
File:Hotel_map.JPG|10. A map with the hotels in the project. | |||
</gallery> | |||
===FAQ=== | |||
*'''How can I change the texture, color or shape of a 3D model? | |||
:''You can change the look of most 3D models manually in the editor, only Landmarks are fixed in their appearances. You can select the model you would like to change in the [[project]] or from the list of present buildings, and change color and texture on the right side of the editor window. You can also change the shape of most models by using the brush functionality.<br> See also: [[Buildings#Draw area|How to draw buildings]] and [[Buildings#Draw area|Changing buildings]] | |||
*'''How do I import new 3D models? | |||
:''You can upload most Geo file formats in the Tygron Platform with the [[Geo Data Wizard]]. This way you can let the Tygron Platform generate 3D models based on your imported data values. This can be done starting with generic 3D placeholder buildings up to photo-realistically wrapped buildings (SLPK/ i3s). It is advised to first read the following articles: | |||
:''-[[Geo Data]] | |||
:''-[[Data preparation|How to prepare Geo Data]] | |||
:''-[[Custom Geometry]] | |||
:''-[[SLPK]] | |||
:''If you already have a specific 3D model you would like to use, the model needs to adhere to the following: [http://support.tygron.com/w/downloads/models/Pipelinemanual%200.2.1.pdf Tygron Platform 3D model guidelines (PDF)] | |||
*'''How do I delete 3D models? | |||
:''You can select the model to be deleted, by clicking on it in the [[3D Visualization]] or by selecting it from the list of buildings. You can then select to remove the building.<br> See also: [[Buildings#Removing buildings|Removing buildings]] | |||
*'''Why do some 3D models seem to float in the 3D Visualization? | |||
:''If imported buildings float, usually the floor/ ground level attribute is not correctly configured in the Geo data file used for the import. When the building is already generated by the Tygron Platform, the most common cause is that the building is close to an edge or other difference in terrain elevation and due to rounding off of grid cells or height sectors the building (partially) floats. | |||
===See also=== | ===See also=== | ||
#[[ | #[[New Project Wizard]] | ||
#[[How_to_import_i3s_scene_layer_in_new_project|How to use I3S data for creating a new project]] | |||
#[[ | #[https://www.tygron.com/nl/2018/08/06/new-project/| Video tutorial on creating a new project] | ||
#[ | #[https://community.tygron.com/forum/discussion/209/how-to-create-a-custom-map-to-highlight-data-already-present-in-the-platform/p1| How to highlight data] | ||
#[ | |||
<br> | <br> | ||
Latest revision as of 09:17, 28 September 2023
This page provides an overview and explanation about the Demo San Francisco project, available for all users.
About the project
The Demo San Francisco project is available for all users in the trial version and can be found in the main menu under Edit projects. The demo is a working project in which an I3S Scene Layer is used in the new project generation wizard to create the 3D Buildings. This project can serve to further explore the 3D model and its contents.
Demo San Francisco

The project shows an area in the San Francisco financial district, created from an I3S Scene Layer and OSM data. In this demo we will explore the contents of the 3D model, the used data to generate the model and add a map to analyze the different type of buildings.
Analyze the project
- Zoom and click around in the project to inspect the 3D model.
- To see from which datasets the 3D model is constructed, add the Source overlay. An overlay is a 2D map rendered on top of the 3D visualization. The Source overlay highlights the used datasets in a map. First check the I3S San Francisco dataset. Notice most of the buildings in the 3D model are highlighted. This means data from the I3S Scene Layer is used to create these buildings.
- Uncheck the I3S San Francisco dataset and check the OSM dataset. Notice that again almost all buildings are highlighted. This accentuates the effect that the Tygron Platform uses multiple data sources to create the 3D model. Take a look at the project sources page to see all the (open) data we use to generate a new project.
- Click on the default overlay to see the default 3D model without a map.
- Click on the Current situation tab on the Buildings button and select the building that is referred to with the arrow icon. In the right panel, the attributes such as the name of the building and its function are displayed. Notice that this building has the function office, which is known from the OSM dataset.
- Select the Details tab and scroll through the different attributes and values. These attributes are called function values. Notice that some attributes have values and some attributes have a value of 0. These values are used in calculation models of Grid Overlays.
- Add the Function Overlay. This overlay can highlight one or more functions in the 3D Visualization. When added, the overlay consists of a white map.
- We will now select the function we want to highlight. Therefore click in the right panel on the add button. A new panel pops up.
- In the new panel, select the category Leisure and select the Hotel function. Then click on apply.
- The Function Overlay will now show the buildings with the function hotel highlighted red.
- Zoom out a bit so that the whole project area is visible and click on the highlighted red buildings. Notice that a hover panel pops up which also contains some information about the building.
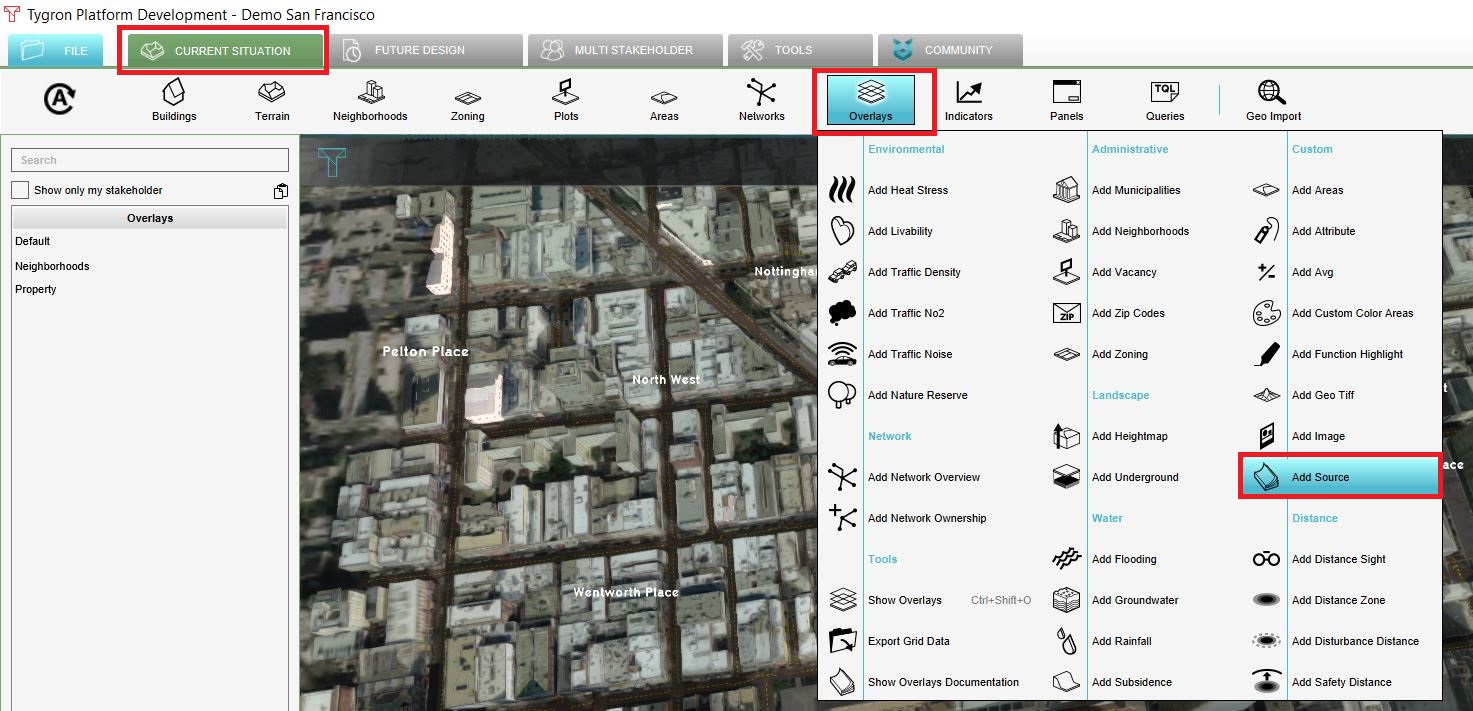
2. Add the Source overlay. An overlay is a 2D map on top of the 3D model.
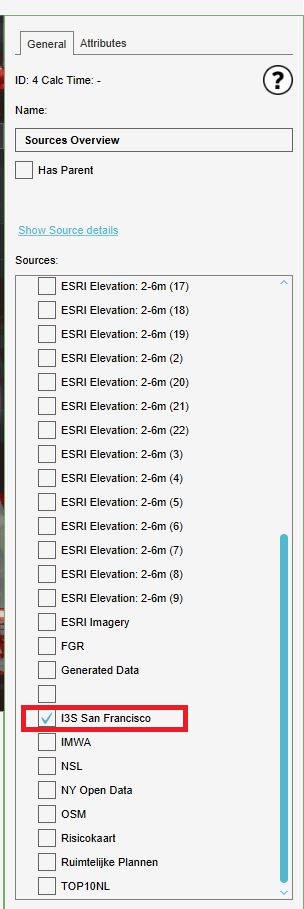
2. Check the I3S San Francisco data.
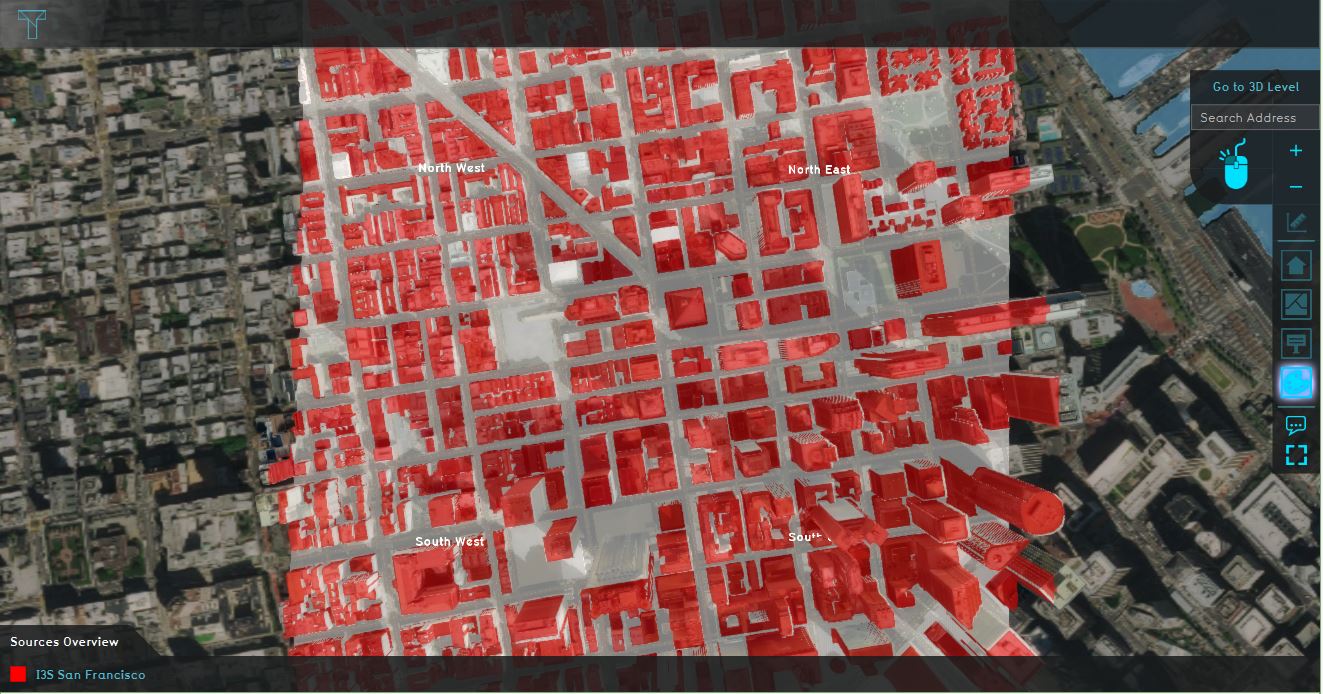
2. Notice that almost all buildings are created from this dateset.
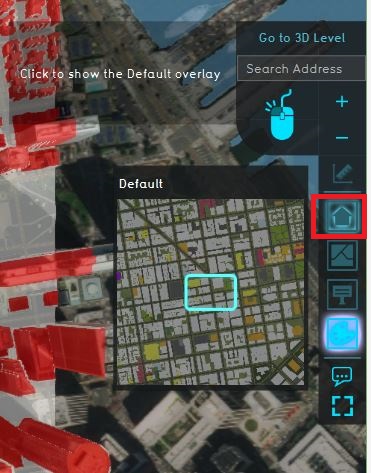
4. Click on the City overlay to go to the default view.
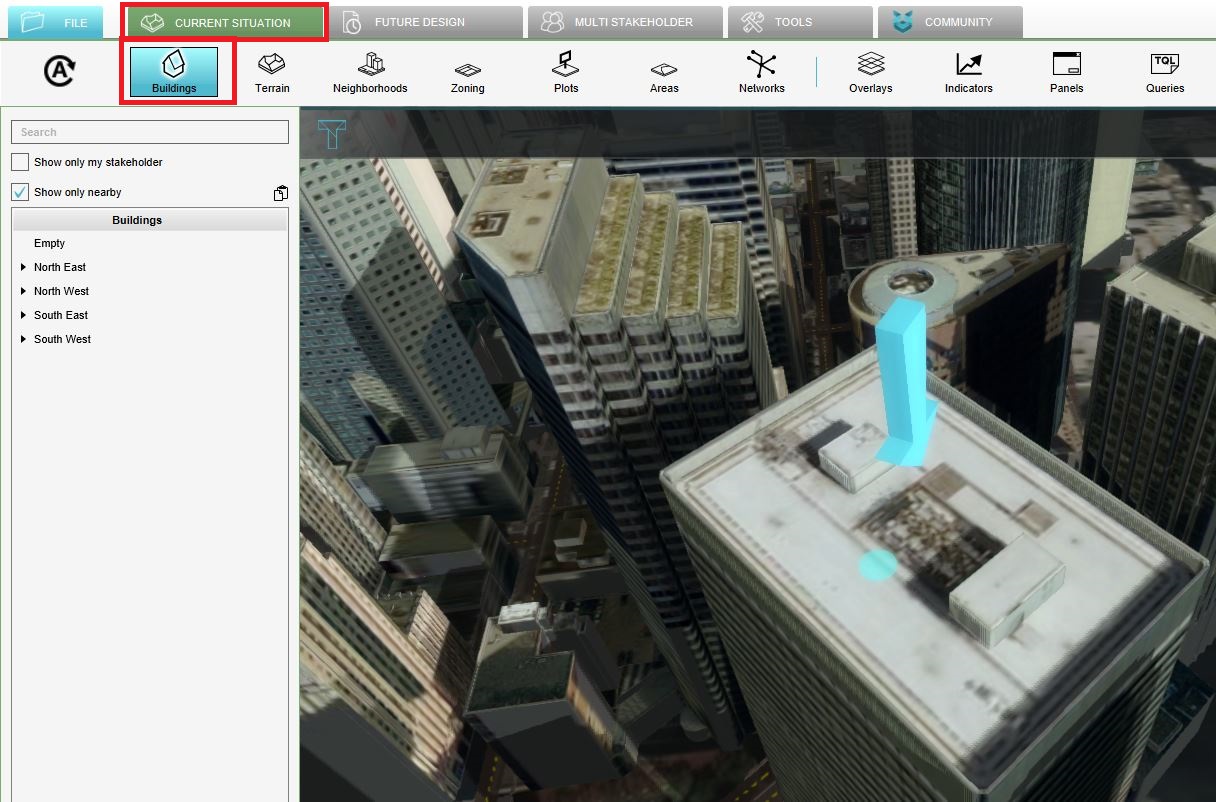
5. Click in the Current tab on the Buildings button and click on the building with the arrow.
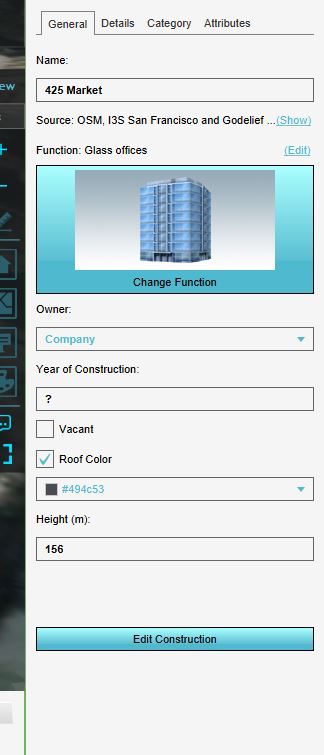
5. The attributes of the building.
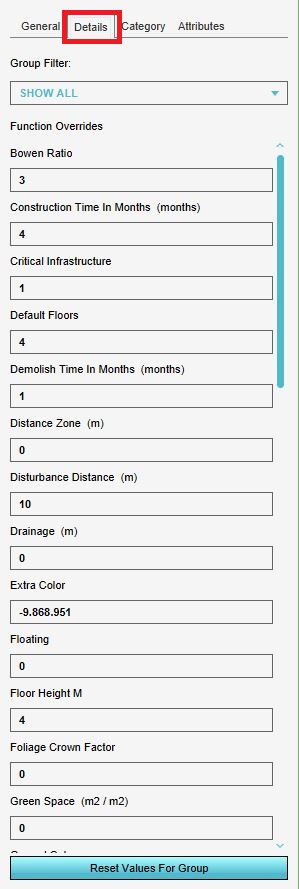
6. Click on the Details tab to see the Function values.
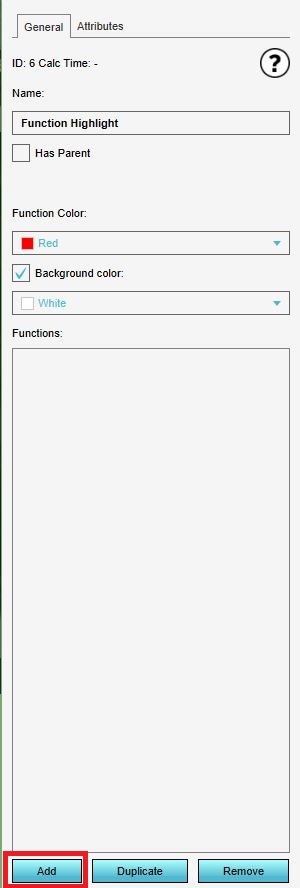
8. Click on the Add button in the right panel.
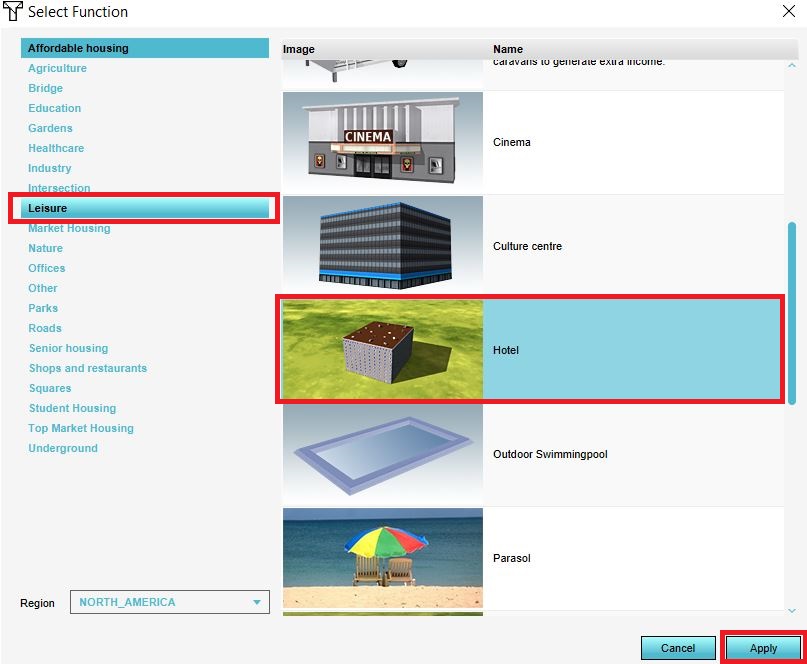
9. Select from th category Leisure the Hotel function.
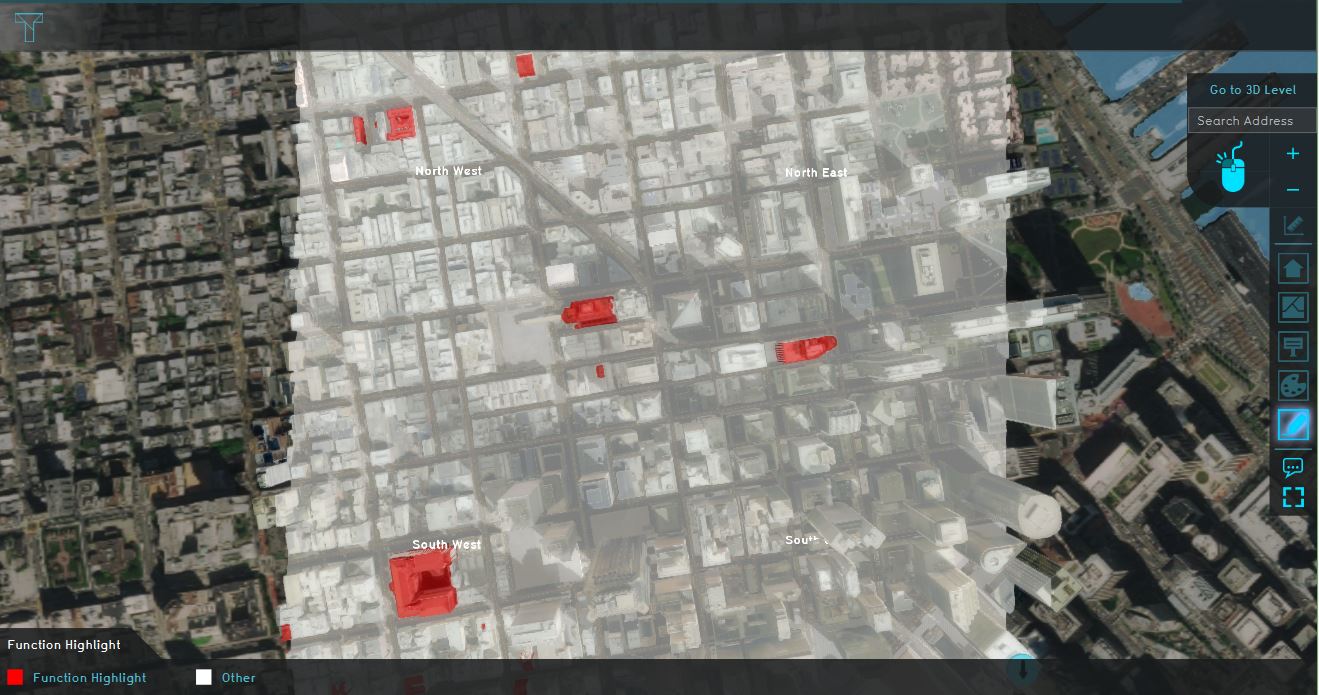
10. A map with the hotels in the project.


FAQ
- How can I change the texture, color or shape of a 3D model?
- You can change the look of most 3D models manually in the editor, only Landmarks are fixed in their appearances. You can select the model you would like to change in the project or from the list of present buildings, and change color and texture on the right side of the editor window. You can also change the shape of most models by using the brush functionality.
See also: How to draw buildings and Changing buildings
- How do I import new 3D models?
- You can upload most Geo file formats in the Tygron Platform with the Geo Data Wizard. This way you can let the Tygron Platform generate 3D models based on your imported data values. This can be done starting with generic 3D placeholder buildings up to photo-realistically wrapped buildings (SLPK/ i3s). It is advised to first read the following articles:
- -Geo Data
- -How to prepare Geo Data
- -Custom Geometry
- -SLPK
- If you already have a specific 3D model you would like to use, the model needs to adhere to the following: Tygron Platform 3D model guidelines (PDF)
- How do I delete 3D models?
- You can select the model to be deleted, by clicking on it in the 3D Visualization or by selecting it from the list of buildings. You can then select to remove the building.
See also: Removing buildings
- Why do some 3D models seem to float in the 3D Visualization?
- If imported buildings float, usually the floor/ ground level attribute is not correctly configured in the Geo data file used for the import. When the building is already generated by the Tygron Platform, the most common cause is that the building is close to an edge or other difference in terrain elevation and due to rounding off of grid cells or height sectors the building (partially) floats.
See also
- New Project Wizard
- How to use I3S data for creating a new project
- Video tutorial on creating a new project
- How to highlight data