How to add the Aerius Overlay
Jump to navigation
Jump to search
This functionality is currently unavailable or non-functional.
The Aerius Overlay shows the calculated results of the Aerius Module. The overlay visualizes the NOX and NH3 deposition on Natura 2000 areas.
How to add the Waterwijzer Overlay to a project:
- Hover over the "Overlays" button in the Ribbon, and click on "Add Aerius Overlay".
- In the left panel, select the newly added Aerius Overlay.
- In the right panel, click on "Configuration Wizard".
- In step 1, import/select traffic intensity data or go to the next step
- In step 2, import/select traffic congestion data or go to the next step
- In step 3, import/select building-related emission data or go to the next step
- In step 4, import/select construction machine categories and fuel usage data or go to the next step
- In step 5, import/select plan amounts data or go to the next step
- In step 6, choose which result types you would want to see and in the next step choose the calculation year.
- Finish and close the wizard.
- If neccesary, recalculate the overlay.
- The Aerius Overlay now shows the calculated results.
-
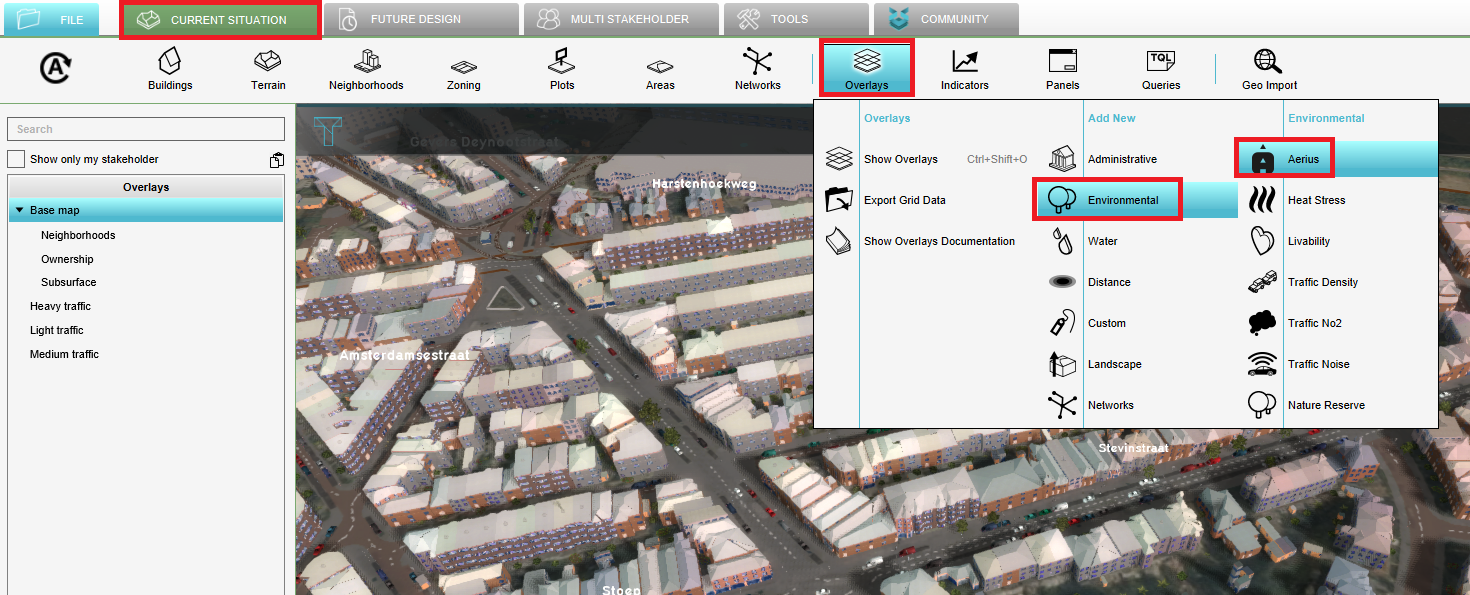 Hover over Overlays to add the Aerius Overlay
Notes
- The Aerius Overlay is normally used to calculate the effects of a new building plan on the nitrogen deposition on Natura 2000 areas. It could be that not all of the data (step 1 to 5 in the configuration wizard) for the different sectors is relevant for each use case. Take a look at the Aerius Calculator manual (in Dutch) to see which sectors are relevant for your use case.
- For an example project see the Demo Aerius Project or take a look at the description of the Aerius module test results.