Performance Overview

From Tygron Preview Support Wiki
Jump to navigation Jump to search
This article is a stub.

The Performance Overview shows the different components in your project and how long it takes before they are calculated. Each time the project is updated, all these components are being recalculated. The sum of the calculation time determines how long your projects calculates in total. This overview can be used to find the bottleneck when noticing the performance of your project is low.

The Performance Overview can be opened from the Calculation panel.
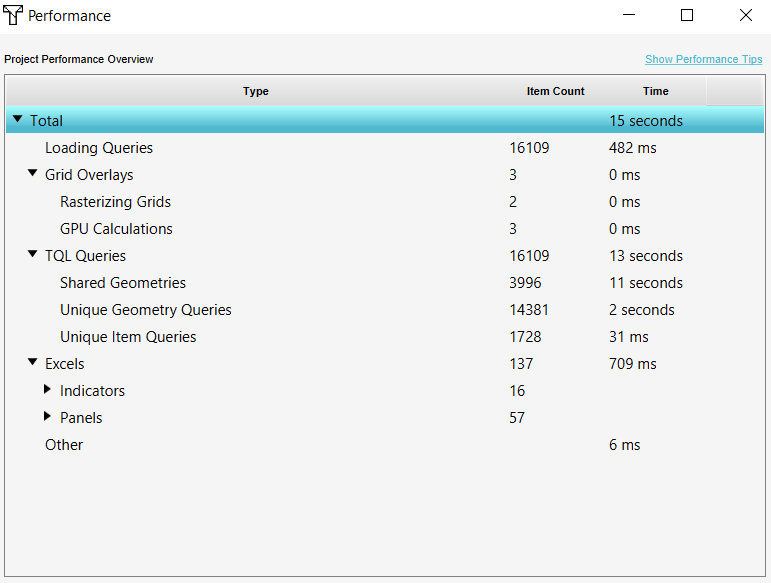
Performance overview panel.PNG

Entries

The Performance Overview is composed of a number of entries. Each entry shows a name indicating which type component it concerns, how may of those components are present in the Project, and the time it took to calculate everything neccesary which is part of that component type's grouping.

The component types are Grid Overlays, Loading and TQL Queries, Excels such as Indicators and Panels and other elements.

Total

All subsequent entries counted together form the total calculation time. This total is how long it took to perform all calculations.

Loading Queries

Grid Overlays

This sections shows the calcualtion time regarding the Grid Overlays in the project.

Rasterizing Grids

The first step regarding Overlays is rasterizing: creating rasters from the vector polygon data. This is done at once for all the Overlays in the project.

GPU Calculations

The second step is the GPU calcuation. For each Grid Overlay the calculation time is listed.

An important aspect regarding Grid Overlays and calculation time, is the grid cell size. The smaller the grid size is, the longer it takes for calculating the Grid Overlays. The calculation times for individual Overlays are also shown when selecting those Items in the Editor.

TQL Queries

If there are Excels for Indicators or Panels added to your project, there are probably TQL queries in these Excels as well. The calculation time for queries are listed here and divided into the following three categories:

Shared Geometries

Shared Geometries computed polygons which are used by multiple queries and possibly in multiple Excels. The outcome (or part of the selection) is shared, which saves time.

Unique Geometry Queries

Geometry queries are queries in which a geometry is requested, for example when selecting the Lotpolygons.

Unique Item Queries

Item queries are queries in which a property or (value value of an) Attribute is requested. Item queries are resolved a lot faster than Geometry queries.

Excels

The calculation time for Excels, used for Indicators and Panels, can be seen in this section. Note that this does not include the calculation time for the queries in the Excels, which is already accounted for in the TQL queries section.

The calculation times for individual Indicators or Panels are also shown when seleting those Items in the Editor.

For more in-depth information on why a given Excel takes a certain time to compute, a Calltree recording can be used.

Other

Other calculation times are listed here. For example, the time the Tygron Platform is sending and receiving data to and from the server is included in this total.

Notes

  • The Performance Overview panel lists only the recorded calculation times of the most recent calculation. Starting a new calculation will renew all calculation times.

How-to's

See also