Wind calculation model (Heat Overlay): Difference between revisions
No edit summary |
No edit summary |
||
| Line 1: | Line 1: | ||
The wind speed on street level (1.2 meter) is calculated using a translation of the 10 meter [[Wind_speed_(Heat_Overlay)|wind speed]] measured at a weather station. A single reduction field per wind direction can be calculated, which in turn can be multiplied with the 10 meter wind speed to obtain the wind speed at street level. The calculation model is based on the McDonald (2000) method for wind in cities. It uses the vertical surfaces of buildings perpendicular to the wind direction to determine in what way the wind speed is slowed down. The {{Template:Heat_DPRA_Report}} has extended this method with perpendicular vertical tree surfaces as well. | The wind speed on street level (1.2 meter) is calculated using a translation of the 10 meter [[Wind_speed_(Heat_Overlay)|wind speed]] measured at a weather station. A single reduction field per wind direction can be calculated, which in turn can be multiplied with the 10 meter wind speed to obtain the wind speed at street level. The calculation model is based on the McDonald (2000) method for wind in cities. It uses the vertical surfaces of buildings perpendicular to the wind direction to determine in what way the wind speed is slowed down. The {{Template:Heat_DPRA_Report}} has extended this method with perpendicular vertical tree surfaces as well. | ||
[[File:Wind_model_(Heat_Overlay).png|400px]] | |||
==Implementation== | ==Implementation== | ||
Revision as of 12:27, 30 September 2019
The wind speed on street level (1.2 meter) is calculated using a translation of the 10 meter wind speed measured at a weather station. A single reduction field per wind direction can be calculated, which in turn can be multiplied with the 10 meter wind speed to obtain the wind speed at street level. The calculation model is based on the McDonald (2000) method for wind in cities. It uses the vertical surfaces of buildings perpendicular to the wind direction to determine in what way the wind speed is slowed down. The DPRA Heat stress report has extended this method with perpendicular vertical tree surfaces as well.
Implementation
Our implementation differs slightly from the implementation described by DPRA Heat stress report. It does not do cubic interpolation from coarse grids to more detailed grids. We do all operations on a detailed grid.
Our implementation is as followed:
Average window
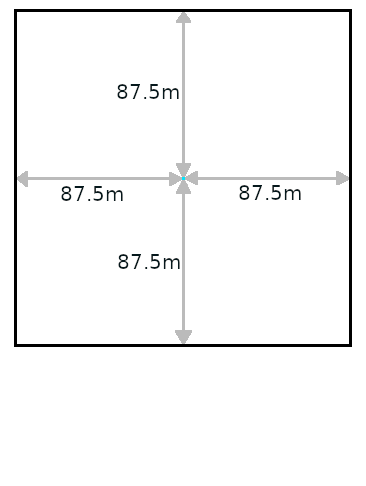
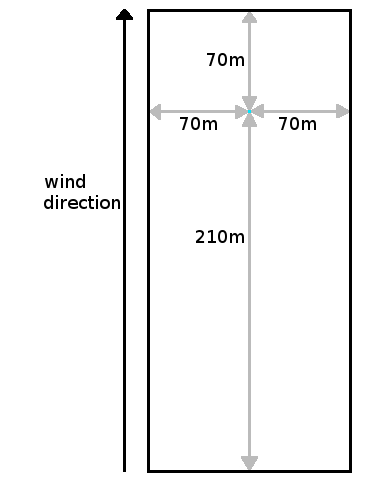
First of all, the wind window has to be selected. If the wind speed is lower than 1.5 m/s, a window of 175m x 175m is used for averaging. Otherwise a window of 140m x 280m will be used. See the image below:
Per grid cell
Per wind window grid cell:
- Determine the average obstacle height per square meter. Buildings and trees lower than 2 meters are not taken into account. It is divided by the area of the search window.
- Determine the average vertical building surface perpendicular to the wind direction. Again this is divided by the area of the search window.
- Determine the frontal surface compactness factor , separately for buildings and trees. Combine these to obtain .
- Determine the average height of trees, with 4 meters as minimum value.
- Using these values, select the correct formula parameters from the McDonald 2000 table for , , , and
- Using the obtained parameters, calculate the wind translation factor.
- Obtain the wind speed at by multiplying the wind translation factor with the measured at the weather station. Since the wind speed can still be too low, apply a correction formula to to obtain the end result.
Step 1
For each cell in the wind direction window the average obstacle height of the buildings and foliage are calculated. Only foliage and buildings with a minimum height of 4.0 area taken into account. If no obstacles were present, the average height will still be at the minimum of 4 meters.
Step 2
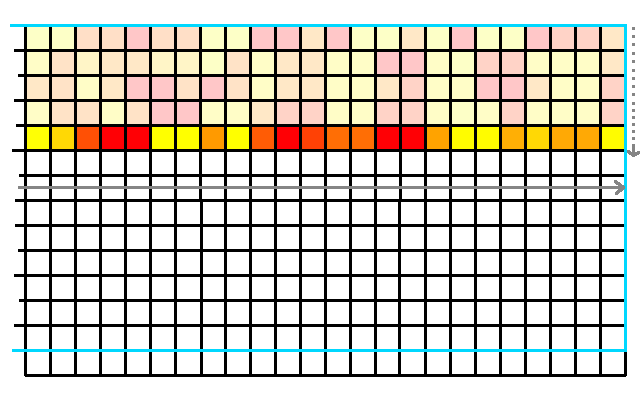
For each strip in the direction of the wind:
Check if the height of buildings is higher than the previous cell:
if and
where is the width of a cell. So we only calculate additional heights.
Next, divide by n, the amount of cells visited to obtain .
For the same process is repeated, but then with foliage heights instead of Building heights.
Step 3
First, calculate and in a similar way, described in step 2.
Next, calculate the using the and .
.
Step 4
Calculate the average obstacle height , where a minimum height threshold of 4 is used. This means it is always at least 4 meters high.
Step 5
Select the function parameters , , , and from the table using and :
| 0.05 (<0.08) | 0.066 | 2 | 0.048 | -0.35 | 0.56 |
| 0.11 (<0.135) | 0.26 | 2.5 | 0.071 | -0.35 | 0.50 |
| 0.16 (<0.18) | 0.32 | 2.7 | 0.084 | -0.34 | 0.48 |
| 0.20 (<0.265) | 0.47 | 1.5 | 0.08 | -0.56 | 0.66 |
| 0.33 (>=0.265) | 0.57 | 1.2 | 0.077 | -0.85 | 0.92 |
Step 6
Calculate the translated intermediate wind speeds:
Step 7
The obtained wind speed can be too low. Therefore it is corrected with the following formula:
This corrected value is used in the formula for PET.
Notes
- The model currently only calculates the adjusted wind speeds in the 4 main directions: North, east, south, west.
See also


