Performance Overview: Difference between revisions
No edit summary |
|||
| Line 5: | Line 5: | ||
The Performance Overview can be opened from the [[Calculation panel]] | The Performance Overview can be opened from the [[Calculation panel]] | ||
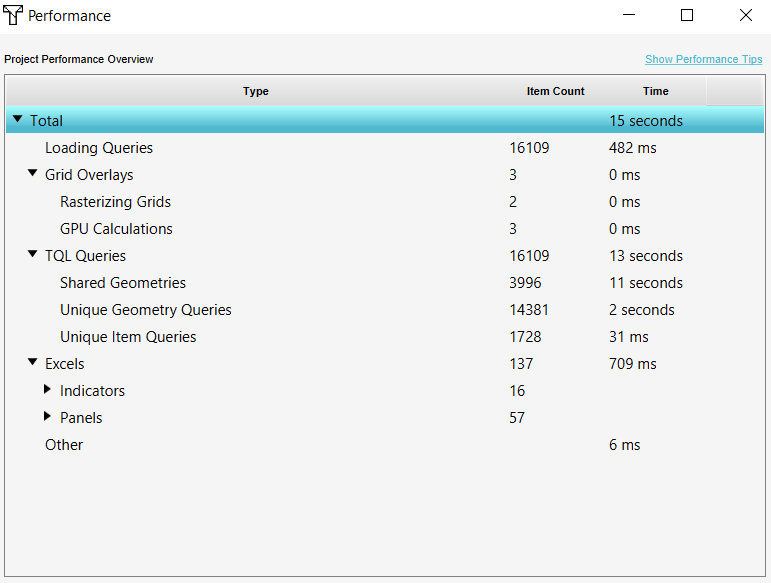
[[File:Performance_overview_panel.PNG||450px|left]] | |||
<br clear=all> | |||
===Components=== | ===Components=== | ||
The Performance Overview shows the components, the amount of items that belong to this component and the calculation time. | The Performance Overview shows the components, the amount of items that belong to this component and the calculation time. | ||
Revision as of 15:03, 19 April 2021
General
The Performance Overview shows the different components in your project and how long it takes before they are calculated. Each time the project is updated, all these components are being recalculated. The sum of the calculation time determines how long your projects calculates in total. This overview can be used to find the bottleneck when noticing the performance of your project is low.
The Performance Overview can be opened from the Calculation panel
Components
The Performance Overview shows the components, the amount of items that belong to this component and the calculation time. Components are Grid Overlays, Loading and TQL Queries, Excels such as Indicators and Panels and other elements.
For more information about these components, see this video:

