Traffic visualization: Difference between revisions
Jump to navigation
Jump to search
No edit summary |
No edit summary |
||
| Line 1: | Line 1: | ||
{{stub}} | {{stub}} | ||
[[File:Traffic intensities on roads.jpg|thumb|right|Traffic intensities visualized on roads.]] | |||
Traffic is visualized on [[Construction]]s with a Road [[Function Category]]. The visualization provides a visual indication to users about the traffic intensities in any [[Project]]. The greater the amount of traffic, the more traffic is visualized. | |||
The traffic visualization is based on | |||
==Configuration== | ==Configuration== | ||
Revision as of 12:29, 25 February 2022
This article is a stub.

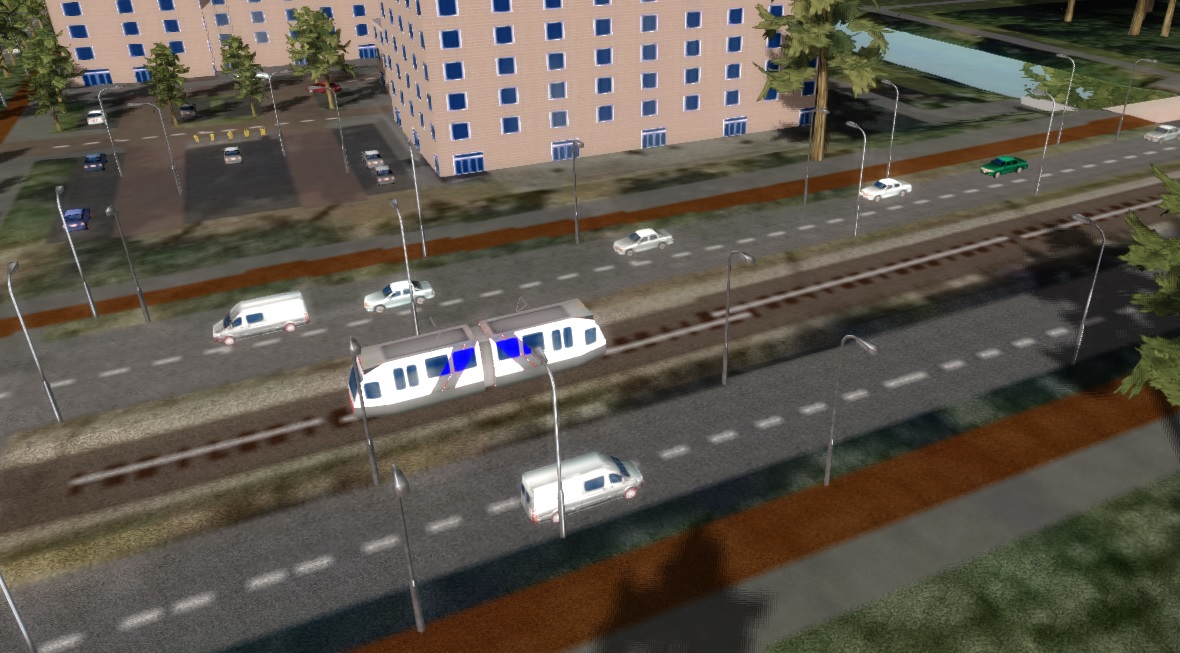
Traffic is visualized on Constructions with a Road Function Category. The visualization provides a visual indication to users about the traffic intensities in any Project. The greater the amount of traffic, the more traffic is visualized.
The traffic visualization is based on
Configuration
Visualization is based on:
- Traffic intensities
- Speedlimit (Function Value)
- Lanes (Function Value)
Units
- Main article: Units
Visualized vehicles are Units. Depending on the specific traffic intensities configured and the Units configured in the Project, specific vehicles are visualized on roads.
Notes
- The visualized traffic is multiplied by a factor which is part of the Settings of a Project, which can be edited as part of the properties of a Traffic Density Overlay. It's possible to (temporarily) add a Traffic Density Overlay, change the setting, and then remove the Traffic Density Overlay if it is otherwise not or no longer required.
- The traffic visualization multiplier has no effect on calculation models such as the Traffic Overlays.
