Geo Plugins tutorial: Difference between revisions
| Line 338: | Line 338: | ||
===Using a Template with a Geo Plugin for GeoShare data=== | ===Using a Template with a Geo Plugin for GeoShare data=== | ||
Data on the [[GeoShare]] can be automatically added to a [[Project]] at [[Project generation]] as well. To do this, the [[Geo Plugin]] requires a configuration of a related [[Project Source]], in a similar fashion as a [[WFS]]. A new [[Project Source]] definition must be created for the dataset which is currently present on the [[Geo Share]], and that [[Project Source]] can then be referenced by the [[Geo Plugin]]. | Data on the [[GeoShare]] can be automatically added to a [[Project]] at [[Project generation]] as well. To do this, the [[Geo Plugin]] requires a configuration of a related [[Project Source]], in a similar fashion as a [[WFS]]. A new [[Project Source]] definition must be created for the dataset which is currently present on the [[Geo Share]], and that [[Project Source]] can then be referenced by the [[Geo Plugin]]. | ||
First, the file on the [[GeoShare]] must be made available as a [[WFS]] . This can be done by creating a [[GeoShare Viewer]] for the file. | |||
In the editor, go to: | |||
{{editor location|geo share}} | |||
Navigate to the location where the file created earlier was stored. | |||
In the bottom of the [[Geo Share]] window, click on "Add Viewer". A prompt will appear allowing the selection of a file to be included in the [[Geoshare Viewer]]. | |||
Enter a name for the new viewer. For the purpose of experimentation, the viewer can be named "geoplugin tutorial viewer", for example. | |||
Select the file created earlier, and confirm. Then, opt to not add any additional layers to the [[Geoshare Viewer]]. | |||
A new viewer is now added to the [[Geo Share]], named "geoplugin tutorial viewer". | |||
Click on the viewer's "edit" icon. This will show the details and content of the viewer. | |||
Click on the "WFS Link" link. A web browser (or new tab in the web browser) will open for the WFS which related to the viewer and its contents (and thus also the geojson file). Copy the address of the page which is open in the web browser. | |||
In the editor, go to: | In the editor, go to: | ||
Revision as of 11:11, 31 October 2023
Prerequisites
The following prerequisites should be met before starting this tutorial:
- Parts of this tutorial are a continuation of the Template Project tutorial. If you have not yet followed the tutorials related to those subjects please do so first.
- This tutorial can best be started with a Project in the city of The Hague in the Netherlands, due to one of the used data sources being specific to that city. Note that multiple new Projects will be created during this tutorial.
- To work with Project templating functionality fully (specifically, to assign Template status to a Project), either Domain Admin access rights are required, or the assistance of a Domain Admin for your organization is required.
Preparations
Take the following steps as preparation for following this tutorial:
- Start your project. This can be a pre-existing project, or a newly created project.
Create a dataset for the tutorial
Any Project may contain any number of Geo Plugins. However, for the purpose of this tutorial a Project in a specific location is required, due to some of the steps relying on a data source which has data only in a specific region.
Find an open spot in the project area using the 3D Visualization.
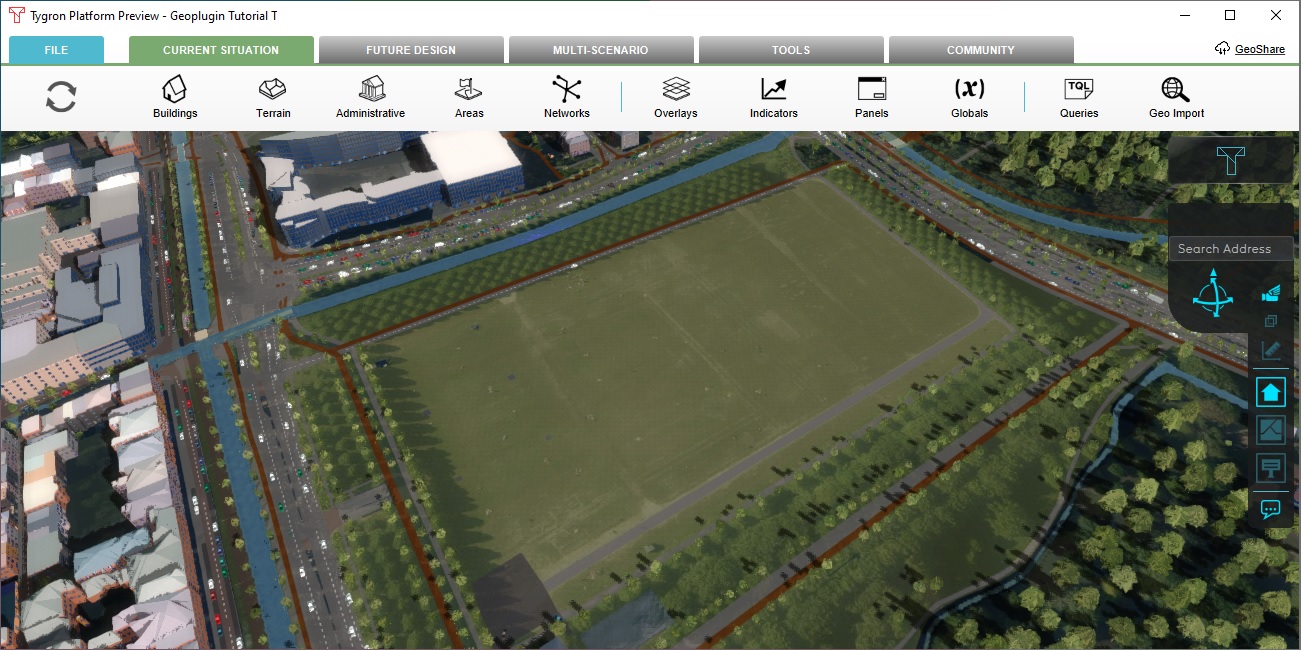
In this spot, data can be created which can then be set up to import.
Draw 3 Areas. They can be any shape or orientation. However, ensure they do not overlap.
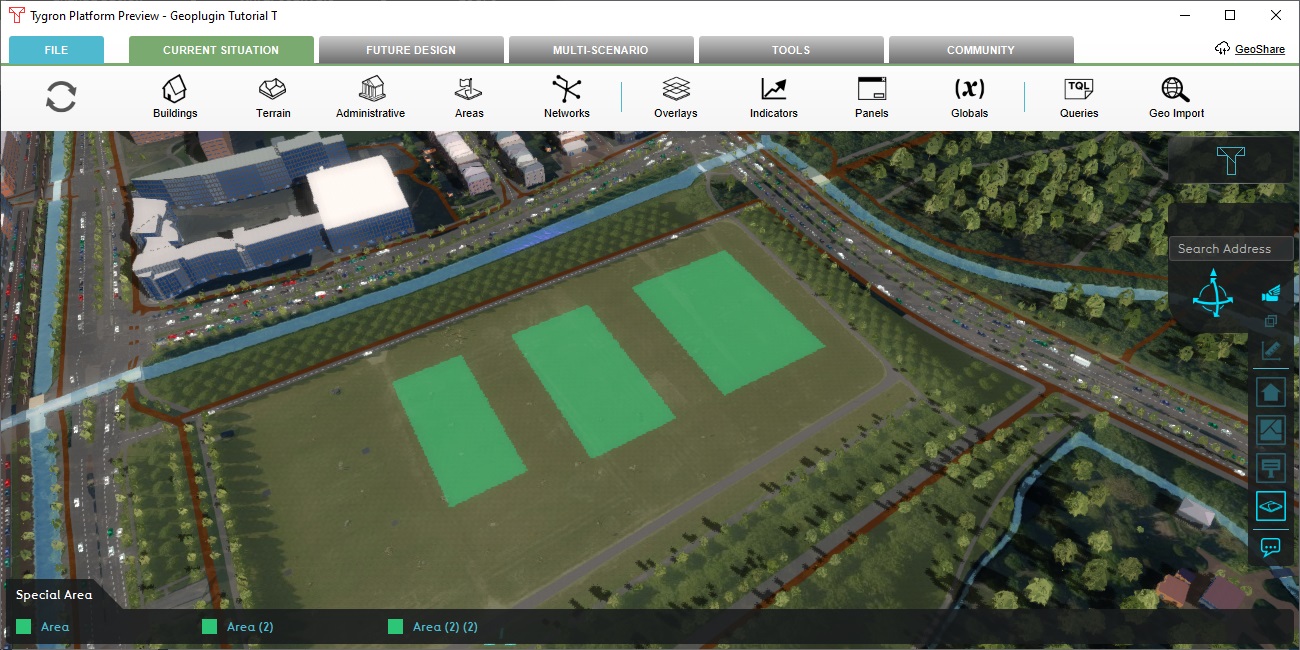
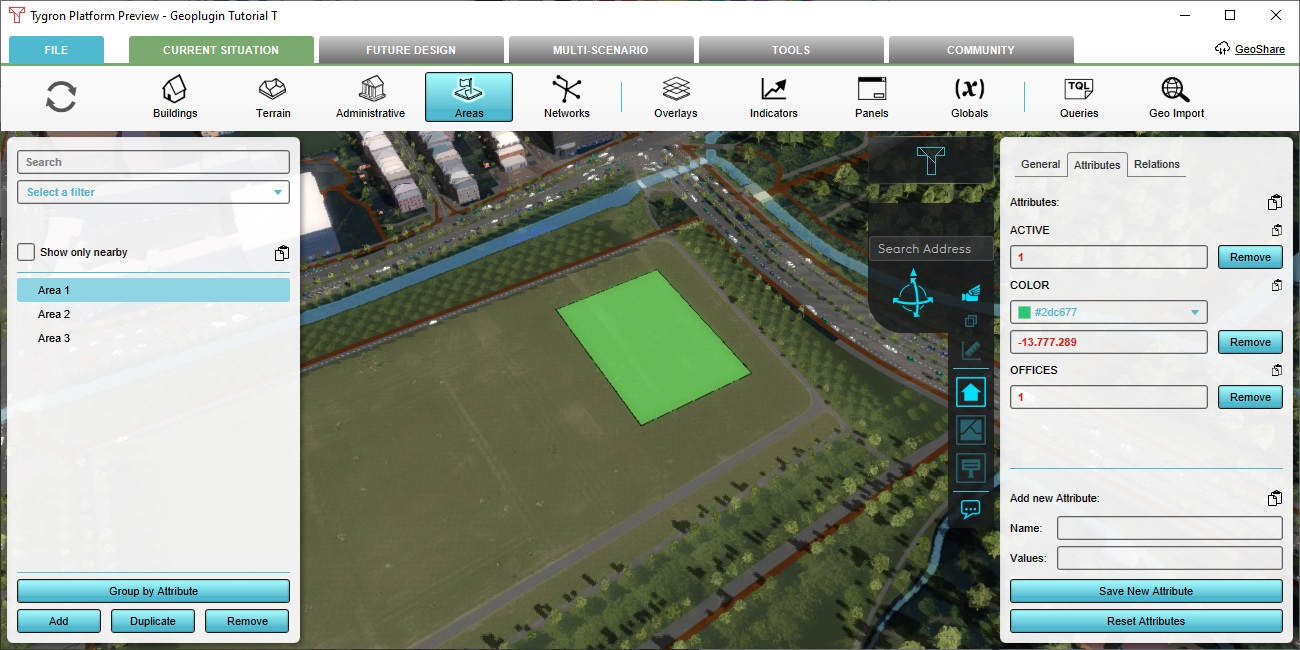
Give one of the Areas an "OFFICES" Attribute, with value 1.
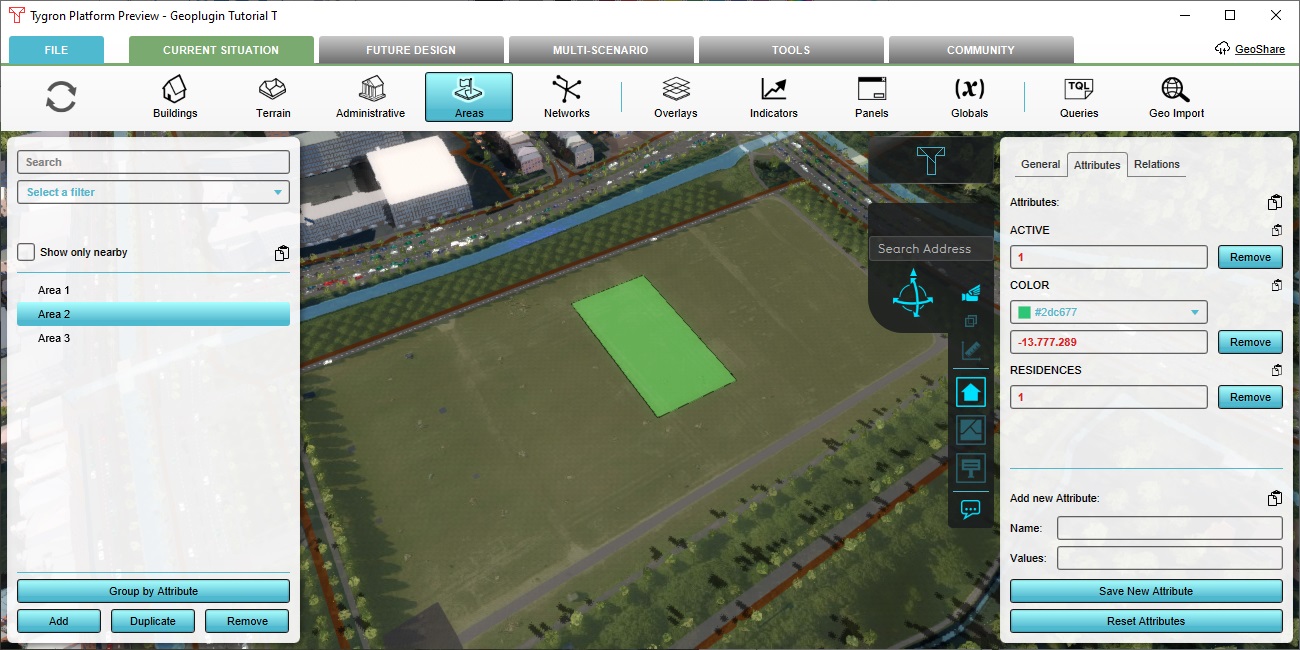
Give another of the Areas a "RESIDENCES" Attribute, with value 1.
Give each of the Areas a "GREEN_HEIGHT" Attribute, with values between 10 and 25.
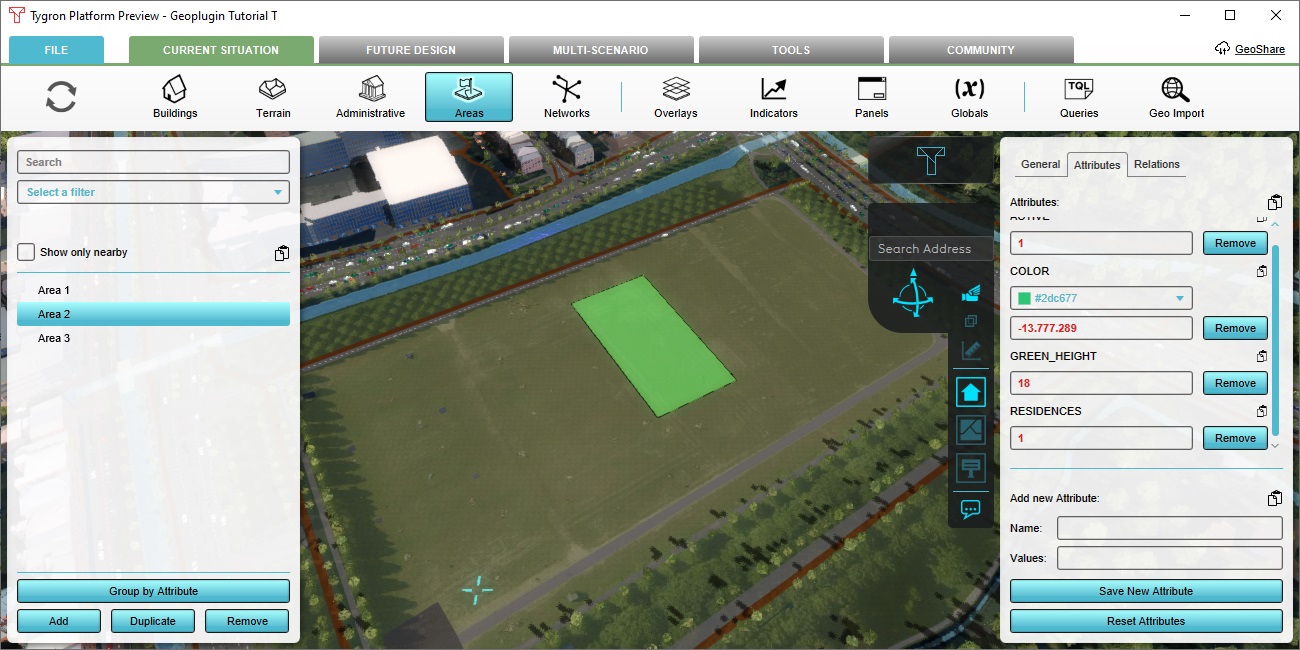
The result should be:
- An Area with both a RESIDENCES Attribute, and a GREEN_HEIGHT Attribute.
- An Area with both an OFFICES Attribute, and a GREEN_HEIGHT Attribute.
- An Area with just a GREEN_HEIGHT Attribute.
In the editor, go to:
This opens the window for exporting the Areas' geo data.
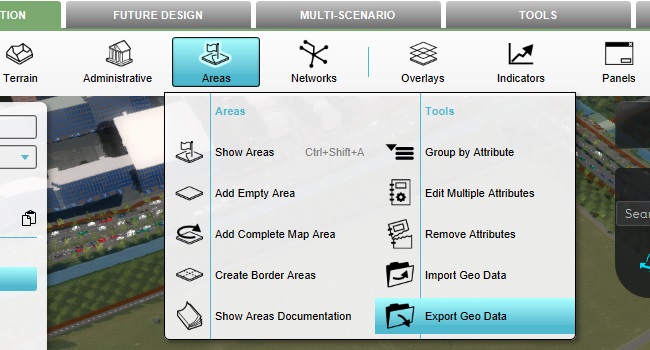
Opt to export the created Areas as a GeoJSON to the Geo Share. This will create a small file in your Domain's Geo Share space, which can be used as a source for geo data.
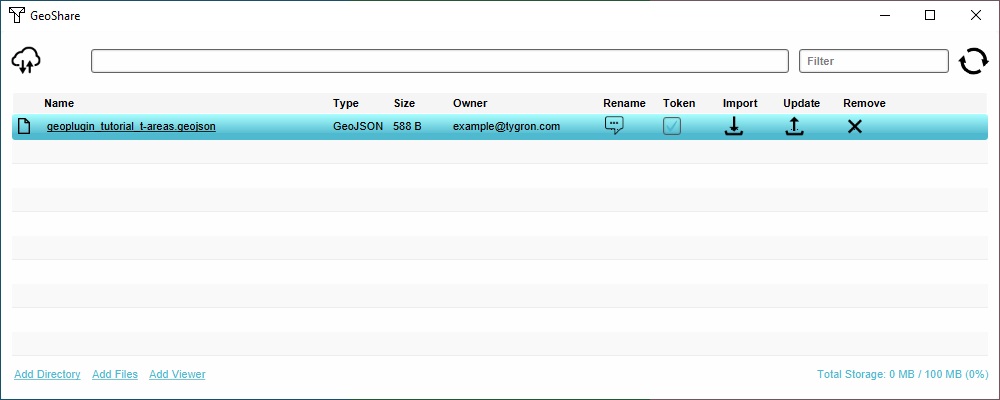
The file on the Geo Share now exists separately from the Project and Session it originated from. This file will be used a few times further in the tutorial.
Introduction to Geo Plugins
The Tygron Platform allows for the importing of geo data to enrich a Project. This can serve to both amend data which the Tygron Platform already supplies, but also to add types of data which are unique to the use-case at hand. When importing data, almost all of the related operations are to determine precisely how the imported data relates to the potential data types and subtypes available in a Tygron Platform Project.
Geo Plugins offer a way to store such a mapping, so that import operations can be easily repeated. In them, information is stored about which data can be found in the relevant data source, and how that data should be interpreted or modified when it is imported. They can then be used when manually importing data, but can also be called upon when a new Project is created to automatically obtain data relevant for the use-case and models the Template Project entails.
Using the Geo Import Wizard with a Geo Plugin
One of the most important benefits of Geo Plugins is the ability to define a mapping between data in a data source, and the various Functions available in the Tygron Platform. The benefit of this is that the details of how such an import is to be configred is reproducibly prepared.
Such a Geo Plugin can then be used while importing mapped data (Buildings and/or Measures), such as the dataset created earlier, and saved to the Geo Share.
Geo Plugin for Buildings
In the editor, go to:
At the bottom of the left panel, set the type selection to BUILDINGS, and then opt to add a Geo Plugin of that type. It will appear in the list.
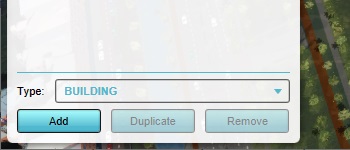
In the right panel, set the name of the Geo Plugin to "Geo Plugin for Buildings".
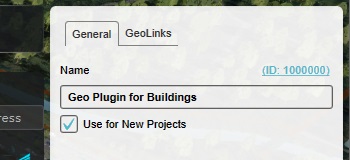
In the right panel, select the GeoLinks tab
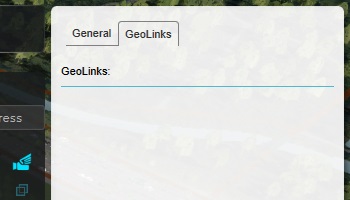
At the bottom of the right panel click on "Add" to create a Geo Link.
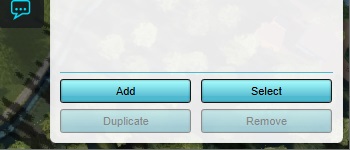
Select the Geo Link. The bottom panel will appear with details for the Geo Link.

A Geo Link is a specific connection which can be applied to any feature. Based on the configuration of the Geo Link, a feature will either be processed and imported, or it will not be processed by this Geo Link. With multiple Geo Links in a Geo Plugin, every feature is checked for whichever Geo Link has the best match (if any) and then that Geo Link will dictate how the feature is imported.
This first Geo Link will be a linkage for data to interpret features in geo data as offices.
Change the name of the Geo Link to "Offices link".
Click on "Select Function", and select any office Function.

Switch to the bottom panel's "Matching Attributes" tab. This allows configuring which attributes (and if desired, which values for those attributes) should be found in a feature for it to be processed by this specific Geo Link.

Add an Attribute.
Double-click to edit it, and change the Attribute to "OFFICES".
This completes the configuration of this Geo Link.

In the right panel, add another Geo Link.
Set the Geo Link's name to "Residences link", and set the Function to any residential Function, such as "Affordable Housing".

Under "Matching Attributes", add an Attribute, and change that Attribute to "RESIDENCES"

Import Buildings using the Geo Plugin
Now that the Geo Plugin is set up, it can be used while importing geo data.
In the editor, go to:
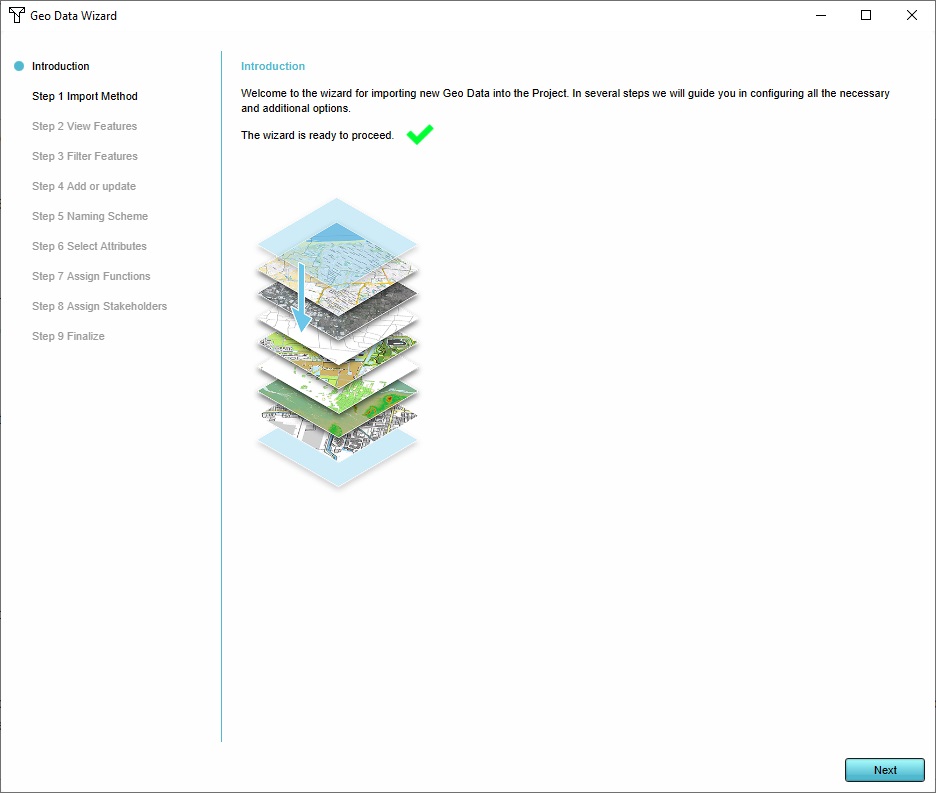
As data source to import data from, opt to import a GeoJSON.
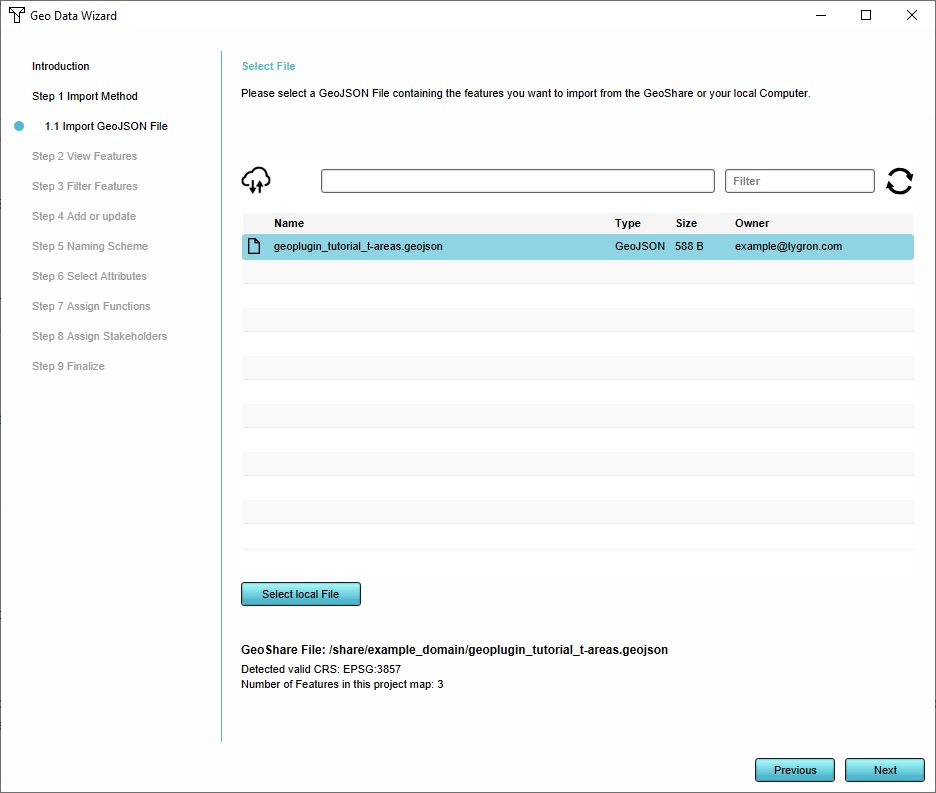
Select the file which was created earlier and stored on the Geo Share. It should be easily parsed and recognize 3 features.
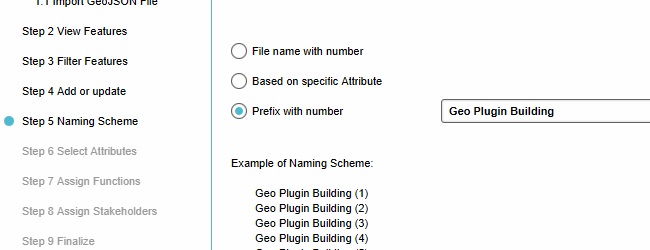
Continue to the step regarding names, and opt to create names based on your own prefix. Enter a name along the lines of "Geo Plugin Building".
Continue to the step regarding Function Mapping. In that step, opt to use a Geo Plugin, and select the Geo Plugin created earlier.

Continue through the rest of the steps of the import wizard, and finish it. The Buildings will now appear in the 3D Visualization.
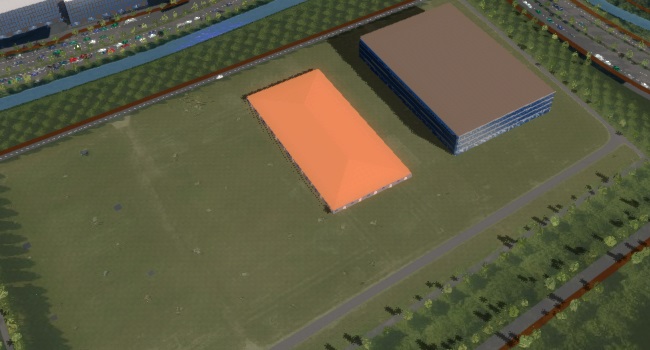
Notice that although there are 3 features in the dataset, only 2 features are loaded in. This is because the Geo Plugin has a few Geo Link which the features can match with, and 1 of the features is not matched by any of the Geo Links. Contrary to how the Geo Data Wizard's manual mapping options structurally defines a default Function for any unmatched features, an import with a Geo Plugin will ignore features which are not matched by any of the Geo Links.
Using a template with a Geo Plugin
One of the most important benefits of Geo Plugins is that they can be configured to automatically include data when a Template Project is used to create a new Project. While the new Project is created and the Tygron Platform establishes connections to external data sources, any active Geo Plugins define additional connections which should be used to obtain more data for the Project automatically.
To do this, the Geo Plugin requires a configuration of a related Project Source as well. The Tygron Platform allows for the selection of a number of Project Sources known by default, and also the addition of alternative Project Sources which can provide more data.
Geo Plugin for WFS
Geo Plugins are best used as connectors to live data sources with coverage for all potentially relevant areas a Project or Template may apply to. A WFS is commonly available as a service offering relevant features. Such a Geo Plugin will require some additonal details related to the specific service which is to be consulted.Specifically, a WFS is structured in layers and is usually queried in parts, which means some configuration must be provided to properly request the relevant data from it.
In the editor, go to:
At the bottom of the left panel, set the type selection to AREAS, and then opt to add a Geo Plugin of that type. It will appear in the list.
In the right panel, set the name of the Geo Plugin to "Geo Plugin for districts".
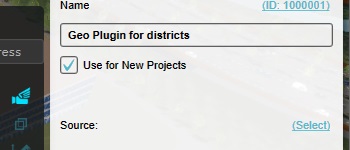
In the right panel, find the "Source" configuration option, and click on "Select". This will again open the "Select Source" screen.
Select the Source "CBS Buurten".
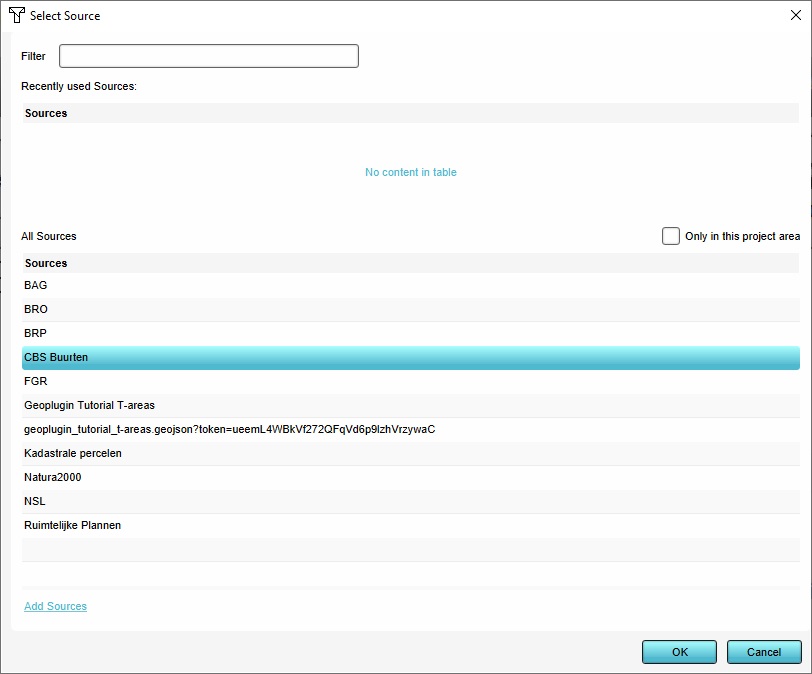
Click "OK" This will close the "Select Source" window.
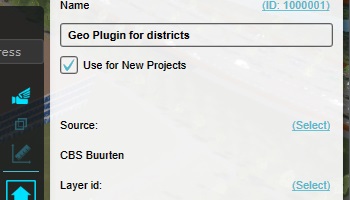
In the right panel, find the "Layer id" configuration option, and click on "Select".

This will open the "Layer selection" prompt.
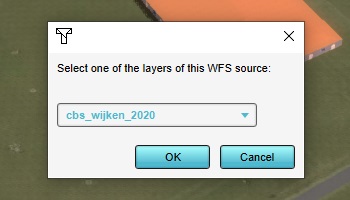
Select the "wijken" layer (the name may differ slightly), and click "OK". The "Layer selection" prompt will close, and the "Layer id" will be filled out in the right panel.
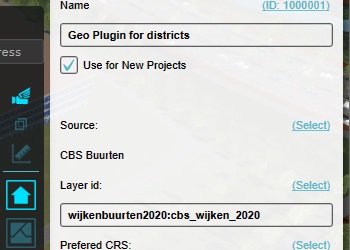
Additional inputs have appeared in the right panel.
Find the "Name Attribute" configuration option, and click on "Select".

This will open a prompt with which to select the name Attribute. Areas created by this Geo Plugin will have a name based on what the original feature had as a value in this Attribute.
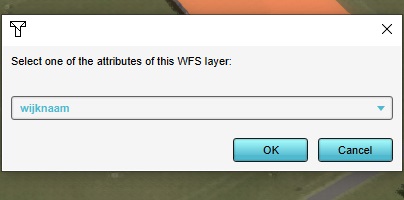
Select the attribute "wijknaam", and click "OK". The prompt will close, and the "Name Attribute" will be filled out with the name of the selected Attribute.
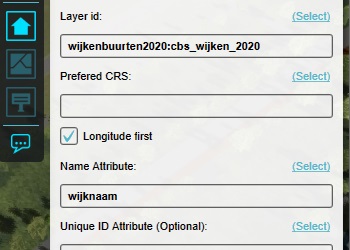
Find the "Unique ID Attribute" configuration option, and click on "Select".

This will open a prompt with which to select a uniquely identifying Attribute of the source data. This is important when data can be queried for large extents, as larger extents will require multiple queries to obtain all the data. To prevent the same feature to be loaded in multiple times, the features are checked to have a uniquely identifying Attribute, and duplicates are discarded.
Select the attribute "wijkcode", and click "OK". The prompt will close, and the "Unique ID Attribute" will be filled out with the name of the selected Attribute.
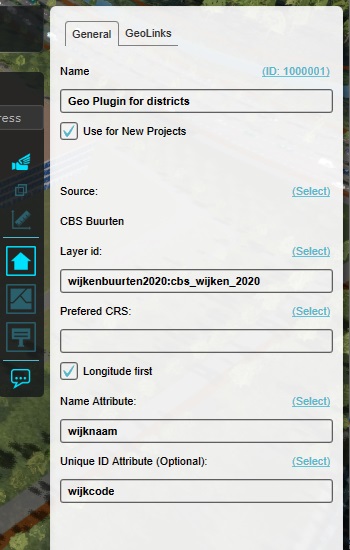
The configuration of the Geo Plugin is now such that it should refer to the dataset of districts of the dutch CBS, using the "wijknaam" (district name) as the name for the resulting Areas in the Project, and using the "wijkcode" (district code) to uniquely identify the features so as to prevent duplicates.
Using a Template with a WFS Geo Plugin
Save the Project.
- Note that you may have to set the editing rights to "WRITE" before you can save the changes. If this is the case, set the editing rights to "WRITE", then save the Project, and then set the editing rights back to "READ".

Exit the Project. As the Project has just been explicitly saved, the Project does not need to be saved on close again.
Restart the Tygron Platform application.
In the main menu, opt to create a new Project and select the Template Project created so far.
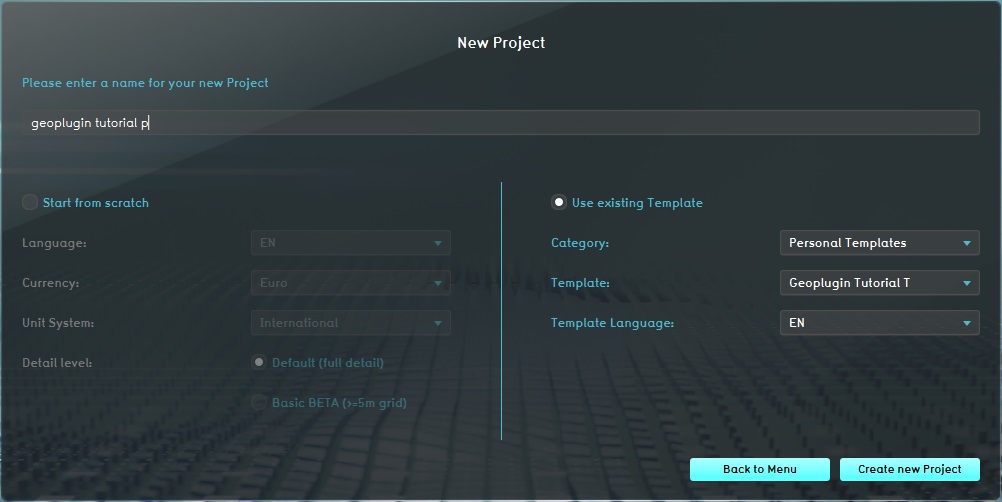
In the location selection screen, it is recommended to again place the location selection on approximately the same location as the Template Project is on. For the demonstration of the WFS, the location can vary more as the dataset has coverage on all of the Netherlands.
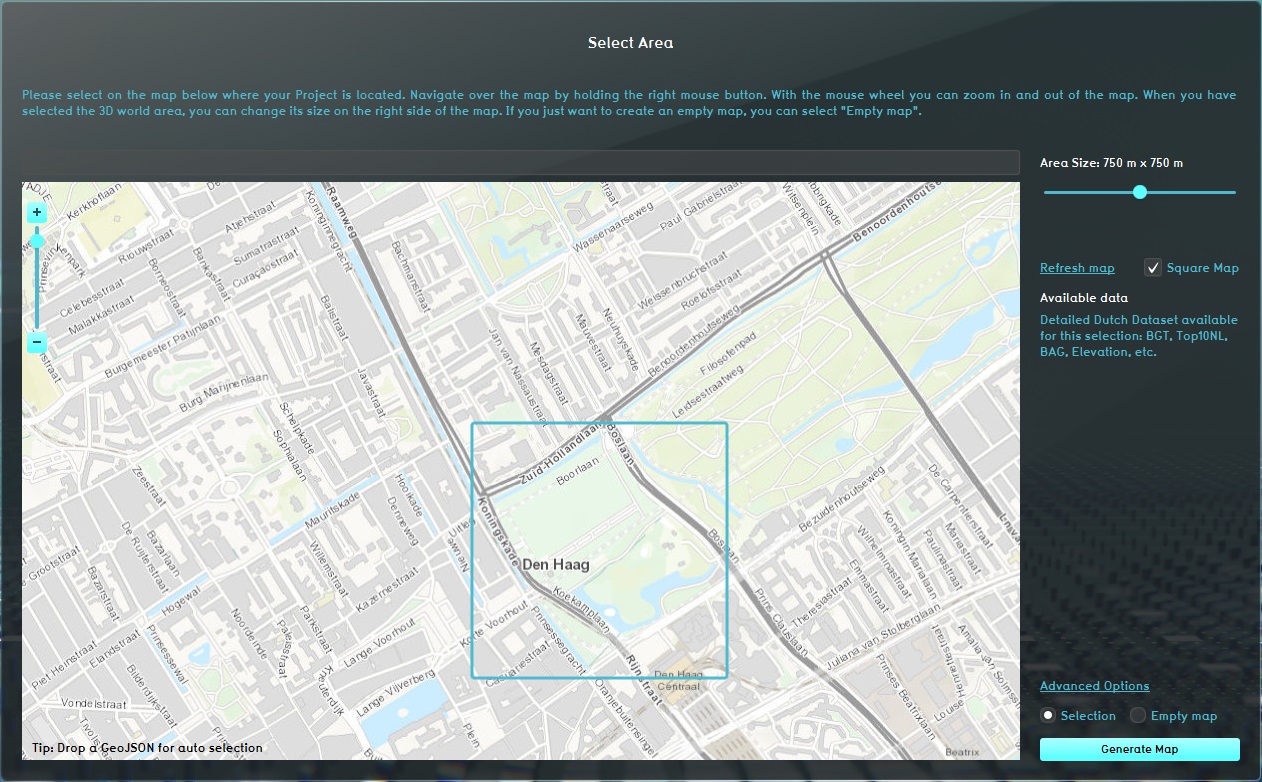
Start the map creation process.
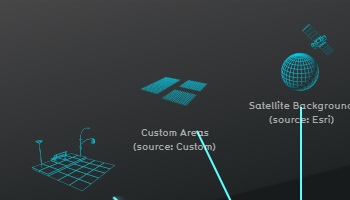
While the data is being collected from the various data sources, notice an additional entry is present named "Custom Areas".
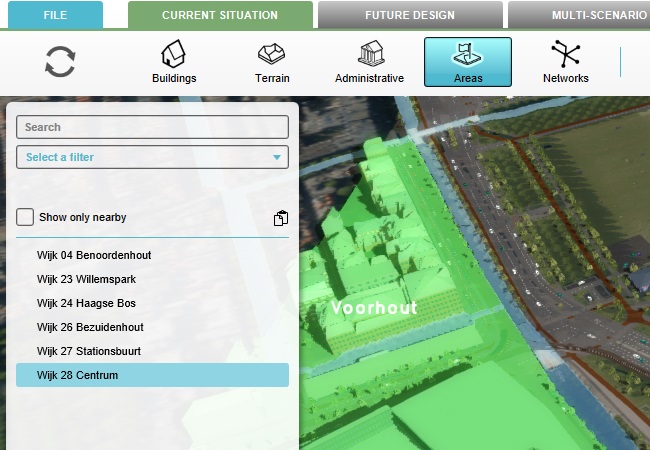
After the Project has generated and the 3D Visualization is rendered, go to:
Notice a list of Areas has been added to the Project automatically. The list of Areas is similar to the list of Neighborhoods, but is a higher-level urban subdivision.
Using a Template with a Geo Plugin for GeoShare data
Data on the GeoShare can be automatically added to a Project at Project generation as well. To do this, the Geo Plugin requires a configuration of a related Project Source, in a similar fashion as a WFS. A new Project Source definition must be created for the dataset which is currently present on the Geo Share, and that Project Source can then be referenced by the Geo Plugin.
First, the file on the GeoShare must be made available as a WFS . This can be done by creating a GeoShare Viewer for the file.
In the editor, go to:
Navigate to the location where the file created earlier was stored.
In the bottom of the Geo Share window, click on "Add Viewer". A prompt will appear allowing the selection of a file to be included in the Geoshare Viewer.
Enter a name for the new viewer. For the purpose of experimentation, the viewer can be named "geoplugin tutorial viewer", for example.
Select the file created earlier, and confirm. Then, opt to not add any additional layers to the Geoshare Viewer.
A new viewer is now added to the Geo Share, named "geoplugin tutorial viewer".
Click on the viewer's "edit" icon. This will show the details and content of the viewer.
Click on the "WFS Link" link. A web browser (or new tab in the web browser) will open for the WFS which related to the viewer and its contents (and thus also the geojson file). Copy the address of the page which is open in the web browser.
In the editor, go to:
In the right panel, find the "Source" configuration option, and click on "Select".
This will open the "Select Source" window.
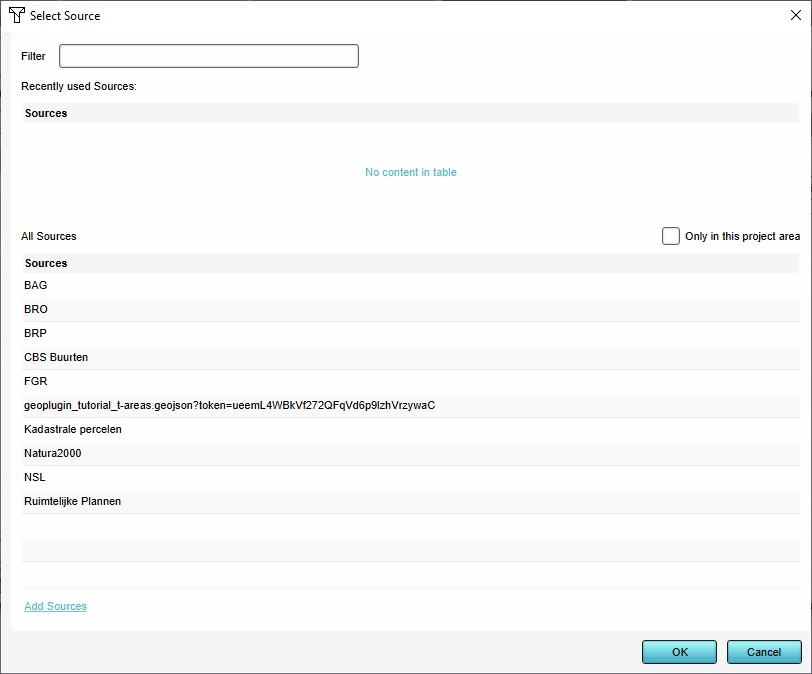
Click on "Add Source". This will open the Source Wizard.
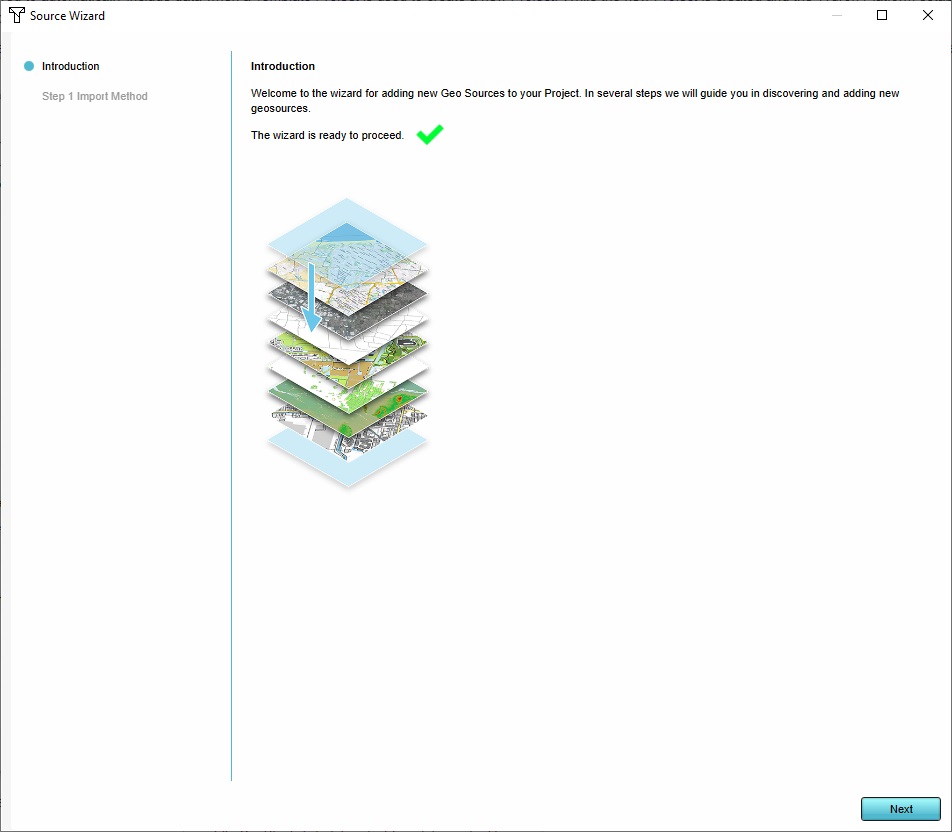
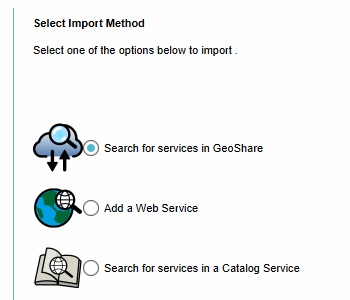
Opt to select a service found in the Geo Share, and continue to the next step.
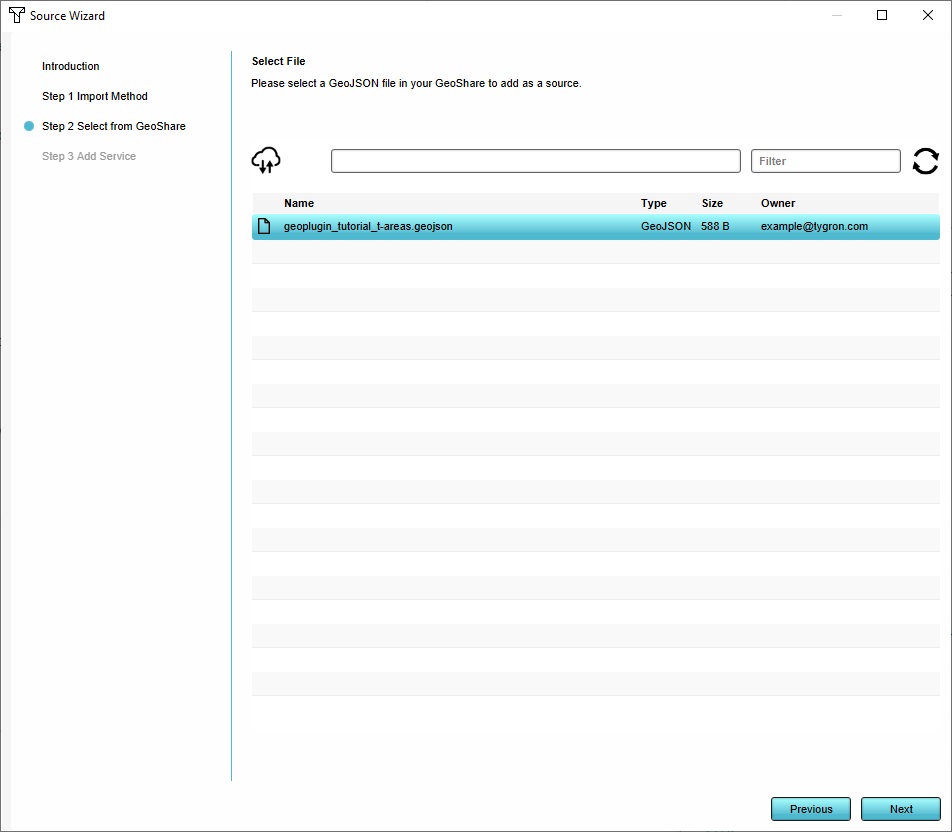
In the list of available GeoJSONs, select the GeoJSON of the previously created dataset, and continue to the next step.
In the final step, the name and the underlying URL of the Project Source can be reviewed. Nothing needs to be changed.
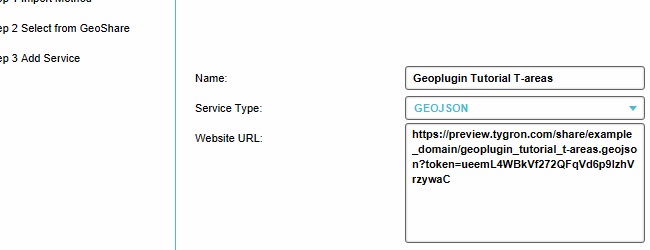
Continue past the final step. The wizard will close, and the "Select Source" window will close as well. Notice the newly created Project Source is configured in the Geo Plugin.
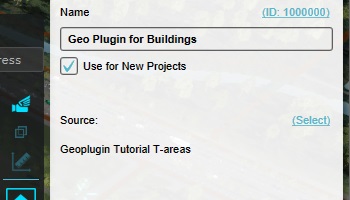
Save and exit the Project, and restart the Tygron Platform application.
In the main menu, switch to the projects overview and ensure the project created so far is set to "Template".

In the main menu, opt to create a new Project and select the Template Project created so far.
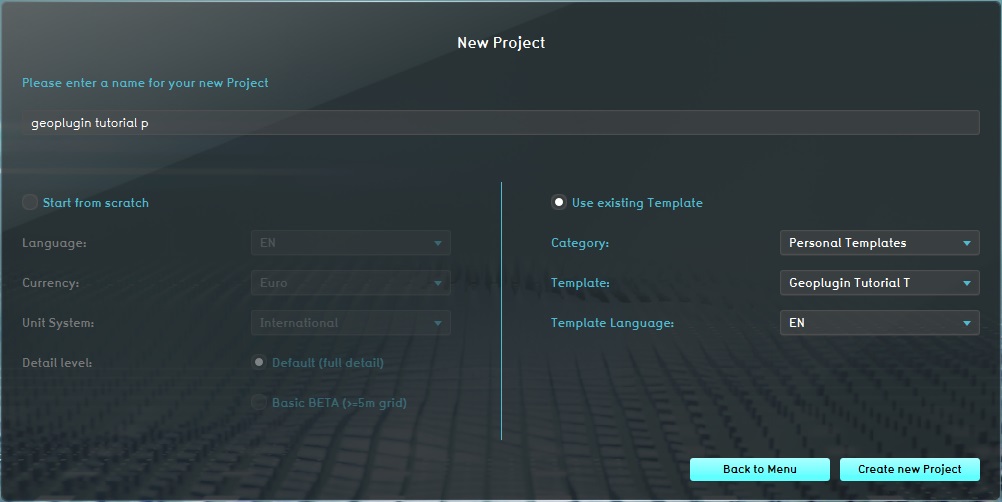
In the location selection screen, place the location selection on approximately the same location as the Template Project is on. Of importance is to have it at least cover the area where the dataset was created earlier.
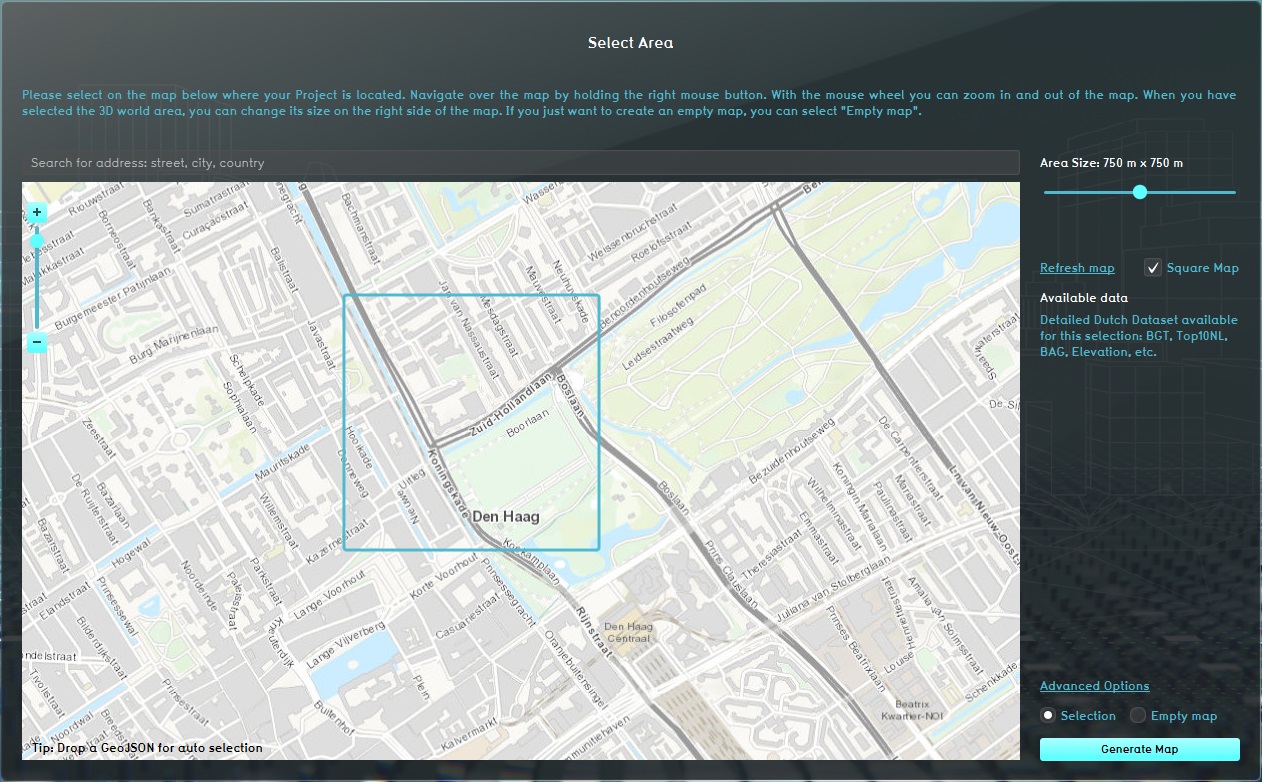
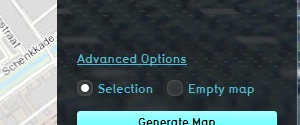
Open the "Advanced Options" panel.
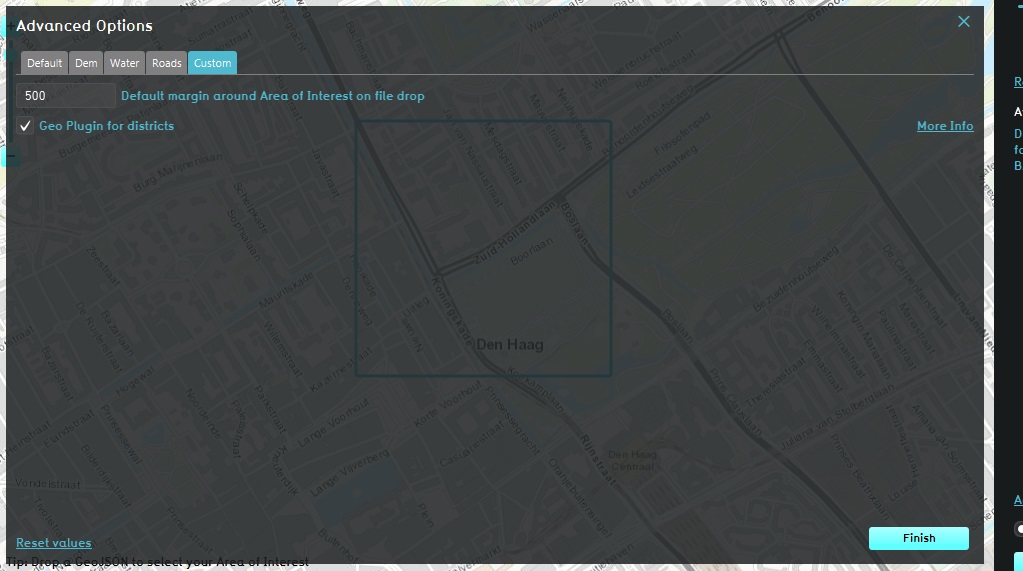
Switch to the "Custom" tab. Take note that the Geo Plugin created is listed here, and can be set to active or inactive. Ensure the Geo Plugin is active.
Start the map creation process.
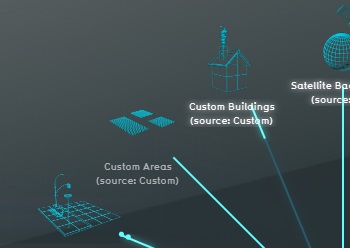
While the data is being collected from the various data sources, notice an additional entry is present named "Custom Buildings".
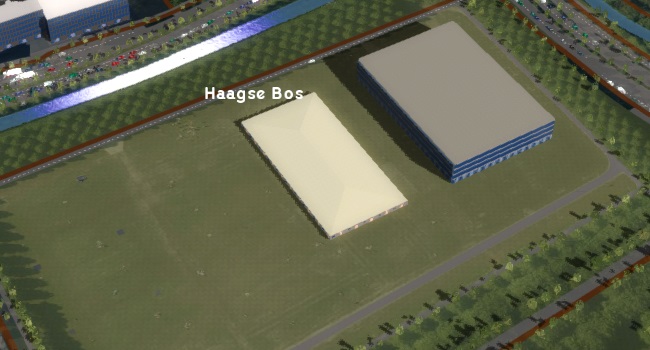
After the Project has generated and the 3D Visualization is rendered, notice that the Buildings from the created dataset are immediately present in the 3D Visualization.
Geo Plugin modifying data
As part of the importing process, Geo Plugin have the ability not only to obtain data but also to modify it to better match the calculation methodology of the Tygron Platform or of the implemented calculation models.
Reopen the Template Project in the editor.
In the editor, go to:
Add a new Geo Plugin for BUILDINGS.
Set the name of the Geo Plugin "Trees".
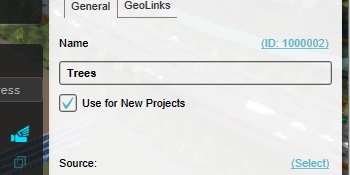
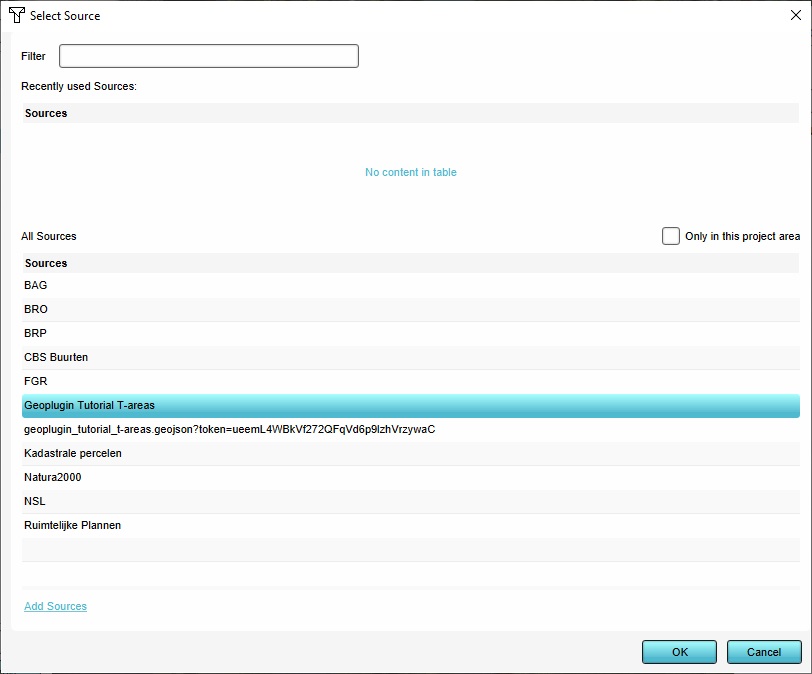
Find the "Source" configuration option and click on select to open the "Select Source" screen.
Because a Project Source for the dataset on the GeoShare was already created when creating the first BUILDINGS Geo Plugin, the source can be directly selected and confirmed without the need to create it again.
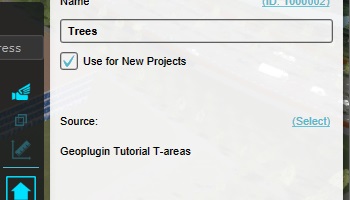
The Geo Plugin now has the source configured.
In the right panel, switch to the GeoLinks tab and add a new Geo Link. Select it.
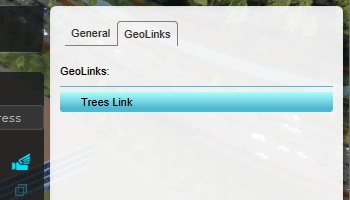
In the bottom panel, change the "Name" of the Geo Link to "Default trees".
Set the Function of the Geo Link to "Default Deciduous Trees".

The way the Geo Link is set up now it will load in the features it finds as trees. However, trees have a couple of special properties in the Tygron Platform which the original dataset may not take into account. A Geo Link can be configured to bridge that difference.
Set the "Geometry" option of the Geo Link to RADIUS_CENTERPOINT.

This option will cause a feature to not be interpreted as a polygon as it is drawn in, but as a singular point which is then consistently buffered. This is important when the source data has trees drawn stylistically (e.g. as a larger extend visually resembling the foliage) rather than as a single trunk position. Loading it in as a point will still place the tree, but will prevent directly surrounding structures from being overwritten.
Switch to the "Mapped Attributes" tab.

Add an Attribute named "GREEN_HEIGHT", and set its rename value to "FLOOR_HEIGHT_M".

This will cause the GREEN_HEIGHT Attribute, if it is present in the data, to be renamed to FLOOR_HEIGHT_M. Because the FLOOR_HEIGHT_M attribute is used to set the height of trees, this means the dataset's Attribute of GREEN_HEIGHT will now directly dictate the height of the trees loaded in via this route.
Using a Template with multiple Geo Plugins
Save the Project.
- Note that you may have to set the editing rights to "WRITE" before you can save the changes. If this is the case, set the editing rights to "WRITE", then save the Project, and then set the editing rights back to "READ".
Exit the Project. As the Project has just been explicitly saved, the Project does not need to be saved on close again.
Restart the Tygron Platform application.
In the main menu, opt to create a new Project and select the Template Project created so far.

In the location selection screen, place the location selection on approximately the same location as the Template Project is on. Of importance is to have it at least cover the area where the dataset was created earlier.
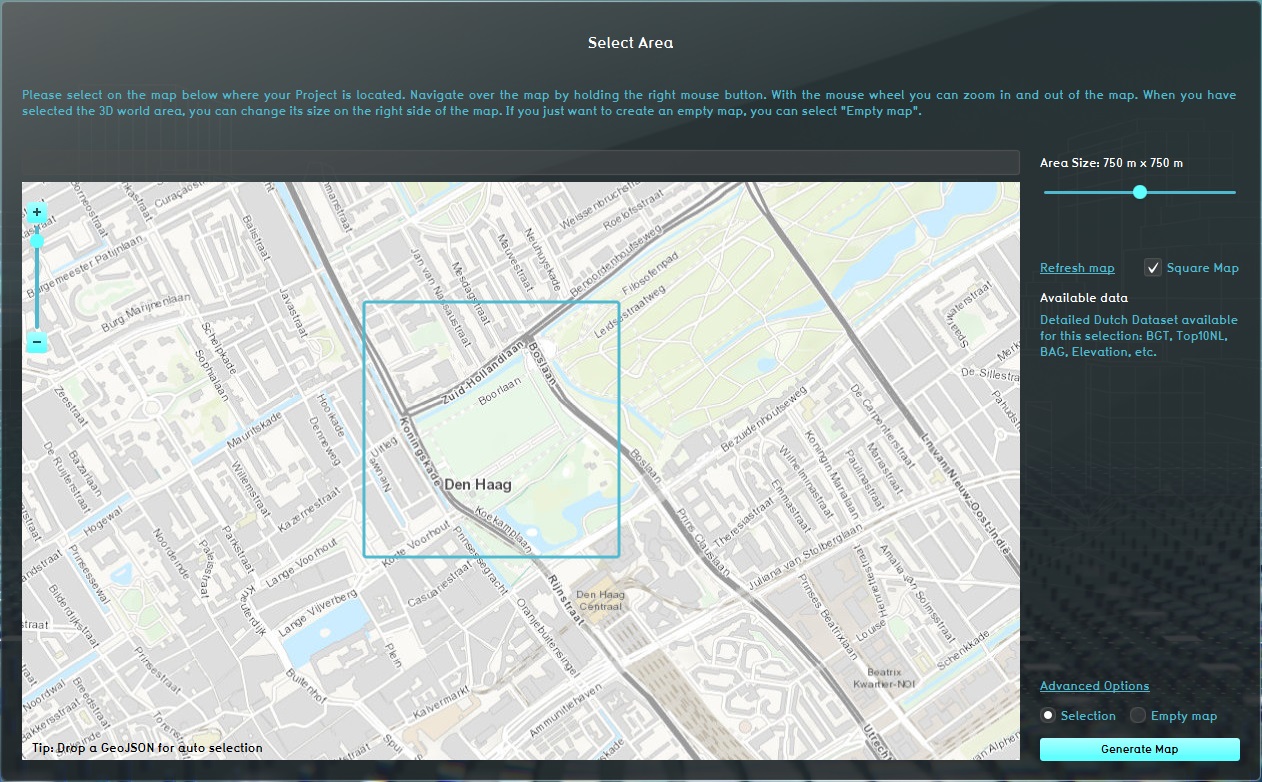
Open the "Advanced Options" panel.
Switch to the "Custom" tab. Ensure the Geo Plugin for Buildings" is deactivated. Ensure the Geo Plugin for "Trees" is active.
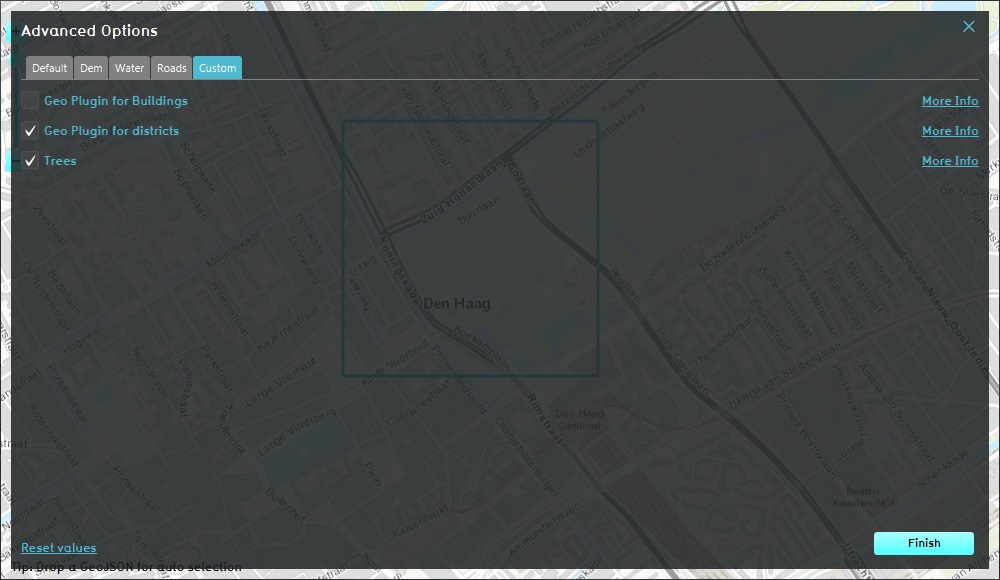
Start the map creation process.
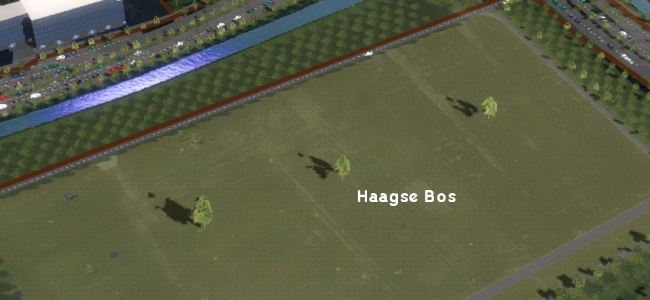
After the Project has generated and the 3D Visualization is rendered, find the locations where the dataset features are located. Previously, Buildings were generated in the area. Now notice 3 trees have been created.
In the editor, go to:
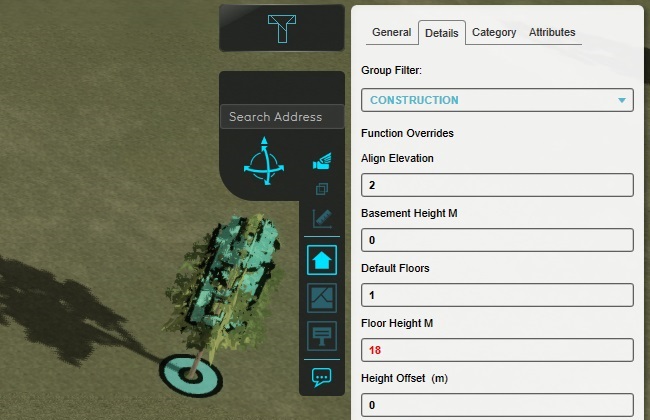
Click on one of the trees. Notice the polygon of the tree is only a small shape indicating the location of the trunk.

In the right panel, switch to the "Details" tab to see the Building's Function Values, en select the "CONSTRUCTION" filter. Notice the Floor Height M Function Value value is red (indicating it has a non-default value) matching the value which was set in the data these trees were based on.
Final notes
Although not part of the general explanation provided in this tutorial, the following notes are important to keep in mind:
- Features processed by Geo Plugins may match multiple Geo Links. The Geo Links with more rules regarding what features they match with take precedence over Geo Links with fewer rules.
- When using a BUILDINGS Geo Plugin to manually import data, the "Attribute Matching", Function assignment, and geometry transformation are applied as defined in the relevant Geo Links. However, Attribute mapping must still be defined manually in the Geo Data Wizard.
- An AREAS Geo Plugin does not need Geo Links, but they can be added to it to similarly filter features based on Attributes and modify Attributes on import.
- Building Geo Plugins, when used with Templates, are divided into separate Geo Plugins for Buildings and for Roads. This means that while a BUILDINGS Geo Plugin is set to be available for Templates, the Geo Plugin's Geo Links cannot be mapped to Road Functions.
- If you want to set up a Geo Plugin for Buildings which includes roads as well (such as a complete urban plan) and is meant to be used to manually import plans, set the Geo Plugin to not be used for new Projects. Geo Links part of that Geo Plugin can then be set to map to Roads as well.
Tutorial completed
Congratulations. You have now completed this tutorial. In it, you have learned how to create Geo Plugins and use them to automatically map geo data, and use them to automatically retrieve data when using your Project as a Template to create a new Project.