Traffic Model: Difference between revisions
| Line 8: | Line 8: | ||
== How does a Traffic Model relate to the {{software}}? == | == How does a Traffic Model relate to the {{software}}? == | ||
The main purpose of the default traffic model in the {{software}} is to simulate impact of traffic on the [[3D World]] through traffic densities. In order to calculate these traffic densities, data such as the number of traffic lanes, the traffic speed and the traffic flow on a particular lane can be | The main purpose of the default traffic model in the {{software}} is to simulate impact of traffic on the [[3D World]] through traffic densities. In order to calculate these traffic densities, data such as the number of traffic lanes, the traffic speed and the traffic flow on a particular lane can be added to the project.<br> | ||
Traffic related data can be found in: | |||
{{Editor ribbon|header=Geo Data|bar=Buildings}} | |||
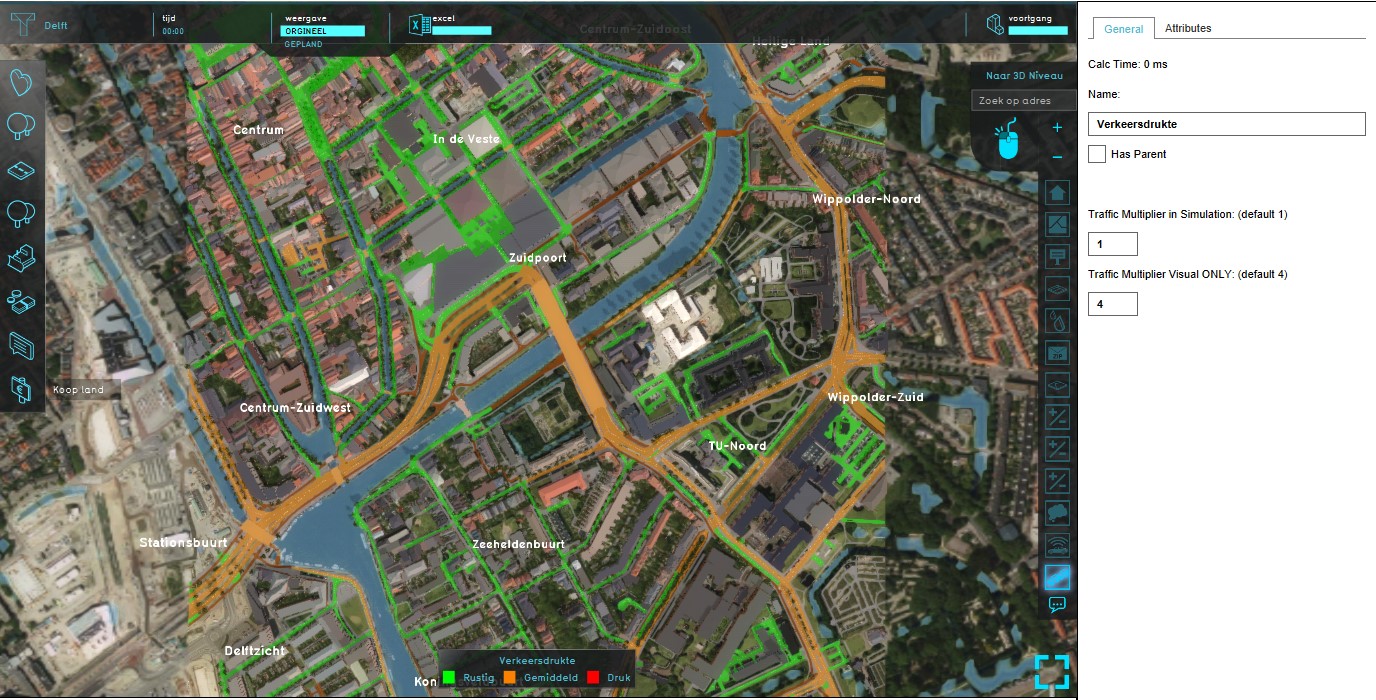
[[File:Traffic_Density_Overlay.jpg|thumb|160px|left|Traffic Density Overlay]] | [[File:Traffic_Density_Overlay.jpg|thumb|160px|left|Traffic Density Overlay]] | ||
===Traffic Density=== | ===Traffic Density=== | ||
Revision as of 08:35, 19 September 2018
What is a Traffic Model
From Wikipedia, the free encyclopedia
A traffic model is a mathematical model of real-world traffic, usually, but not restricted to, road traffic. Traffic modeling draws heavily on theoretical foundations like network theory and certain theories from physics like the kinematic wave model. The interesting quantity being modeled and measured is the traffic flow, i.e. the throughput of mobile units (e.g. vehicles) per time and transportation medium capacity (e.g. road or lane width).
How does a Traffic Model relate to the Tygron Platform?
The main purpose of the default traffic model in the Tygron Platform is to simulate impact of traffic on the 3D World through traffic densities. In order to calculate these traffic densities, data such as the number of traffic lanes, the traffic speed and the traffic flow on a particular lane can be added to the project.
Traffic related data can be found in:
Template:Editor ribbon

Traffic Density
Traffic density is measured by the amount of units per kilometer road section per hour. In the Tygron Platform this is by default calculated on the basis of the location of the roads and road type (PDOK NBW) and the traffic intensities of these road sections (INWEVA 2015/VI-Lucht & Geluid), and can be changed by changing the amount of units per hour per road section. These traffic intensities are shown in the Traffic Density (Overlay) map.

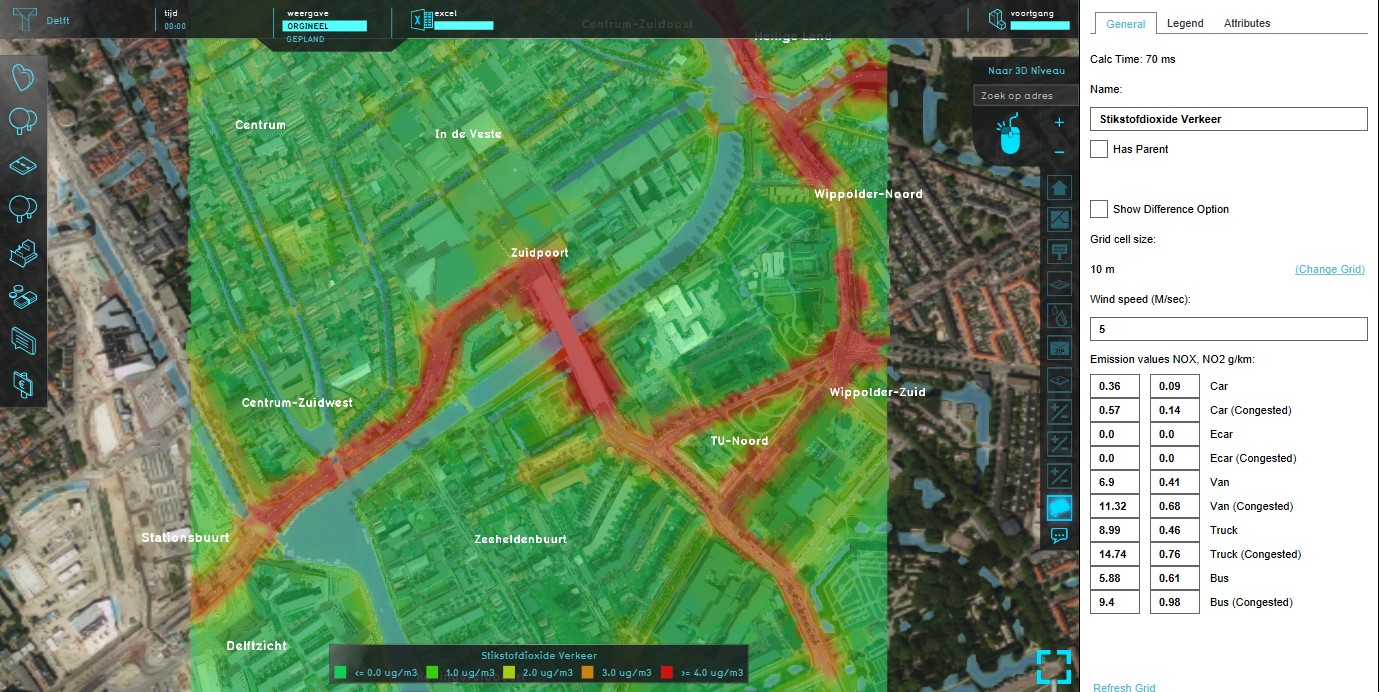
Traffic NO2
Traffic NO2 refers to Nitrogen dioxide pollution caused by traffic. This is calculated by default by combining the data of the location of the roads and road type (PDOK NBW) with air quality data sets based on location and traffic types (NSL Monitoringstool/ VI-Lucht & Geluid). The No2 pollution is displayed on the Traffic NO2(Overlay) map.

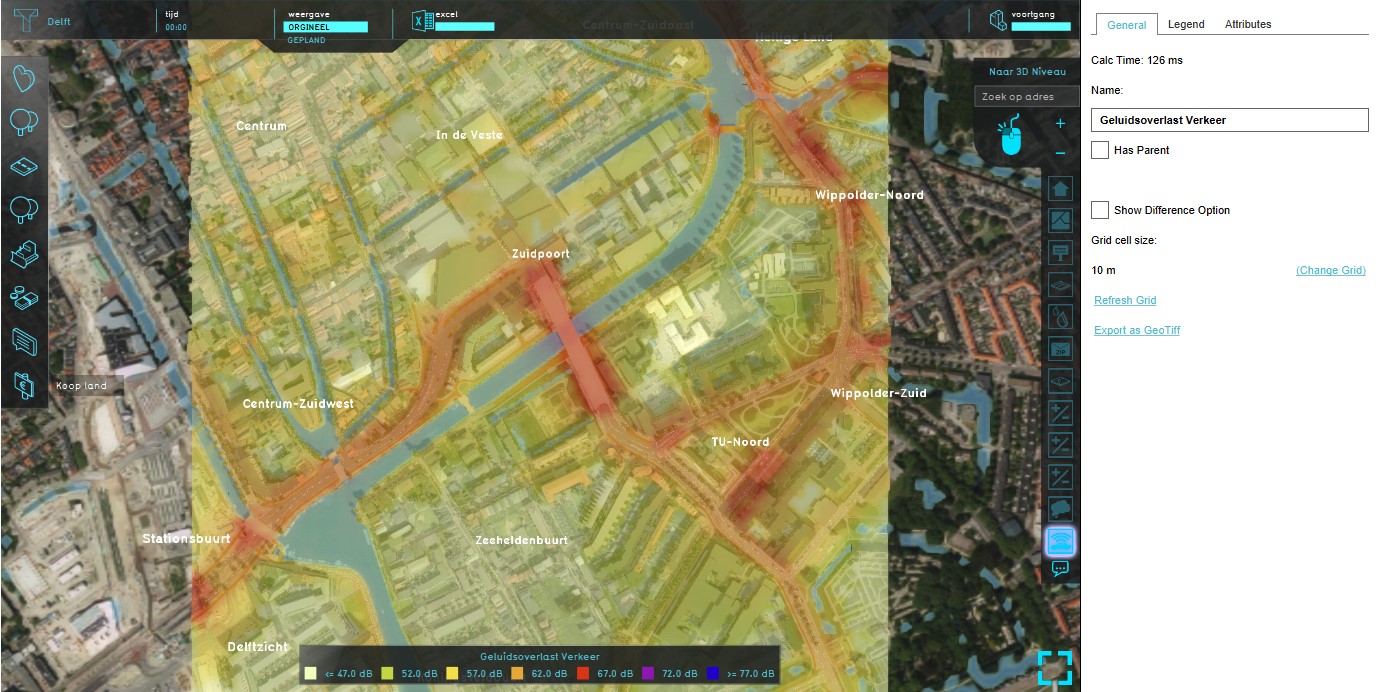
Traffic Noise
One of the main sources of environmental noise in the Netherlands is road traffic. The Traffic Noise (Overlay) displays the impact of these sounds generated by traffic on the surrounding area. This overlay is based on available data about traffic noise (VI-Lucht & Geluid).
Traffic Data available in the Tygron Platform
The Tygron Platform makes, by default, traffic based calculations for results such as the Traffic Density Overlay, the Traffic NO2 Overlay and Traffic Noise Overlay. These calculations are based on many different data sets. These data sets are different for each location/country.
Data Sources
When creating a new project based on real data in the Tygron Platform, a standard traffic model is generated for the selected project area, based on available (open) data sources. This model is based on road location (NBW), road type (NBW), traffic intensity (INWEVA 2015/VI-Lucht & Geluid), air quality(NSL Monitoringstool/VI-Lucht & Geluid) and traffic noise (VI-Lucht & Geluid).
NSL Monitoringstool
- The Dutch governement, provinces en local authorities cooperate to improve the air quality. This is done under the umbrella of het Nationaal Samenwerkingsprogramma Luchtkwaliteit (NSL). As a result, the NSL Monitoringstool is made available to provide air quality data.
- See also: https://www.nsl-monitoring.nl/
PDOK NBW wegen (Nationaal Wegen Bestand)
- 'NWB-Wegen' is a digital geographical file containing almost all roads in the Netherlands. Included are all roads that are managed by the national government, provinces, municipalities and water authorities, but only when these roads are assigned a name or number. This file is actualized every four years.
- See also: https://www.pdok.nl/nl/service/wfs-nwb-wegen-nationaal-wegen-bestand
INWEVA 2015
- INWEVA is short for INtensiteiten op WEgVAkken (traffic intensities on road sections). Traffic intensities are measured on ca. 3000 road sections. For the other sections intensities are estimated, based on traffic modeling. The data are yearly averages per road section, and updated each year.
- See also: https://nis.rijkswaterstaat.nl/portalcontent/logon/p2_33.html
VI-Lucht & Geluid
- VI-Lucht en Geluid is a Dutch tool that provides the following data for a specific section of a road:
- An average traffic intensity expressed in motor vehicles per week day, per average daytime hour, per average evening hour, per average nighttime hour
- The share and size of medium heavy and heavy freight traffic
- The share and size of bus traffic
- In januari 2016 the application was updated and actualized for the last time.
- See also: https://www.infomil.nl/onderwerpen/klimaat-lucht/luchtkwaliteit/slag/hulpmiddelen/inschatten/
Add a Custom Traffic Model
Besides using the default traffic data, it is also possible to add a custom traffic model, better suited for the project case. A custom traffic model can be added directly as a static model, or as areas for a dynamic model.
In order to upload a custom traffic model, it has to first be properly prepared as a Geojson file, in the correct coordinate system.
See also: Geojson
Static Custom Traffic Model
A static model does not change (over time), when changes occur in the 3D world.
To upload a Static Custom Traffic Model directly as static data, a prepared Geojson file can be dragged and dropped on the Editor window. A panel appears, where the option "Import Building Values" needs to be selected. The Geojson file has to contain an attribute named 'TRAFFIC_FLOW" (vehicles/ hour), so that constructions that are touched by sections of the traffic data are given the value of the attribute belonging to that section.
- Drag and drop a prepared Geojson file on the Editor
- Select "Import Building Values" from the "File Handler" panel
- Ensure the attribute TRAFFIC_FLOW is activated on the "Import Building Values File" panel
- Select the "Send" button on the same panel
-
Drag and drop a prepared Geojson file on the Editor
-
Select "Import Building Values" from the "File Handler" panel
-
Ensure the attribute TRAFFIC_FLOW is activated
-
Select the "Send" button
Dynamic Custom Traffic Model
A dynamic model changes (over time), according to changes in the 3D world.
To create a Dynamic Custom Traffic Model, the same Geojson file can be used. In this case "Import Areas" is selected on the File Handler panel, instead of "Import Building Values". The sections of the Dynamic Custom Traffic Model will be added to the project as areas.
An Excel file can be added, for example as an indicator or panel, which updates constructions dynamically. A panel is preferable because it does not always have to be made available to the user. More detailed examples of excel indicators that use the traffic model are the Traffic NO2 (Indicator) and the Traffic Noise (Indicator). To change the Dynamic Custom Traffic Model, a TQL statement such as the following can be used:
UPDATE_BUILDING_TRAFFIC_FLOW_WHERE_AREA_IS_6(This statement updates the attribute "TRAFFIC_FLOW" (vehicles/ hour) of constructions located in Area 6.)
The excel implementation of a light Dynamic Custom Traffic Model as described above, consists of the following consecutive steps:
- Retrieval of the original traffic density in Area X -
SELECT_ATTRIBUTE_WHERE_NAME_IS_TRAFFIC_FLOW_AND_AREA_IS_X - Calculation in an excel file, with the new traffic density as outcome -
original traffic density + change - Output of the new traffic density for constructions in Area X -
UPDATE_BUILDING_TRAFFIC_FLOW_WHERE_AREA_IS_X
- Retrieval of the original traffic density in Area X -
- Drag and drop a prepared Geojson file on the Editor
- Select "Import Areas" from the "File Handler" panel
- Ensure the attribute TRAFFIC_FLOW is activated on the "Import Areas File" panel
- Select the "Send" button on the same panel
-
Drag and drop a prepared Geojson file on the Editor
-
Select "Import Areas" from the "File Handler" panel
-
Ensure the attribute TRAFFIC_FLOW is activated
-
Select the "Send" button