Calculation panel
Calculation Panel
The Calculation Panel can be found by hovering with your mouse over the test run button.

The options in this panel will allow you to reset how indicators, panels and overlays are being calculated.
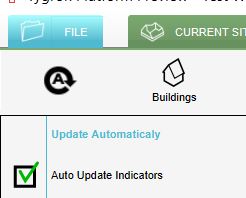
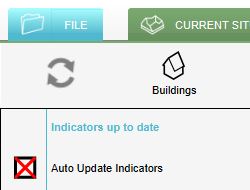
Auto-update indicators


This option is by default turned on. This means that whenever you make a change in the Editor, the indicators, panels and overlays will be recalculated, When the auto-update is not checked, you have to manually refresh the indicators/panels by choosing one of the following two Reset options (see below).
Reset to Start Values and Reset X Queries
Below an explanation of the difference between the two options:
Most of the time, in an Excelsheet X Queries are used. If you have for example three areas in your project, an X query would be as follows:
SELECT....WHERE_AREA_IS_X
In the Tygron Platform this query is translated to the following three queries:
SELECT....WHERE_AREA_IS_0
SELECT....WHERE_AREA_IS_1
SELECT....WHERE_AREA_IS_2
When using Reset to Start Values, for example if you changed an attribute of one of these areas, the three queries are recalculated.
If you choose Reset X Queries, the X Query is again translated to queries. If you for example added a new area, in the Tygron Platform the X Query is then translated to:
SELECT....WHERE_AREA_IS_0
SELECT....WHERE_AREA_IS_1
SELECT....WHERE_AREA_IS_2
SELECT....WHERE_AREA_IS_3
If you used Reset to Start Values in this case, the fourth area was not taken into account, since the three queries would be recalculated again and the Tygron Platform would not translate the X query to other queries.
When to choose which option?
Choose Reset to X Queries if the amount of areas or neighborhoods is changed (for example by adding or removing an area/neighborhood). Choose Reset to Start Values if the amount of areas or neighborhoods stays the same (for example if you only changed an attribute of an area or if you did not use X Queries in your Excelsheet.
Using one of these two option affects all indicators, panels and grid overlays.
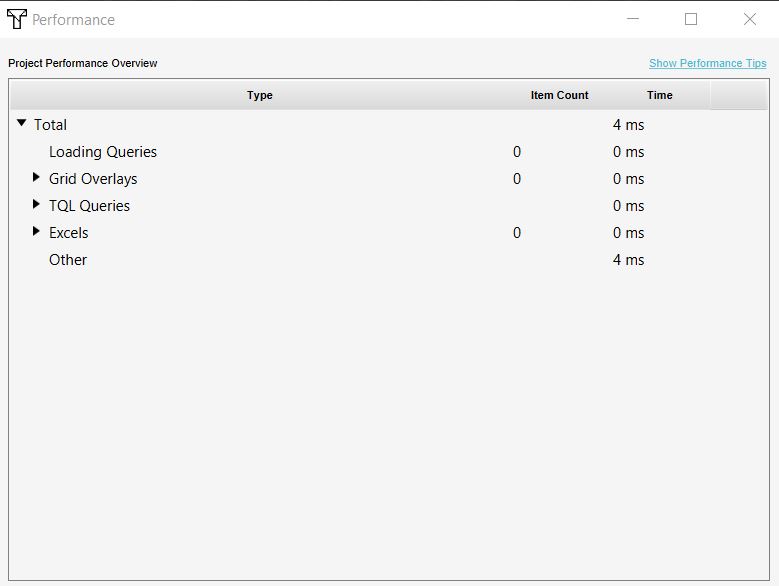
Performance Overview

The performance overview shows an overview of the components in a project and their calculation time. If your project performance is slow, check the overview to see which component could cause this.