Overlay

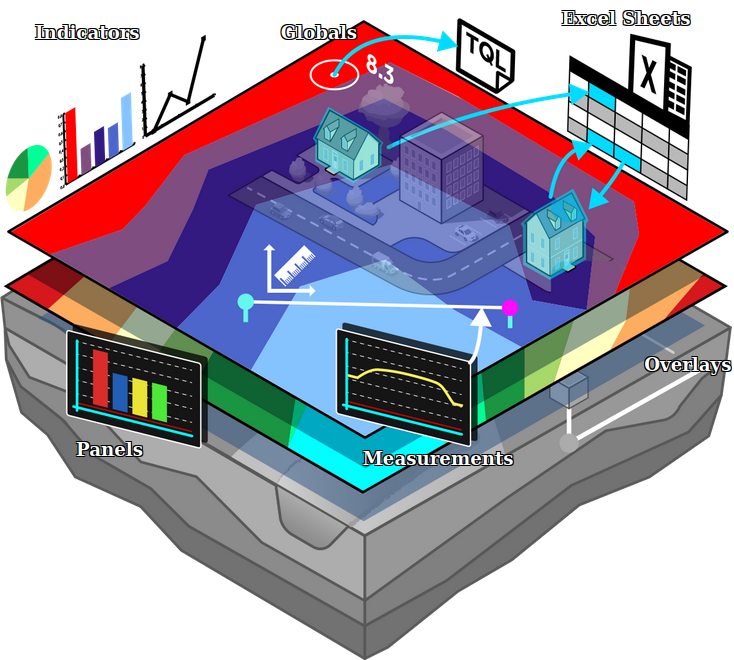
An overlay is a layer visualized on top of the terrain and buildings in the 3D visualization. Overlays can provide spatial insight into specific subject, such as the variation of height and ownership. The visualized properties can originate from the current state of the project or from a result of a spatial calculation.
However, most overlays that can be added to a project use an underlying calculation model, which rasterize the spatial data and apply calculations to it to produce various (intermediate) results. These computational overlays can range from simple distance and average operations to complex water simulations. For these more complex Overlays with multiple results, additional Result Child Overlays can be added. The calculation main and child results will always be governed by the main overlay, also called the Result Parent Overlay.
How to access overlays in a project

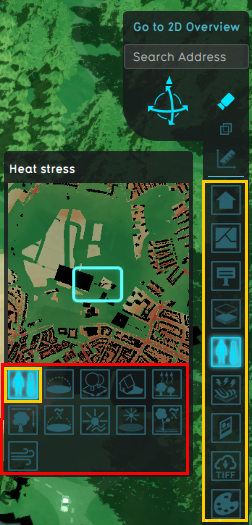
Overlays available to stakeholders appear as buttons on the right side of the interface. Clicking on any of these buttons will switch the view to the specific overlay. Clicking on the "City" overlay will switch the view back to default. Some overlays are automatically added when a project is created. Some overlays are closely related to indicators, such as Heatstress and Livability.
Parent Overlay
Overlays can be grouped together using a Parent-Child hierarchy. Hovering over any of the Overlays in the Navigation Panel will show additional icons for the Child Overlays of that Overlay.
Every Overlay is considered a Parent Overlay, unless it has a Parent Overlay set, in which case it becomes a Child Overlay of that Parent Overlay. Overlays with Child Overlays cannot be a Child Overlay to another Overlay. Result Child Overlays are always Child Overlays of other Overlays.
When a parent overlay is removed, it's child overlays are not removed, unless the child overlay is a result child type overlay. Otherwise, they simply have no parent overlay set anymore and become a parent overlay themselves.
List of available Overlays
| Icon | Name | Category | Type | Displays |
|---|---|---|---|---|
| |
City | Default | None | The default view without any overlay |
| |
Ownership | Administrative | Feature | Ownership of constructions/ plots |
| |
Ownership Grid | Administrative | Grid | Ownership of constructions/ plots |
| |
Municipalities | Administrative | Feature | Municipalities in the project area |
| |
Neighborhoods | Administrative | Feature | Neighborhoods in the project area |
| |
Vacancy | Administrative | Feature | Constructions marked as vacant are highlighted |
| |
Zipcodes | Administrative | Feature | Postal codes |
| |
Zoning | Administrative | Feature | Zoning (related to zoning plans) |
| |
Heat | Environmental | Grid | Urban heat stress |
| |
Livability | Environmental | Grid | Livability score |
| |
Traffic Density | Environmental | Grid | Traffic density |
| |
Traffic Noise | Environmental | Grid | Impact of traffic noise polution on surrounding area |
| |
Traffic NO2 | Environmental | Grid | Impact of traffic NO2 polution on surrounding area |
| |
Flooding | Water | Grid | Impact of flooding on inundation |
| |
Groundwater | Water | Grid | Underground water tables |
| |
Rainfall | Water | Grid | Impact of rainfall on inundation |
| |
Subsidence | Water | Grid | Areas subject to subsidence |
| |
Watershed | Water | Grid | Discharge areas based on DTM or Water overlay's flow direction. |
| |
Average | Grid Calculation | Grid | Smoothened values of grid cells |
| |
Distance | Grid Calculation | Grid | Defined contour around an object |
| |
Sight Distance | Grid Calculation | Grid | Combined distance zone with line of sight |
| |
Travel Distance | Grid Calculation | Grid | Contour based on travel distance |
| |
Shadow | Grid Calculation | Grid | Shadow |
| |
Inference | Grid Calculation | Grid | AI Inference |
| |
Iteration | Grid Calculation | Grid | Iteration Collector |
| |
Area | Geo Data | Feature | Selection of Areas |
| |
Attribute | Geo Data | Feature | Presence of a specific attribute in a data layer |
| |
Combo | Grid Calculation | Grid | Combines up to three grid overlays using mathematical functions and boolean operators. |
| |
GeoTIFF | Geo Data | Grid | External data in GeoTIFF format |
| |
Image | Geo Data | Grid | A custom image |
| |
WCS | Geo Data | Grid | Stores the GeoTIFF result of a Web Coverage Service as a Grid Overlay. |
| |
WMS | Geo Data | Grid | Stores the result of a Web Image Service as a Grid Overlay. |
| |
Satellite | Topography | Grid | Satellite Imagery |
| |
Digital Surface Model | Topography | Grid | Height of the terrain and building heights (DSM) |
| |
Digital Terrain Model | Topography | Grid | Height of the terrain (DTM) |
| |
Function | Geo Data | Feature | Highlights specific functions/ buildings |
| |
Source | Topography | Feature | Datasets/sources currently in use for generating the project |
| |
Underground | Topography | Feature | Underground composition |
| |
Network Distance | Networks | Feature | Distance to lines of a network |
| |
Network Overview | Networks | Feature | Lines, loads and cluster topography of a network |
| |
Network Ownership | Networks | Feature | Ownership of lines, loads and clusters of a network |
Notes
- The following overlays are added automatically when creating a new project: City, Neighborhoods and Ownership. Depending on the project sources, Zoning and Underground Overlay can also be added.
- Grid overlays have the ability to show the difference between the maquette and the current state. The difference visualization uses its own legend, which can also be manually adjusted. The option to show the difference can be turned on or off per Grid Overlay.
- Overlays can be given Attributes. Some of these Attributes are used by their calculation model.
- Some overlays can have the option to visualize different (intermediate) results of its calculation. These are configured using the result types. For example, for the Water Overlay the result types include the surface last value result type and the groundwater result type for water above and below ground respectively.
- Some overlays store multiple timeframes of results. Examples are the Water Overlay and the Heat Overlay. Each timeframe is a complete snapshot of results of the entire project area. These results can be viewed in sequence. When these overlays are visualized in the 2D map, the last timeframe is shown.
How-to's
General:
Grid Overlay specific:
- How to configure a Grid Overlay's legend
- How to set an Overlay to active or inactive
- How to delay Grid Overlay calculations
- How to force Grid Overlays to recalculate
- How to create an overlay for visualizing your own geographical vector information
- How to use a Grid Overlay to change the elevation model
- How to smooth Grid Overlay results
In/out:
See also